

Assumptions behind scoring source versus item memory: Effects of age, hippocampal lesions and mild memory problems
- PMID: 28162777
- PMCID: PMC5460522
- DOI: 10.1016/j.cortex.2017.01.001
Assumptions behind scoring source versus item memory: Effects of age, hippocampal lesions and mild memory problems
Abstract
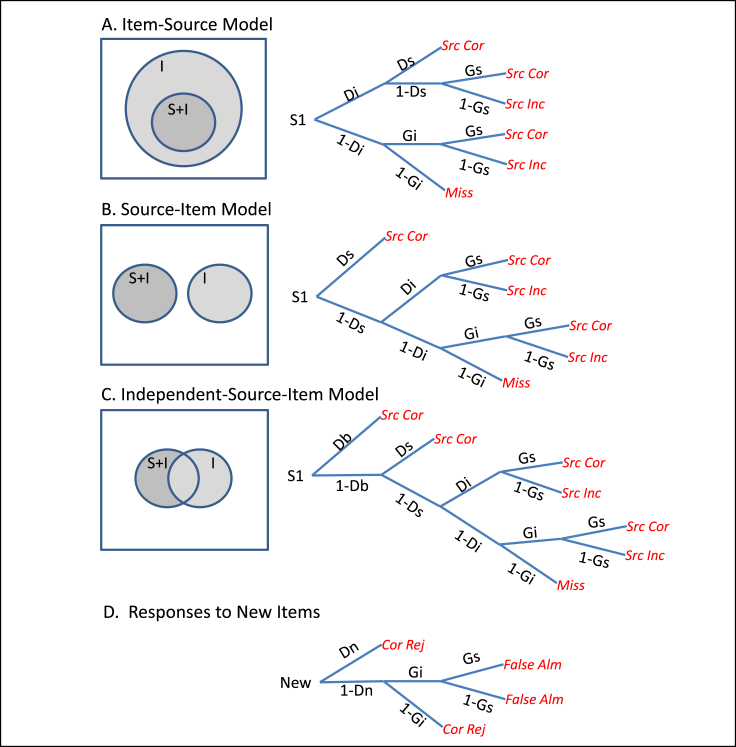
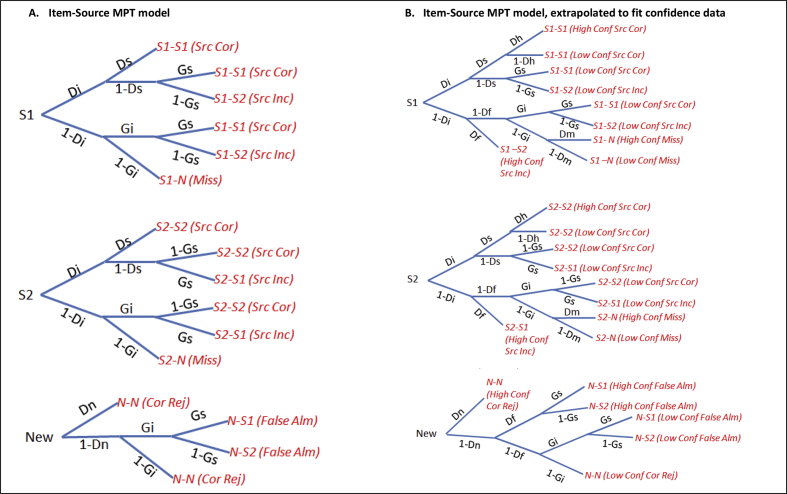
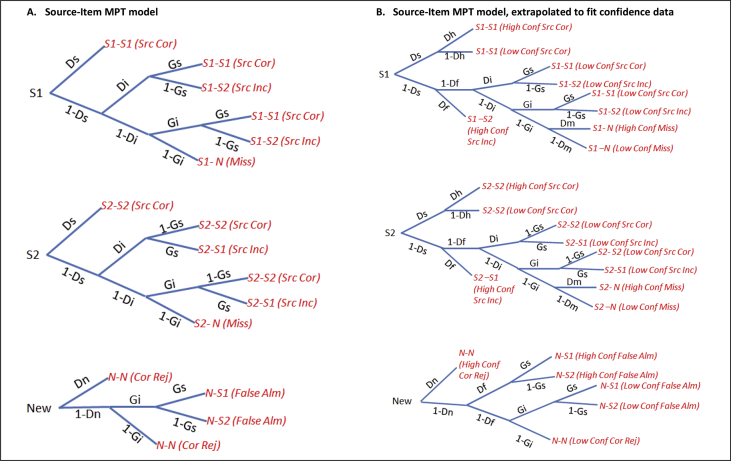
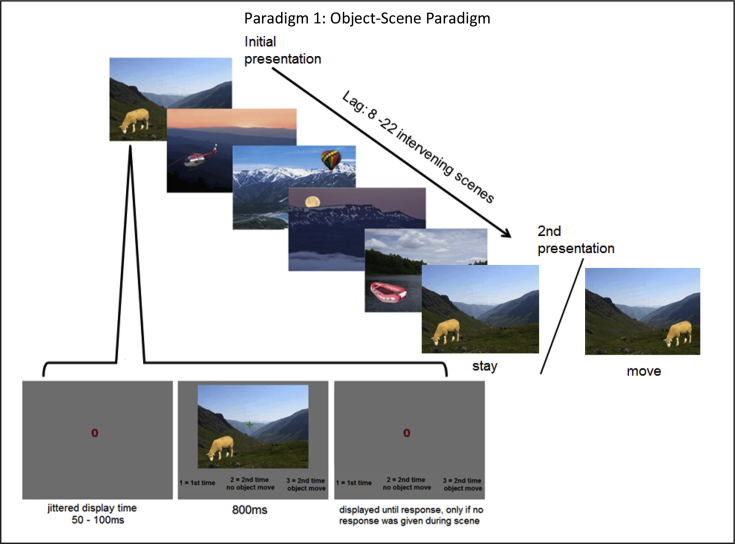
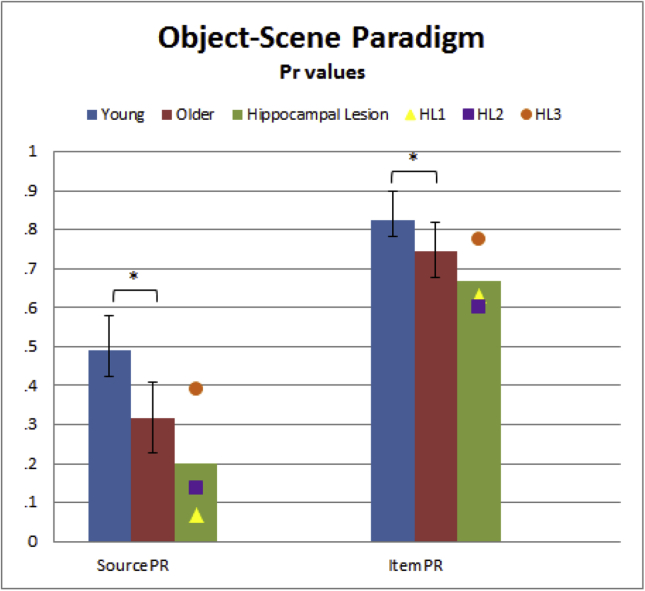
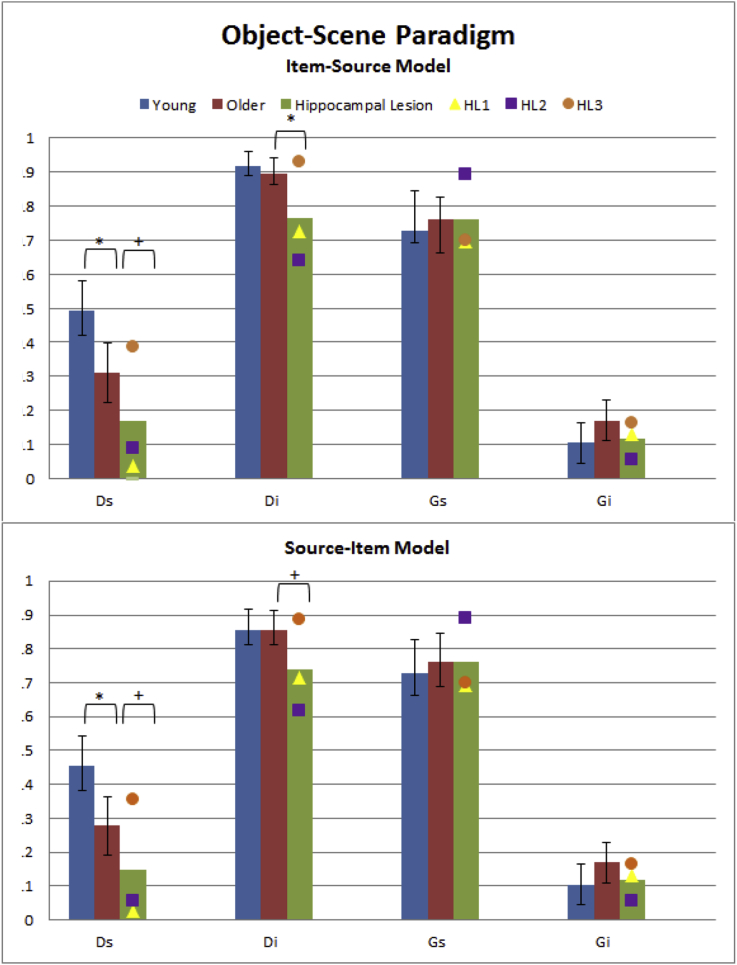
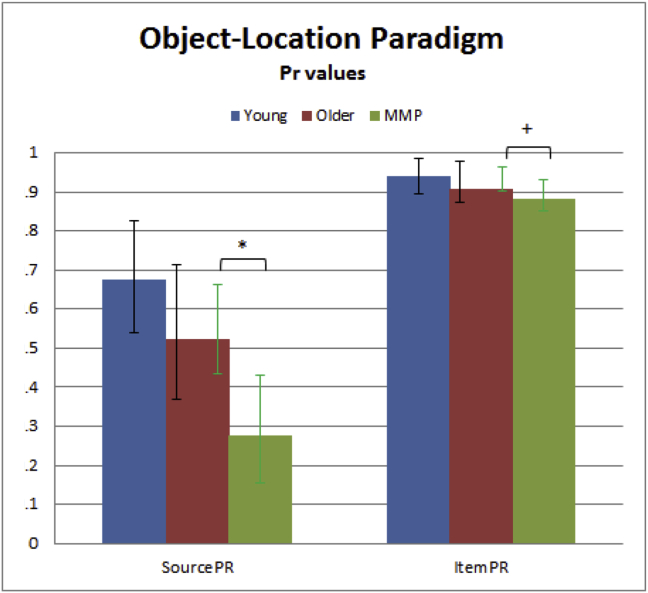
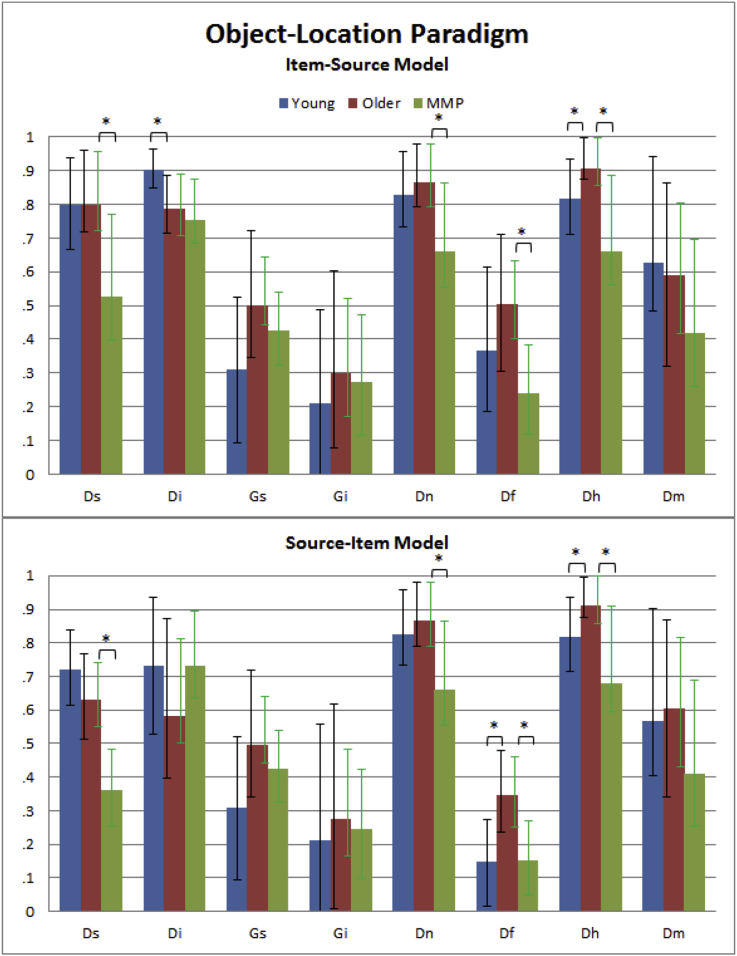
Source monitoring paradigms have been used to separate: 1) the probability of recognising an item (Item memory) and 2) the probability of remembering the context in which that item was previously encountered (Source memory), conditional on it being recognised. Multinomial Processing Tree (MPT) models are an effective way to estimate these conditional probabilities. Moreover, MPTs make explicit the assumptions behind different ways to parameterise Item and Source memory. Using data from six independent groups across two different paradigms, we show that one would draw different conclusions about the effects of age, age-related memory problems and hippocampal lesions on Item and Source memory, depending on the use of: 1) standard accuracy calculation vs MPT analysis, and 2) two different MPT models. The MPT results were more consistent than standard accuracy calculations, and furnished additional parameters that can be interpreted in terms of, for example, false recollection or missed encoding. Moreover, a new MPT structure that allowed for separate memory representations (one for item information and one for item-plus-source information; the Source-Item model) fit the data better, and provided a different pattern of significant differences in parameters, than the more conventional MPT structure in which source information is a subset of item information (the Item-Source model). Nonetheless, there is no theory-neutral way of scoring data, and thus proper examination of the assumptions underlying the scoring of source monitoring paradigms is necessary before theoretical conclusions can be drawn.
Keywords: Ageing; Item memory; Multinomial processing tree models; Source memory; Source monitoring.
Copyright © 2017 The Authors. Published by Elsevier Ltd.. All rights reserved.
Figures
Comment in
-
Memory representations, tree structures, and parameter polysemy: Comment on Cooper, Greve, and Henson (2017).Cortex. 2017 Nov;96:148-155. doi: 10.1016/j.cortex.2017.05.015. Epub 2017 Jun 2. Cortex. 2017. PMID: 28673387 No abstract available.
-
Assumptions behind scoring source and item memory impact on conclusions about memory: A reply to Kellen and Singmann's comment (2017).Cortex. 2017 Nov;96:156-157. doi: 10.1016/j.cortex.2017.08.011. Epub 2017 Aug 26. Cortex. 2017. PMID: 28919223 Free PMC article. No abstract available.
Similar articles
-
Hippocampal damage impairs recognition memory broadly, affecting both parameters in two prominent models of memory.Proc Natl Acad Sci U S A. 2013 Apr 16;110(16):6577-82. doi: 10.1073/pnas.1304739110. Epub 2013 Apr 1. Proc Natl Acad Sci U S A. 2013. PMID: 23576763 Free PMC article.
-
Medial temporal lobe function and recognition memory: a novel approach to separating the contribution of recollection and familiarity.J Neurosci. 2011 Nov 2;31(44):16026-32. doi: 10.1523/JNEUROSCI.3012-11.2011. J Neurosci. 2011. PMID: 22049444 Free PMC article.
-
Functional and Neuroanatomic Specificity of Episodic Memory Dysfunction in Schizophrenia: A Functional Magnetic Resonance Imaging Study of the Relational and Item-Specific Encoding Task.JAMA Psychiatry. 2015 Sep;72(9):909-16. doi: 10.1001/jamapsychiatry.2015.0276. JAMA Psychiatry. 2015. PMID: 26200928 Free PMC article.
-
Mnemonic Similarity Task: A Tool for Assessing Hippocampal Integrity.Trends Cogn Sci. 2019 Nov;23(11):938-951. doi: 10.1016/j.tics.2019.08.003. Epub 2019 Oct 6. Trends Cogn Sci. 2019. PMID: 31597601 Free PMC article. Review.
-
Moving beyond standard procedures to assess spontaneous recognition memory.Neurosci Biobehav Rev. 2015 Jun;53:37-51. doi: 10.1016/j.neubiorev.2015.03.013. Epub 2015 Apr 2. Neurosci Biobehav Rev. 2015. PMID: 25842032 Review.
Cited by
-
The vertical position of visual information conditions spatial memory performance in healthy aging.Commun Psychol. 2023 Jul 25;1(1):2. doi: 10.1038/s44271-023-00002-3. Commun Psychol. 2023. PMID: 39242667 Free PMC article.
-
Sensitivity of Reality Monitoring to Fluency: Evidence from Behavioral Performance and Event-Related Potential (ERP) Old/New Effects.Med Sci Monit. 2019 Dec 12;25:9490-9498. doi: 10.12659/MSM.917401. Med Sci Monit. 2019. PMID: 31830005 Free PMC article.
-
Does gaze direction of fearful faces facilitate the processing of threat? An ERP study of spatial precuing effects.Cogn Affect Behav Neurosci. 2021 Aug;21(4):837-851. doi: 10.3758/s13415-021-00890-0. Epub 2021 Apr 12. Cogn Affect Behav Neurosci. 2021. PMID: 33846951
-
Disrupters as Well as Monitors: Roles of Others During and After Collaborative Remembering in the DRM Procedure.Adv Cogn Psychol. 2019 Nov 14;15(4):276-289. doi: 10.5709/acp-0275-1. eCollection 2019. Adv Cogn Psychol. 2019. PMID: 32494313 Free PMC article.
-
Multinomial models reveal deficits of two distinct controlled retrieval processes in aging and very mild Alzheimer disease.Mem Cognit. 2018 Oct;46(7):1058-1075. doi: 10.3758/s13421-018-0821-9. Mem Cognit. 2018. PMID: 29796864 Free PMC article.
References
-
- Arnold N.R., Bayen U.J., Kuhlmann B.G., Vaterrodt B. Hierarchical modeling of contingency-based source monitoring: A test of the probability-matching account. Psychonomic Bulletin & Review. 2013;20:326–333. - PubMed
-
- Batchelder W.H., Riefer D.M. Multinomial processing models of source monitoring. Psychological Review. 1990;97(4):548–564.
-
- Bayen U.J., Murmane K., Erdfelder E. Source discrimination, item detection, and multinomial models of source monitoring. Journal of Experimental Psychology: Learning, Memory, and Cognition. 1996;22(1):197–215.
MeSH terms
Grants and funding
LinkOut - more resources
Full Text Sources
Other Literature Sources
Medical
