. 2017 Feb 22;93(4):867-881.e6.
doi: 10.1016/j.neuron.2017.01.010. Epub 2017 Feb 2.

Axonal Endoplasmic Reticulum Ca2+ Content Controls Release Probability in CNS Nerve Terminals

Affiliations

Axonal Endoplasmic Reticulum Ca2+ Content Controls Release Probability in CNS Nerve Terminals

Jaime de Juan-Sanz et al. Neuron. .

Abstract

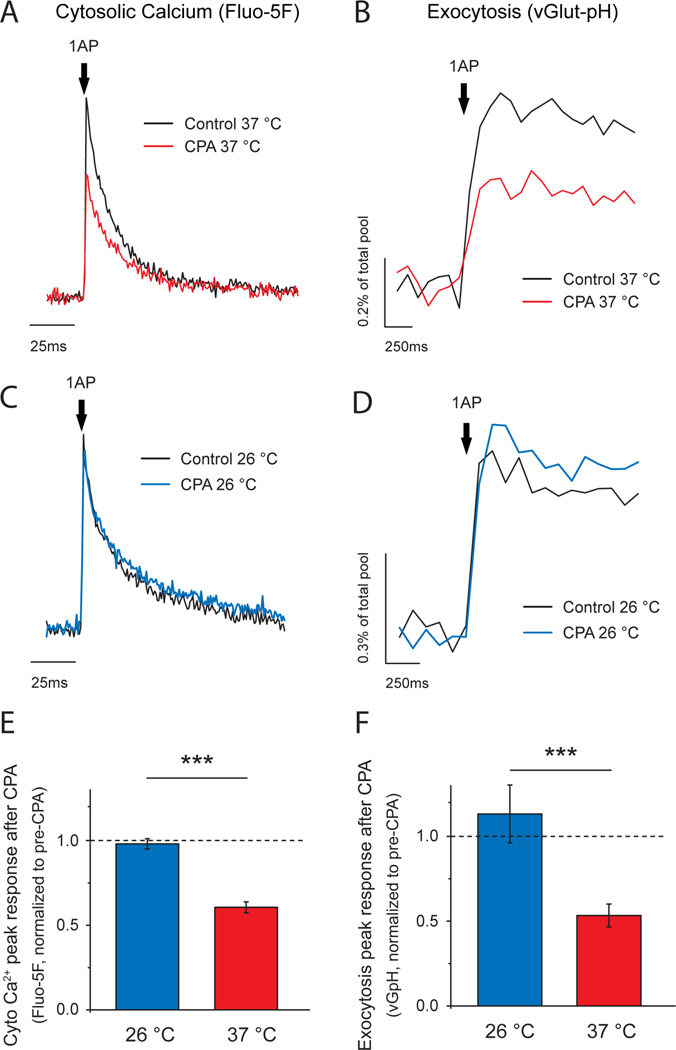
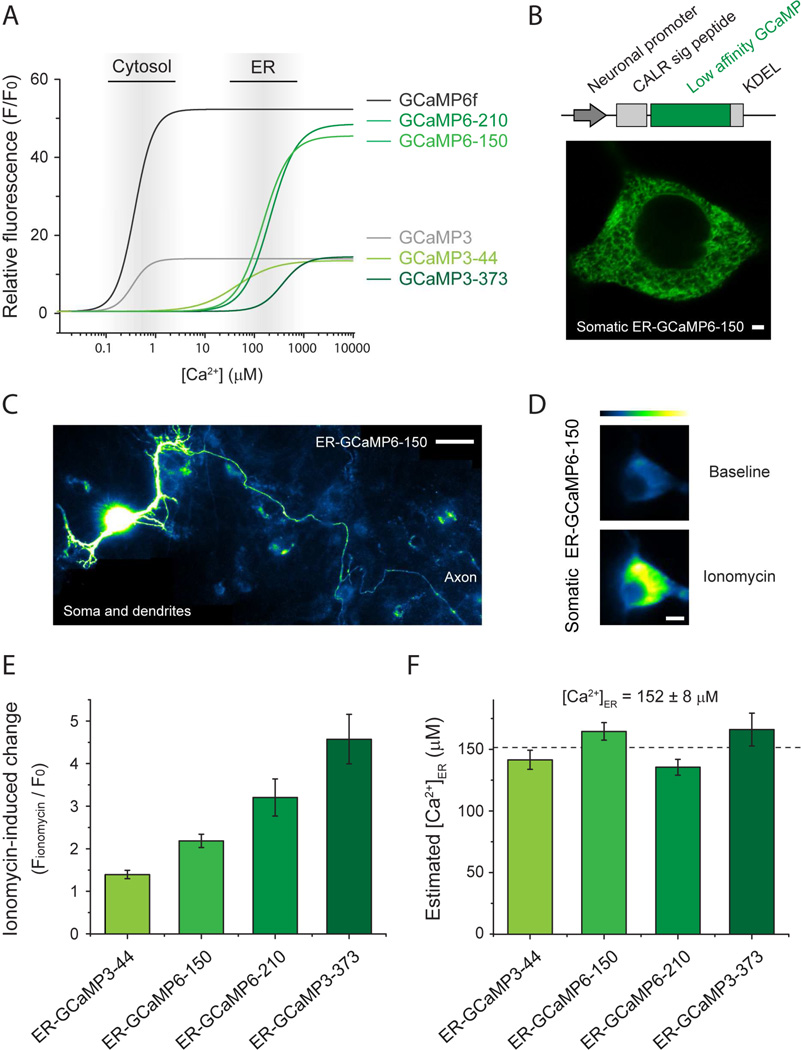
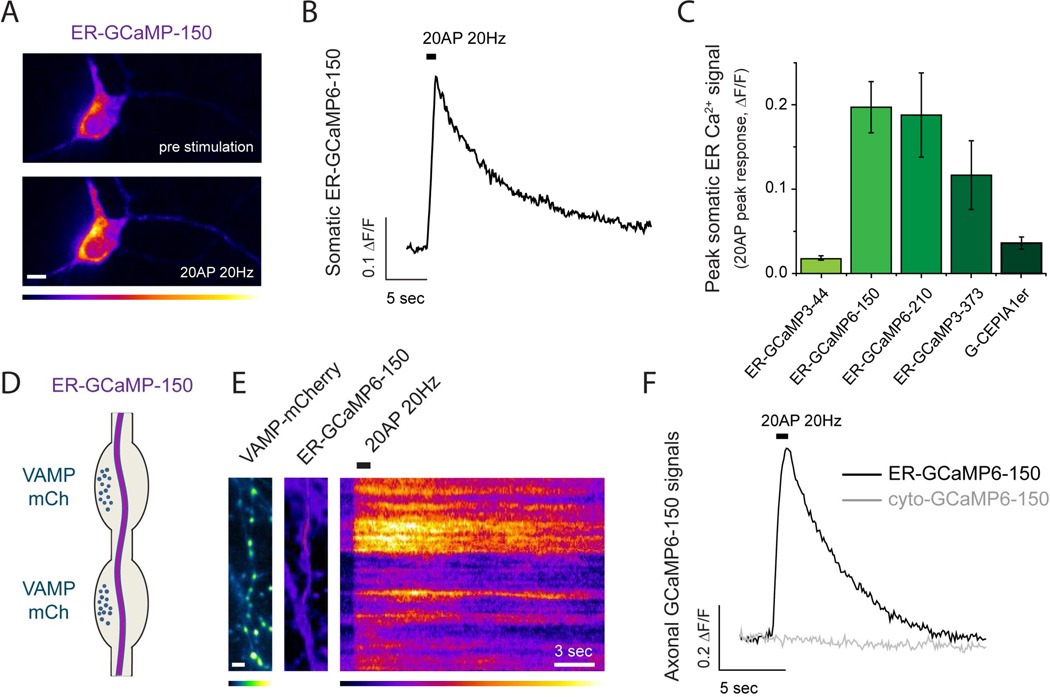
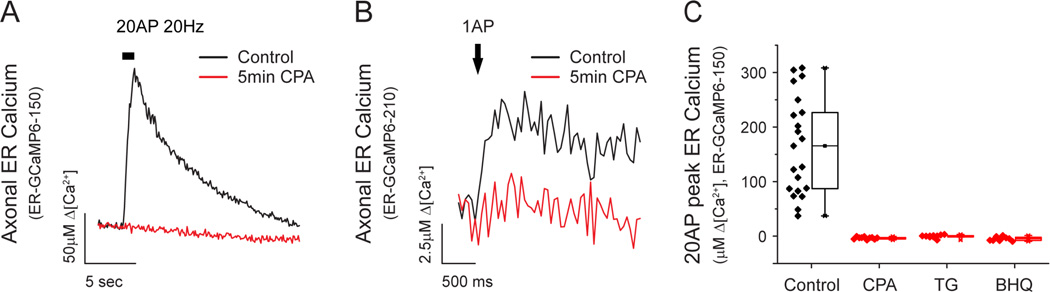
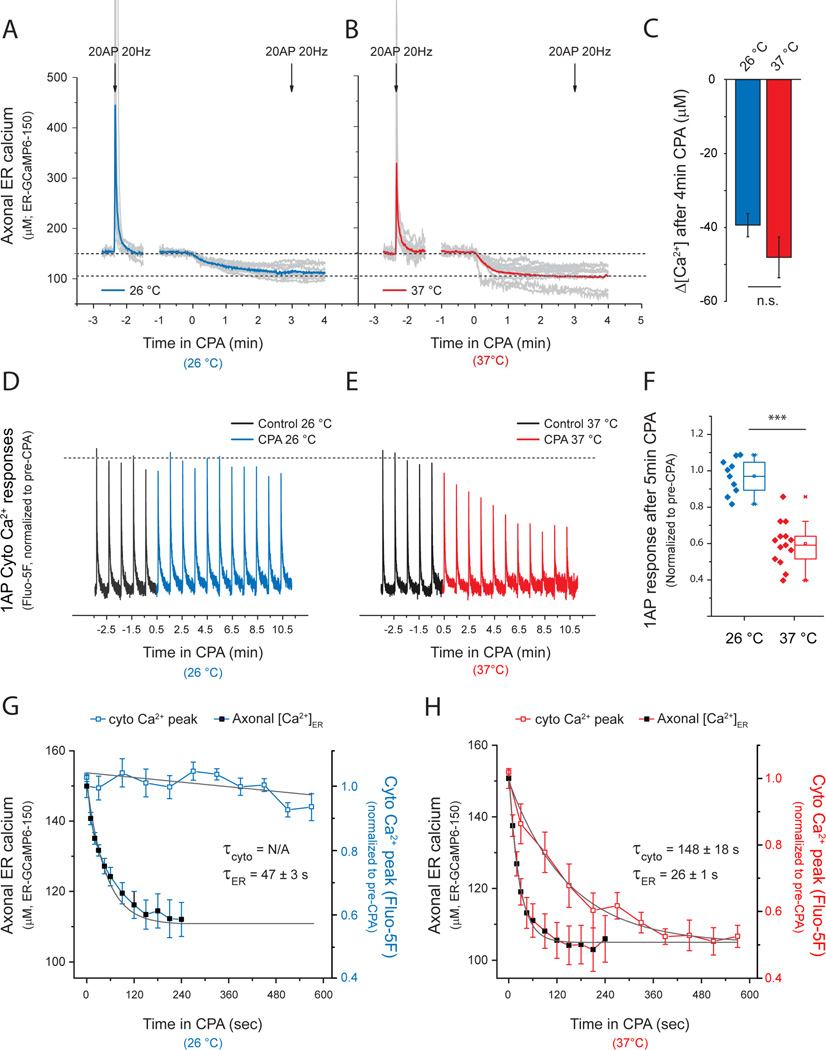
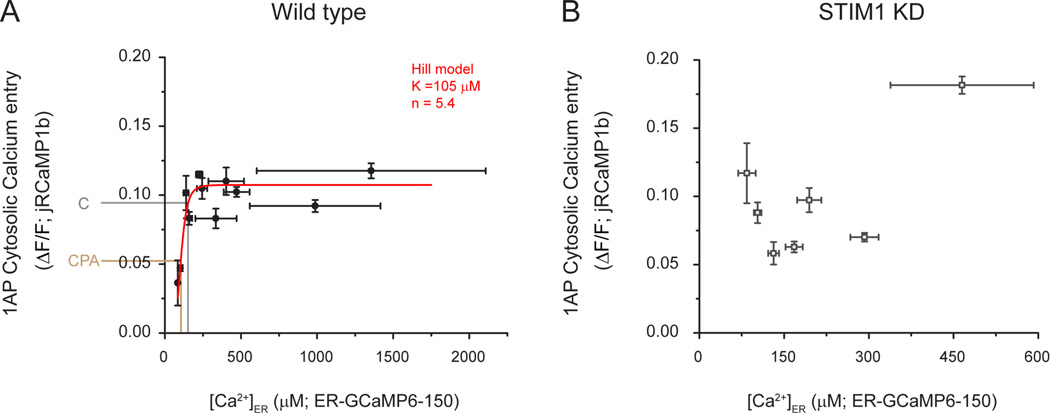
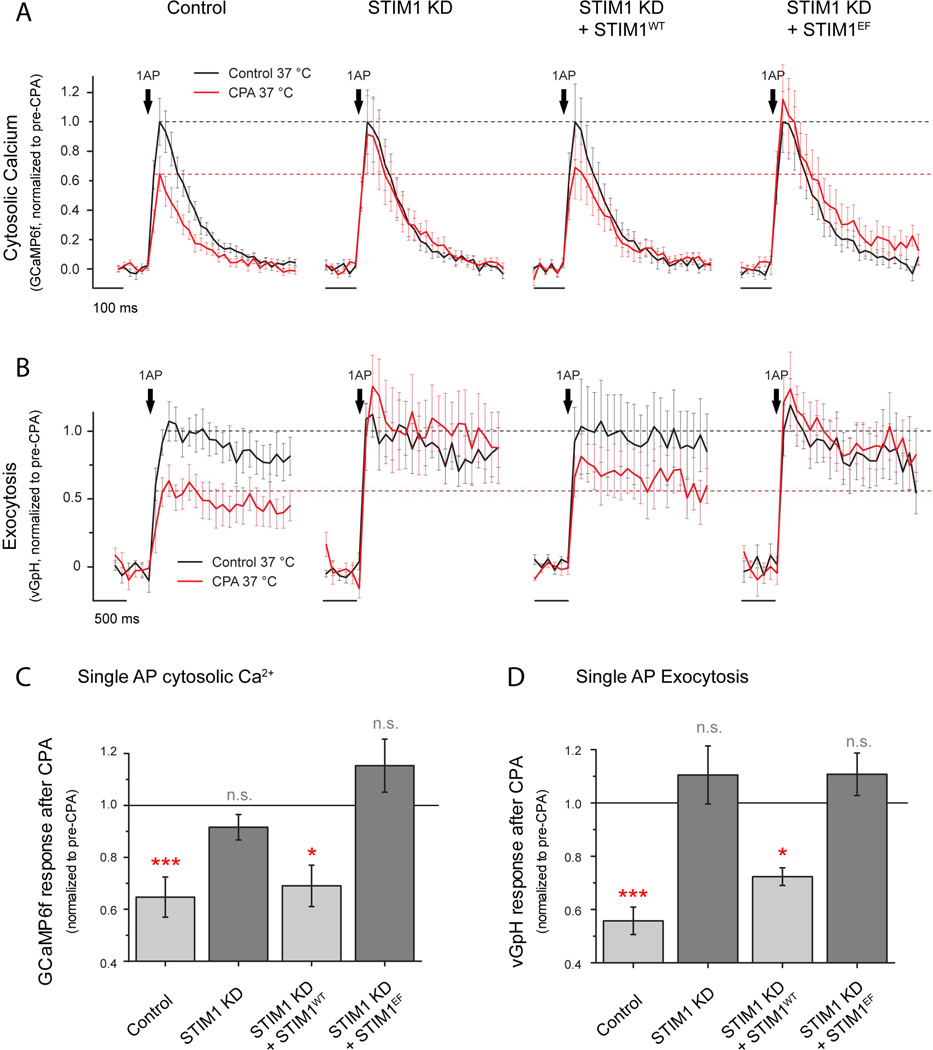
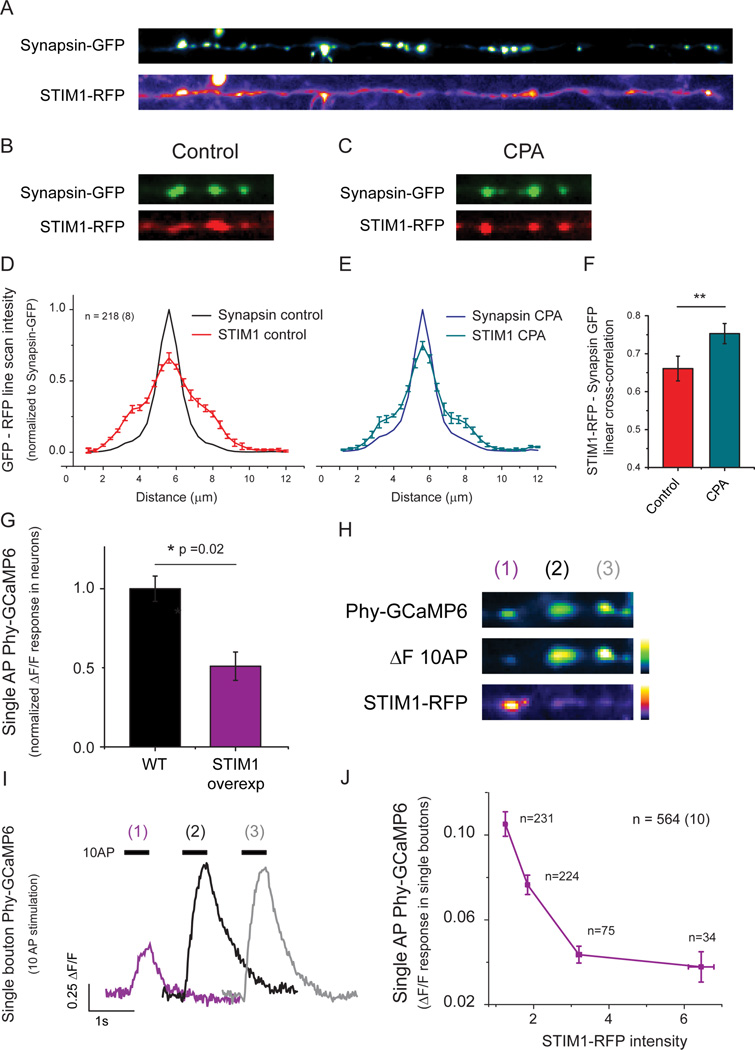
Although the endoplasmic reticulum (ER) extends throughout axons and axonal ER dysfunction is implicated in numerous neurological diseases, its role at nerve terminals is poorly understood. We developed novel genetically encoded ER-targeted low-affinity Ca2+ indicators optimized for examining axonal ER Ca2+. Our experiments revealed that presynaptic function is tightly controlled by ER Ca2+ content. We found that neuronal activity drives net Ca2+ uptake into presynaptic ER although this activity does not contribute significantly to shaping cytosolic Ca2+ except during prolonged repetitive firing. In contrast, we found that axonal ER acts as an actuator of plasma membrane (PM) function: [Ca2+]ER controls STIM1 activation in presynaptic terminals, which results in the local modulation of presynaptic function, impacting activity-driven Ca2+ entry and release probability. These experiments reveal a critical role of presynaptic ER in the control of neurotransmitter release and will help frame future investigations into the molecular basis of ER-driven neuronal disease states.

Keywords: Ca(2+) imaging; ER-GCaMP; GCaMP6; STIM1; low affinity Ca(2+) indicator; presynaptic endoplasmic reticulum.


Figures

Figure 1
Figure 1. ER Ca2+ handling is critical for presynaptic function at physiological temperature
(A-D) Representative traces of single AP presynaptic cytosolic Ca2+ responses measured using Fluo-5F AM (A, C) and vesicular exocytosis measured using vG-pH (B, D) before and after CPA treatment. Experiments were performed at 37°C (A, B, shown in red) and 26°C (C, D, shown in blue). Fluo-5F AM traces were normalized to the pre-CPA ΔF response (black trace). vG-pH responses are shown as percentage of their maximum fluorescence, obtained by brief perfusion of NH4Cl buffered at pH 7.4. Differential effects observed are summarized by showing the remaining response after CPA treatment in each of the conditions (E, F): Fluo-5F AM, (26°C) n =10, (37°C) n =14; ***p=1.44·10−7. vG-pH, (26°C) n =7, (37°C) n =10; ***p=2.75·10−4.
Figure 2
Figure 2. A new generation of ultrasensitive ER Ca2+ indicators
(A) Predicted relative fluorescence vs Ca2+ curves based on binding parameters obtained in vitro (Table S1) of low affinity calcium indicators GCaMP3-44, GCaMP6-150, GCaMP6-210 and GCaMP3-373 (light to dark green, high to low affinity) and high affinity cytosolic indicators GCaMP3 (grey) and GCaMP6f (black). Approximate ranges of Ca2+ concentration in the cytosol and ER are indicated by grey gradient boxes. (B) top: targeting scheme for expression in the neuronal ER by adding the N-terminal signal peptide of calreticulin (CALR sig peptide) and the C-terminal KDEL retention motif. Bottom: high resolution image of somatic ER-GCaMP6-150 shows neuronal ER structure. Scale bar 2 µM. (C) Montage of several fields from a neuron expressing ER-GCaMP6-150, which localizes in the ER network in the soma, dendrites and axons. Scale bar 40 µM. (D-F) Neurons were treated with 500 µM ionomycin to induce indicator saturation for calibration. (D) Example pseudocolor images of somatic ER-GCaMP6-150 before and after ionomycin treatment. Pseudocolor scale shows low to high intensity. Scale bar 8 µM. (E) Average peak fold-change in fluorescence (Fionomycin/F0) during ionomycin application for each ER-GCaMP. ER-GCaMP3-44, n=14; ER-GCaMP6-150, n=8; ER-GCaMP6-210, n=9; ER-GCaMP3-373, n=8; errors are ± S.E.M. (F) pH-corrected estimate of resting ER calcium concentration based on each indicator saturation response. Dashed line indicates the average of the estimates from each of the indicators.
Figure 3
Figure 3. Neuronal activity drives ER Ca2+ uptake
(A-C) Somatic ER Ca2+ responses to 20AP (20Hz) stimulation using different indicators. (A) Representative pseudocolor images of somatic ER-GCaMP6-150 before and after 20AP (20Hz) stimulation and (B) the corresponding fluorescence intensity over time (pseudocolor scale below showing low to high intensity). Scale bar 8 µM. (C) Average of 20AP peak somatic ER-GCaMP responses: G-CEPIA1er, n=5; ER-GCaMP3-44, n=11; ER-GCaMP6-150, n=12; ER-GCaMP6-210, n=6; ER-GCaMP3-373, n=11; errors are ± S.E.M. (D) Diagram showing axonal ER crossing nerve terminals where ER Ca2+ responses were measured. (E) ER-GCaMP-150 signals in presynaptic boutons identified by VAMP-mCherry expression (left, colored in green; scale bar 4 µM) at rest (middle image) and during a 20 AP stimulus (displayed as a kymograph, right; pseudocolor scale shows low to high intensity). Scale bar 3 s. (F) Representative 20AP presynaptic response measured with ER-GCaMP6-150 or cytosolic GCaMP6-150 (same variant without ER-targeting sequences).
Figure 4
Figure 4. SERCA function is necessary for activity-driven ER Ca2+ uptake
(A) Representative presynaptic responses of ER-GCaMP6-150 to 20AP (20Hz) or (B) ER-GCaMP6-210 to a single AP stimulus before and after 5 min of CPA (50 µM) application (black and red, respectively). Average of single AP Δ[Ca2+]ER responses before CPA was 5.9 ± 1.3 µM (n=5), which was reduced to 0.2 ± 0.2 µM after CPA treatment (n=3). (C) Box plots showing average and single-cell calibrated peak responses of neurons stimulated with 20AP (20Hz) before and after 5 min of treatment with CPA (n=10), thapsigargin (TG, 1 µM, n=9) or 1,4-dihydroxy-2,5-di-tert-butylbenzene (BHQ, 50 µM, n=9).
Figure 5
Figure 5. Presynaptic inhibition is slower than ER Ca2+ depletion following SERCA block
(A-C) Average axonal ER Ca2+ dynamics were measured using ER-GCaMP6-150 at 26°C, (A, blue) or 37°C (B, red). Grey traces are individual experiments, although some individual responses overshot the scale used here and their peaks were not included in the graph. Neurons were stimulated with 20 AP (20 Hz) and then treated with CPA to induce ER Ca2+ depletion. After 3 min of CPA treatment the responses to a second stimulus were abolished (indicated by second arrow, 20AP 20Hz). (C) Estimate of Δ[Ca2+]ER assuming an average resting [Ca2+]ER based on ionomycin responses; n(26°C)=8, n(37°C)=15; n.s. p=0.36. (D) Single-AP cytosolic Ca2+ responses (Fluo-5F AM, normalized to average pre-CPA ΔF response) every 60s measured before (black traces) and after CPA treatment at 26°C (D, G, blue traces) or 37°C (E, H, red traces). (G, H) Comparison of the kinetics of presynaptic inhibition and axonal ER Ca2+ depletion. Curves were fit to single exponential decays where possible and time constants (τ) were obtained for comparison. τER (26°C)= 47.5 ± 3.4 s, n=8; τER (37°C)= 26 ± 0.9 s, n=15; τcyto Ca 2+ (37°C)= 148 ± 18 s, n=7.
Figure 6
Figure 6. Presynaptic Ca2+ influx is correlated with ER Ca2+ content in wild type but not in STIM1 KD neurons
(A-B) Neurons expressing ER-GCaMP6-150 and cytosolic jRCaMP1b were co-transfected with or without an shRNA targeting STIM1 and were used to examine single AP-driven Ca2+ influx (jRCaMP1b) and axonal [Ca2+]ER (ER-GCaMP6-150) in the same cells. Recordings from wild type (n=15) and STIM1 KD (n=12) neurons were grouped using a binning size of [Ca2+]ER=25µM to better estimate fitting parameters (see methods; see Fig. S6 for unbinned data). These two variables are correlated only in wild type cells (A) and are well described by a generalized Hill equation (red line) with a K1/2 of 105 µM ± 5 µM and a Hill coefficient of 5.4 ± 2.7(Adjusted R-square = 0.87). Fitting in the case of STIM1 KD was not possible (B, see methods). Grey and brown lines show the predicted impact of CPA on Ca2+ influx when the average value of [Ca2+]ER (152 µM) decreases by 48 µM, as measured during SERCA block.
Figure 7
Figure 7. STIM1 regulates presynaptic function impairment induced by ER Ca2+ depletion
(A-D) Single AP-driven cytosolic Ca2+ signals and exocytosis were measured using GCaMP6f or vG-pH, respectively. Single-AP stimulated signals were quantified in wild type neurons, STIM1 KD neurons, STIM1 KD neurons expressing an shRNA-resistant version of STIM1 (STIM1WT) or STIM1 KD neurons expressing an shRNA-resistant version of STIM1 that is insensitive to ER Ca2+ content due to EF-hand mutations (STIM1EF). Responses were quantified before (black) and after (red) CPA treatment. Black dashed lines represent average response before treatment whereas red dashed lines represent the effect quantified in wild type neurons for ease of comparison in the different conditions. (C-D) Differential effects of CPA are summarized by showing the remaining response after CPA treatment in each of the conditions. Solid black line indicates response before CPA treatment, normalized to 1 in each case. (C) Effects of CPA in single-AP-driven presynaptic Ca2+ signals, Control n=16, ***p=0.0016; STIM1 KD n=14, n.s. p=0.60; STIM1 KD + STIM1WT n=10, *p=0.02; STIM1 KD + STIM1EF n=10, n.s. p=0.14. (D) Effects of CPA in single-AP vG-pH peak responses, Control n=10, ***p=6.68·10−5; STIM1 KD n=7, n.s. p=0.22; STIM1 KD + STIM1WT n=7, *p=0.031; STIM1 KD + STIM1EF n=7, n.s. p=0.55. Statistics were analyzed using paired sample Student’s t-test.
Figure 8
Figure 8. Local STIM1 enrichment at nerve terminals inhibits Ca2+ influx
(A) Representative image of an individual axon expressing STIM1-RFP and the presynaptic marker synapsin-GFP (straightened for ease of visualization). (B-E) Synapsin-GFP and STIM1-RFP were imaged before (B) and after CPA treatment (C). (D-F) Intensity profiles of both proteins were analyzed in 218 individual boutons from 8 neurons and compared before and after 15 min of CPA treatment to obtain 1 dimensional intensity cross-correlation profiles, showing that the presynaptic enrichment of STIM1-RFP increases following CPA treatment (F; control=0.66 ± 0.03, CPA=0.75 ± 0.02; ** p=0.0012) with negligible impact on the distribution of synapsin-GFP (control, black profile in D; CPA, blue profile in E). (G) Average decrease in single AP-Ca2+ influx following overexpression of STIM1-RFP. (H) Representative image of a neuron co-transfected with Phy-GCaMP6 (top, left) and STIM1-RFP (bottom left) showing the response to a 10 AP stimulus (middle left). Note that nerve terminals with greater STIM1-RFP abundance (1) have lower Ca2+ influx than neighboring synapses (2,3) with lower STIM1-RFP abundance (right) (I) Quantification of 10AP-driven phy-GCaMP6 signals shown in H. (J) Quantification of single AP-driven phy-GCaMP6 signals and their corresponding STIM1-RFP intensities acquired from 564 individual boutons from 10 neurons co-transfected as in H. STIM1-RFP intensities are shown as fluorescence normalized to the auto-fluorescence. Phy-GCaMP6 responses were binned into 4 different STIM1-RFP intensity groups (1–1.5, 1.5–2.5, 2.5–4.5 and >4.5) and reveal a strong inverse correlation between STIM1-RFP abundance and Ca2+ influx.

References

    1. Alonso MT, Barrero MJ, Carnicero E, Montero M, Garcia-Sancho J, Alvarez J. Functional measurements of [Ca2+] in the endoplasmic reticulum using a herpes virus to deliver targeted aequorin. Cell Calcium. 1998;24:87–96. - PubMed
    1. Ariel P, Hoppa MB, Ryan TA. Intrinsic variability in Pv, RRP size, Ca(2+) channel repertoire, and presynaptic potentiation in individual synaptic boutons. Front Synaptic Neurosci. 2012;4:9. - PMC - PubMed
    1. Armbruster M, Ryan TA. Synaptic vesicle retrieval time is a cell-wide rather than individual-synapse property. Nat Neurosci. 2011;14:824–826. - PMC - PubMed
    1. Beck A, Lohr C, Deitmer JW. Calcium transients in subcompartments of the leech Retzius neuron as induced by single action potentials. J Neurobiol. 2001;48:1–18. - PubMed
    1. Berna-Erro A, Braun A, Kraft R, Kleinschnitz C, Schuhmann MK, Stegner D, Wultsch T, Eilers J, Meuth SG, Stoll G, et al. STIM2 regulates capacitive Ca2+ entry in neurons and plays a key role in hypoxic neuronal cell death. Sci Signal. 2009;2:ra67. - PubMed

MeSH terms