. 2017 Mar 7;25(3):661-672.
doi: 10.1016/j.cmet.2017.01.001. Epub 2017 Feb 2.

Parathyroid Hormone Directs Bone Marrow Mesenchymal Cell Fate

Affiliations

Parathyroid Hormone Directs Bone Marrow Mesenchymal Cell Fate

Yi Fan et al. Cell Metab. .

Abstract

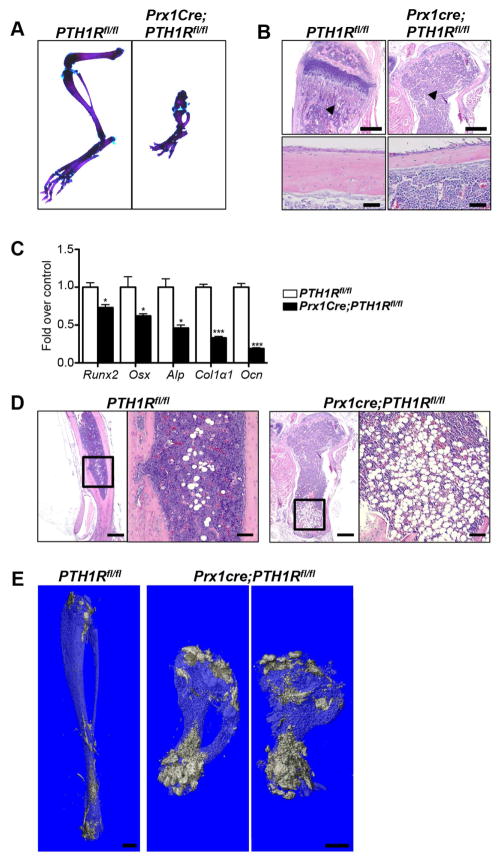
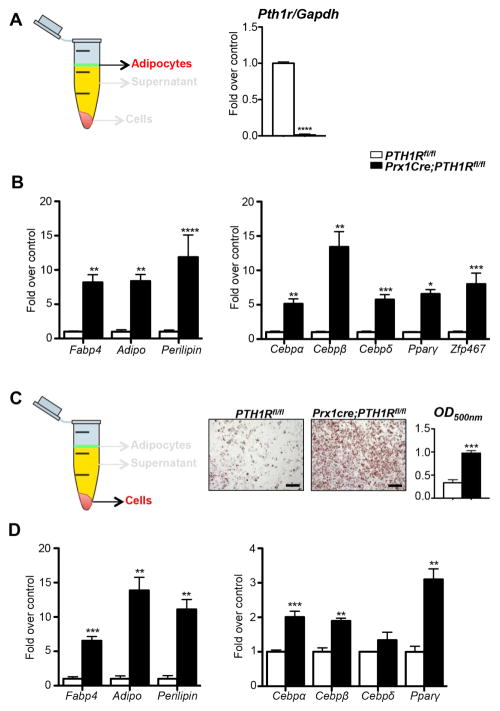
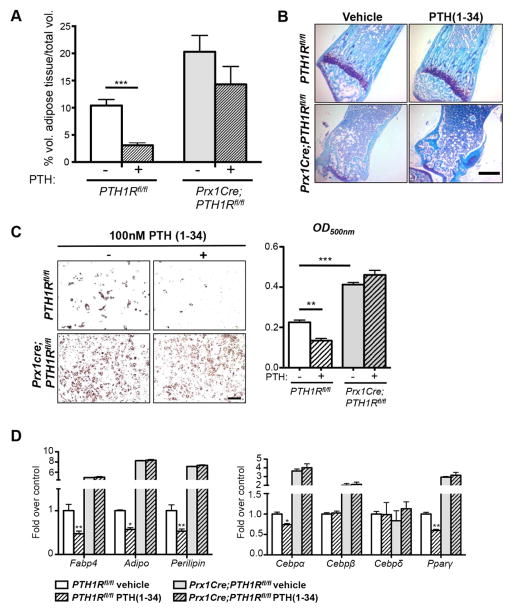
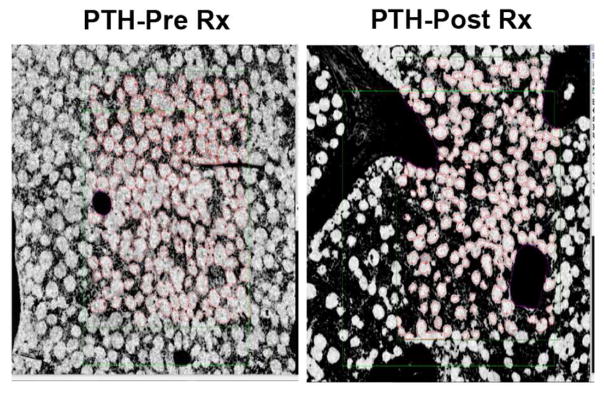
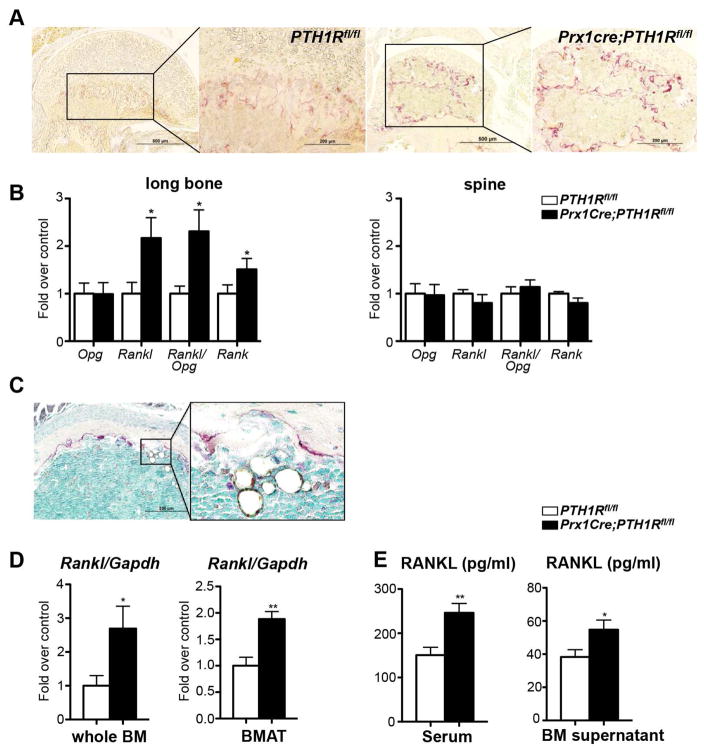
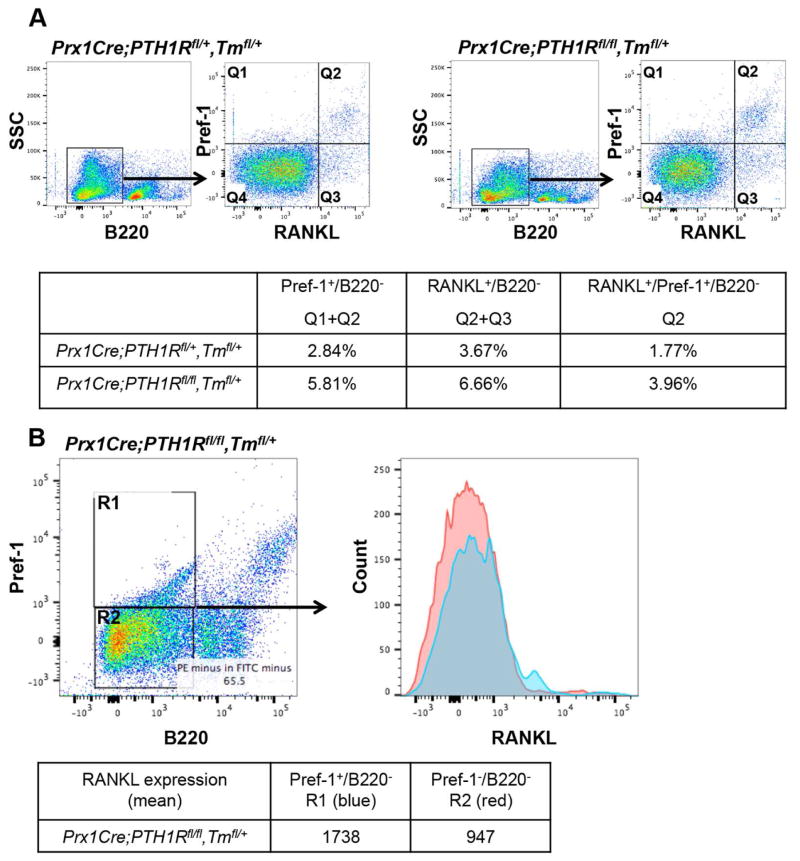
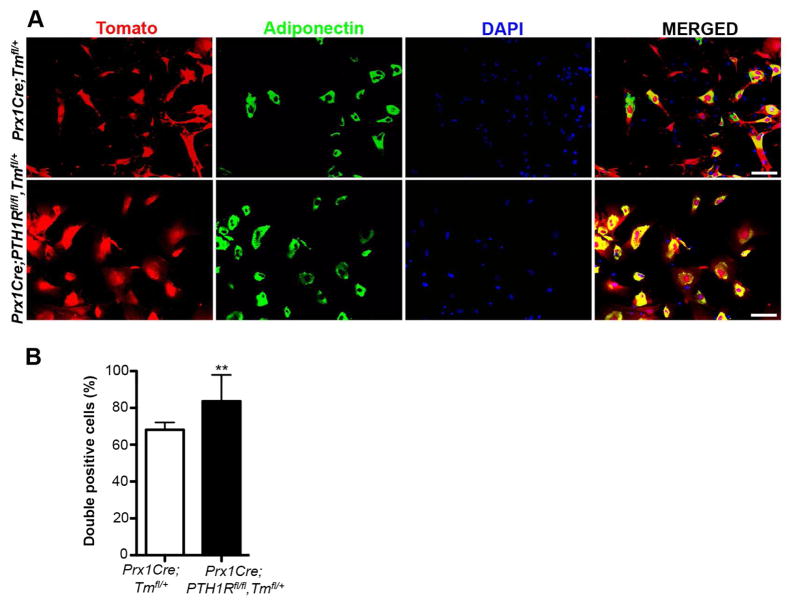
Intermittent PTH administration builds bone mass and prevents fractures, but its mechanism of action is unclear. We genetically deleted the PTH/PTHrP receptor (PTH1R) in mesenchymal stem cells using Prx1Cre and found low bone formation, increased bone resorption, and high bone marrow adipose tissue (BMAT). Bone marrow adipocytes traced to Prx1 and expressed classic adipogenic markers and high receptor activator of nuclear factor kappa B ligand (Rankl) expression. RANKL levels were also elevated in bone marrow supernatant and serum, but undetectable in other adipose depots. By cell sorting, Pref1+RANKL+ marrow progenitors were twice as great in mutant versus control marrow. Intermittent PTH administration to control mice reduced BMAT significantly. A similar finding was noted in male osteoporotic patients. Thus, marrow adipocytes exhibit osteogenic and adipogenic characteristics, are uniquely responsive to PTH, and secrete RANKL. These studies reveal an important mechanism for PTH's therapeutic action through its ability to direct mesenchymal cell fate.

Keywords: PTH; RANKL; bone resorption; lineage; receptor.


Figures

Figure 1
Figure 1. Skeletal and marrow phenotype of Prx1Cre;PTH1Rfl/fl
(A) Alizarin red/alcian blue staining of hindlimb of 3-wk-old PTH1Rfl/fl and Prx1Cre;PTH1Rfl/fl. (B) HE stained paraffin sections of control and mutant tibia at 3 wks showed significant reduced trabecular (upper panel, scale bar: 500μm) and cortical bone (lower panel, scale bar: 50μm) in mutant tibia. n=6. Arrowheads indicate area of trabecular bone. (C) Gene expression pattern of osteoblast markers from cortical bone RNA of PTH1Rfl/fl and Prx1Cre;PTH1Rfl/fl at 3 wks. n=6, *p<0.05, ***p<0.001 versus control. Graph shows mean ± SEM. (D) HE staining showed bone marrow space in mutant distal tibia is filled with adipocytes compared to controls. n=6. Scale bar: 500μm. Boxed areas show high-magnification, scale bar: 200μm. (E) OsO4 μCT image depicting the increase in bone marrow adiposity in Prx1Cre;PTH1Rfl/fl, particularly in the distal tibia, but also extending more proximal, when compared to PTH1Rfl/fl at 3 wks. n=6. Scale bar: 1mm. See also Figure S1.
Figure 2
Figure 2. Characterization of BMAT
(A, B) Schematic representation of bone marrow adipocytes isolated for qRT-PCR analyses. mRNA expression levels of Pth1r (A) and adipocyte specific genes (B) in isolated BMAT of PTH1Rfl/fl and Prx1Cre;PTH1Rfl/fl at 3 wks. n=4/control, 5/mutant. (C) Schematic representation of BMSCs cultured for qRT-PCR analyses. Oil red O staining and quantification of BMSCs of PTH1Rfl/fl and Prx1Cre;PTH1Rfl/fl mice cultured under adipogenic conditions. Scale bar: 200μm. (D) qRT-PCR analyses of BMSCs under adipogenic condition for adipocyte markers. n=6–9. *p<0.05, **p<0.01, ***p<0.001,****p<0.0001 versus control. All graphs show mean ± SEM. White bar represent PTH1Rfl/fl and black bar represent Prx1Cre;PTH1Rfl/fl in all panels. See also Figure S2.
Figure 3
Figure 3. Control of BMAT formation by PTH in vivo and in vitro.
(A) OsO4 μCT analyses of 3-wk- old tibiae of PTH1Rfl/fl and Prx1Cre;PTH1Rfl/fl under vehicle or PTH(1-34) administration. Control mice showed marked reduction in volume of adipose tissue/total volume, whereas Prx1Cre;PTH1Rfl/fl mice exhibited higher basal BMAT levels, which were not significantly affected by PTH administration. ***p<0.001 versus PTH1Rfl/fl under vehicle treatment. Two-way ANOVA and Bonferroni posttests were used to evaluate individual samples responses related to PTH(1-34) treatment. Genotype effect: ##p=0.0014, PTH(1-34) effect: $p=0.0264. (B) Toluidine blue stained paraffin sections of tibiae of PTH1Rfl/fl and Prx1Cre;PTH1Rfl/fl under vehicle or PTH(1-34) administration n=6. Scale bar: 500μm. (C) Oil red O staining and quantification of PTH1Rfl/fl and Prx1Cre;PTH1Rfl/fl BMSC cultures under adipogenic condition, treated with vehicle or 100 nM PTH(1-34). PTH treatment reduced oil red O staining in PTH1Rfl/fl BMSCs. In contrast, Prx1Cre;PTH1Rfl/fl cells showed higher numbers of adipocytes at basal stage and did not respond to PTH(1-34). n=3. Scale bar: 200μm. (D) qRT-PCR analyses of adipocyte specific genes in BMSCs under adipogenic condition, with vehicle or PTH(1-34) treatment. PTH1Rfl/fl BMSCs showed significantly reduced adipogenic markers (Fabp4, Adiponectin, Perilipin, Cebpα and Pparγ) after PTH administration whereas Prx1Cre;PTH1Rfl/fl BMSCs did not respond to PTH(1-34). n=3. *p<0.05, **p<0.01, ***p<0.001 versus PTH1Rfl/fl under vehicle treatment. All graphs show mean ± SEM. See also Figure S3.
Figure 4
Figure 4. Control of BMAT by PTH(1-34) treatment in men
Representative paired iliac crest biopsy from a male subject treated with PTH(1-34), at baseline and after 18 months of treatment (Dempster et al., 2001). 3 sections were analyzed per region of tissue. The cells were counted and marrow adipocyte volume and marrow volume were measured.
Figure 5
Figure 5. Bone marrow adipocytes are the source of RANKL in the absence of PTH1R signaling
(A) Paraffin sections of Prx1Cre;PTH1Rfl/fl femurs show more TRAP positive cells than controls. n=3. Scale bar: 500μm in low magnification, 200μm in high magnification. (B) Expression of Opg, Rankl and Rank mRNA and Rankl/Opg ratio in long bones and spine of PTH1Rfl/fl and Prx1Cre;PTH1Rfl/fl mice at 3 wks. n=12. (C) Histological section of proximal tibia of a Prx1Cre; PTH1Rfl/fl mouse at 3 weeks. TRAP-positive osteoclasts lining the bone surface are found in close vicinity to the many large adipocytes located in the bone marrow space. Scale bar: 200μm. (D) qRT-PCR analysis for Rankl mRNA expression in flushed whole bone marrow (whole BM) and isolated bone marrow adipose tissue (BMAT). n=6/control, 7/mutant. (E) Serum and BM supernatant RANKL protein levels were significantly elevated in Prx1Cre;PTH1Rfl/fl when compared to PTH1Rfl/fl. n=17/control, 16/mutant. *p<0.05, **p<0.01 versus control. All graphs show mean ± SEM. See also Figure S4 and S5.
Figure 6
Figure 6. Loss of PTH1R in MSCs increases the number of RANKL expressing pre-adipocytes
Bone marrow cells of 3-wk-old controls (Prx1Cre;PTH1Rfl/+,Tmfl/+, PTH1Rfl/fl) and mutants (Prx1Cre;PTH1Rfl/fl,Tmfl/+, Prx1Cre;PTH1Rfl/fl) were stained with FITC-anti-B220 antibody, PE-anti-Pref-1 and APC/Cy7-anti-RANKL antibody and analyzed by flow cytometry. (A) Cells were gated on B220 cells and characterized with Pref-1 and RANKL (separated into Q1–Q4). Q1+Q2 represent Pref1+B220 population, Q2+Q3 represent RANKL+B220 population and Q2 represents Pref-1+RANKL+B220 population. Table shows the percentage of each population. (B) Mutant cells were gated on B220 and Pref-1 and separated into R1 and R2, and each fraction was analyzed with RANKL expression. R1 represents Pref-1+RANKL+B220 and R2 represents Pref-1-RANKL+B220 population. Table shows mean fluorescence intensity of RANKL expression. Results shown are representative of three independent experiments displaying similar results.
Figure 7
Figure 7. Cells ablated for PTH1R preferentially developed into adipocytes in vitro
(A) Immunofluorescence staining of BMSCs cultured under adipogenic conditions derived from 3wk old Prx1Cre;Tmfl/+ and Prx1Cre;PTH1Rfl/fl,Tmfl/+ mice. Red: Prx1-Tomato positive cells, green: adipocytes expressing adiponectin, blue: DAPI stain for cell nuclei and yellow: double positive (red/green) cells rendering BMSCs undergoing adipogenic differentiation. Scale bar: 100μm. (B) The percentage of double positive cells in Prx1Cre;PTH1Rfl/fl,Tmfl/+ mice was significantly higher than in controls. n=3. **p<0.01 versus control. All graphs show mean ± SEM.

Comment in

References

    1. Amizuka N, Karaplis AC, Henderson JE, Warshawsky H, Lipman ML, Matsuki Y, Ejiri S, Tanaka M, Izumi N, Ozawa H, et al. Haploinsufficiency of parathyroid hormone-related peptide (PTHrP) results in abnormal postnatal bone development. Dev Biol. 1996;175:166–176. - PubMed
    1. Bredella MA, Fazeli PK, Miller KK, Misra M, Torriani M, Thomas BJ, Ghomi RH, Rosen CJ, Klibanski A. Increased bone marrow fat in anorexia nervosa. J Clin Endocr Metab. 2009;94:2129–2136. - PMC - PubMed
    1. Cain CJ, Valencia JT, Ho S, Jordan K, Mattingly A, Morales BM, Hsiao EC. Increased Gs Signaling in Osteoblasts Reduces Bone Marrow and Whole-Body Adiposity in Male Mice. Endocrinology. 2016;157:1481–1494. - PMC - PubMed
    1. Calvi LM, Sims NA, Hunzelman JL, Knight MC, Giovannetti A, Saxton JM, Kronenberg HM, Baron R, Schipani E. Activated parathyroid hormone/parathyroid hormone-related protein receptor in osteoblastic cells differentially affects cortical and trabecular bone. J Clin Invest. 2001;107:277–286. - PMC - PubMed
    1. Cawthorn WP, Scheller EL, Learman BS, Parlee SD, Simon BR, Mori H, Ning X, Bree AJ, Schell B, Broome DT, et al. Bone marrow adipose tissue is an endocrine organ that contributes to increased circulating adiponectin during caloric restriction. Cell Metab. 2014;20:368–375. - PMC - PubMed

MeSH terms