

Comprehensive Molecular Characterization of Pheochromocytoma and Paraganglioma
- PMID: 28162975
- PMCID: PMC5643159
- DOI: 10.1016/j.ccell.2017.01.001
Comprehensive Molecular Characterization of Pheochromocytoma and Paraganglioma
Abstract
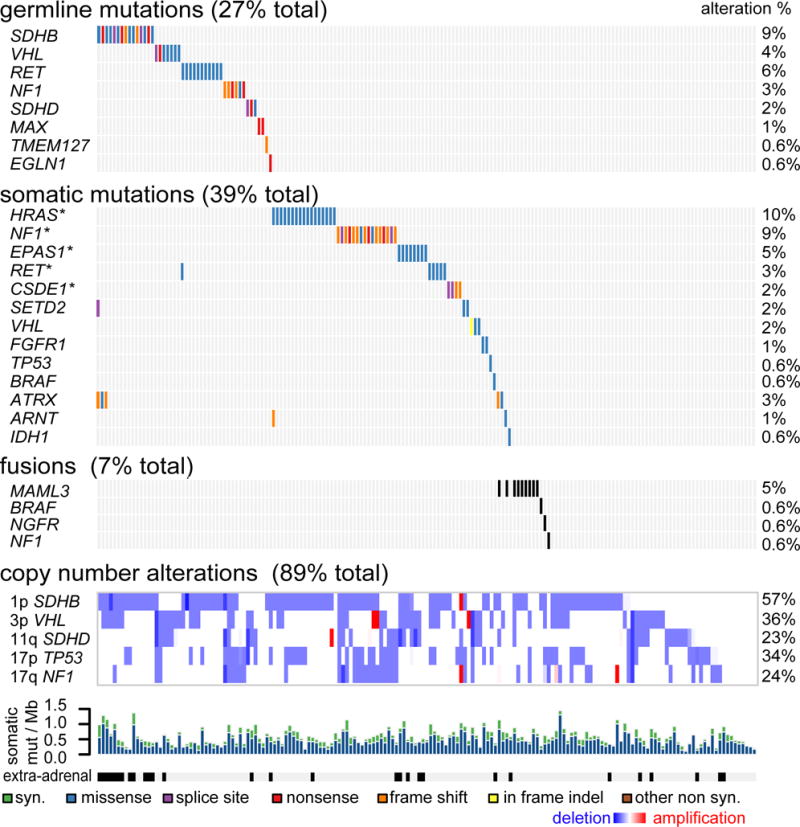
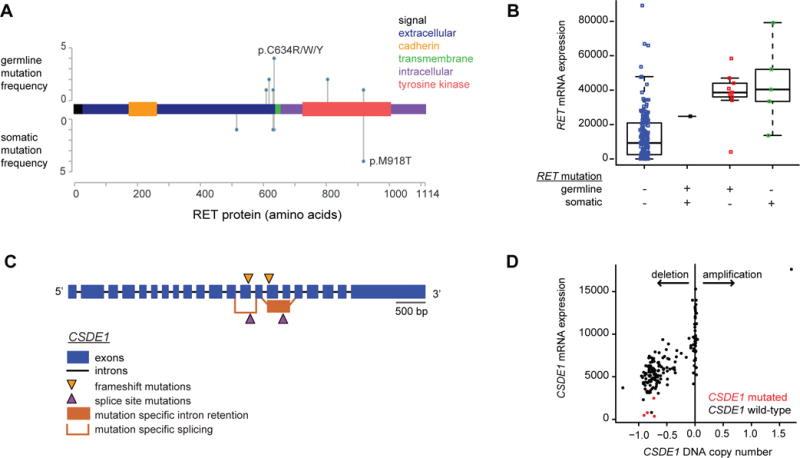
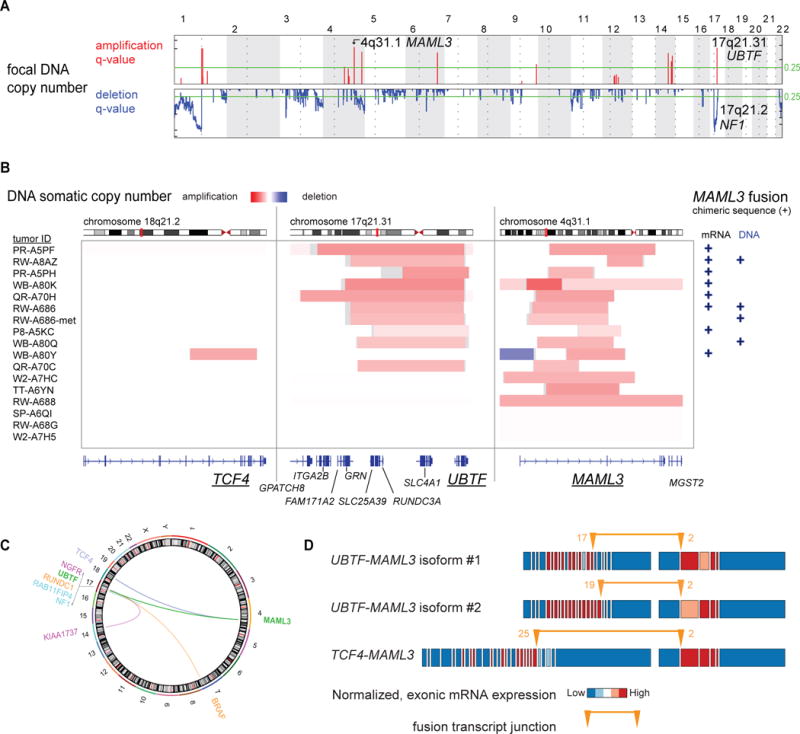
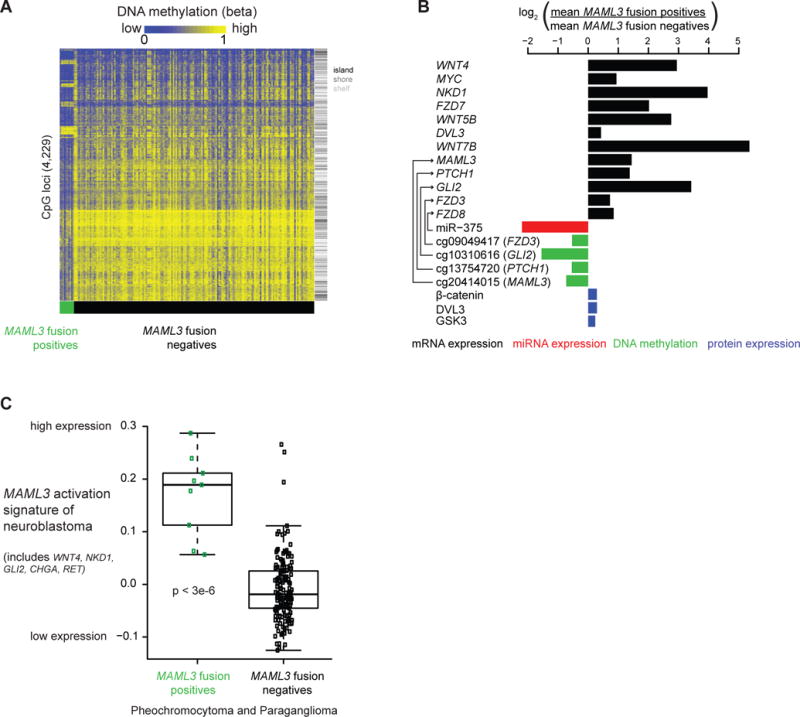
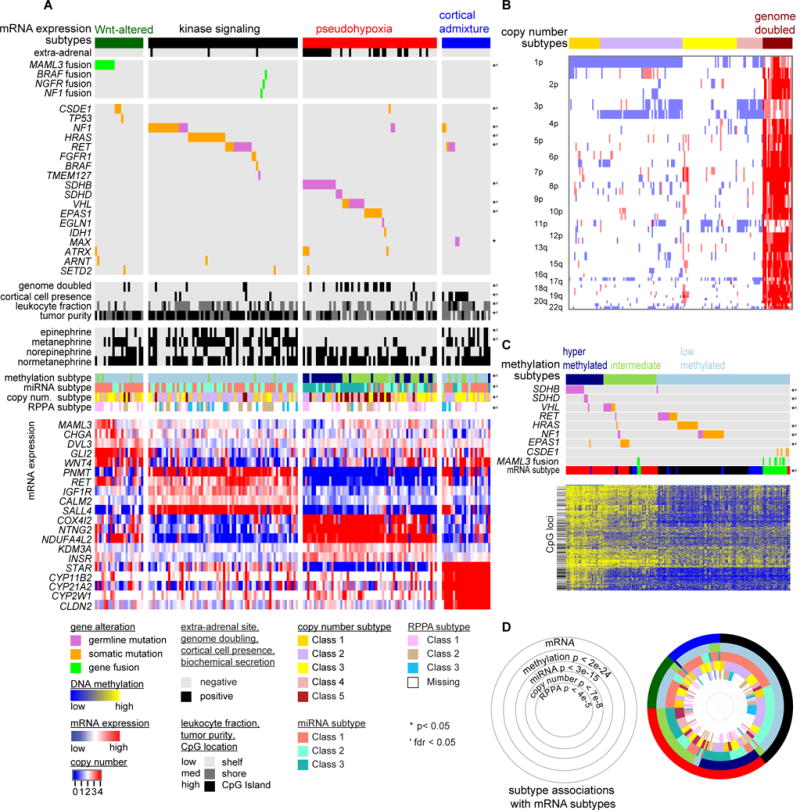
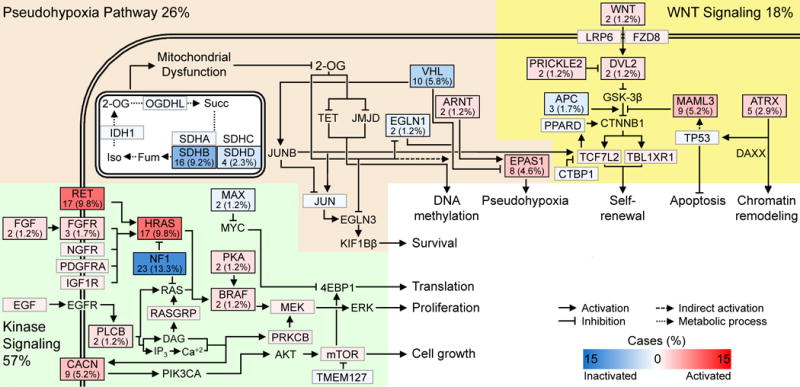
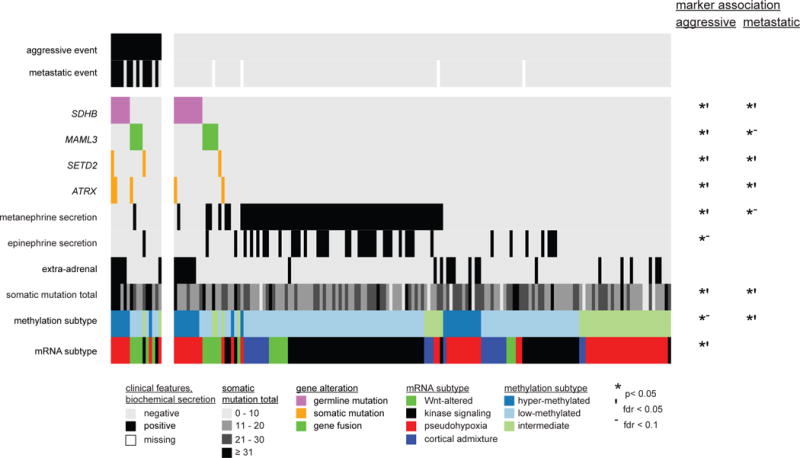
We report a comprehensive molecular characterization of pheochromocytomas and paragangliomas (PCCs/PGLs), a rare tumor type. Multi-platform integration revealed that PCCs/PGLs are driven by diverse alterations affecting multiple genes and pathways. Pathogenic germline mutations occurred in eight PCC/PGL susceptibility genes. We identified CSDE1 as a somatically mutated driver gene, complementing four known drivers (HRAS, RET, EPAS1, and NF1). We also discovered fusion genes in PCCs/PGLs, involving MAML3, BRAF, NGFR, and NF1. Integrated analysis classified PCCs/PGLs into four molecularly defined groups: a kinase signaling subtype, a pseudohypoxia subtype, a Wnt-altered subtype, driven by MAML3 and CSDE1, and a cortical admixture subtype. Correlates of metastatic PCCs/PGLs included the MAML3 fusion gene. This integrated molecular characterization provides a comprehensive foundation for developing PCC/PGL precision medicine.
Keywords: CSDE1; MAML3; TCGA; expression subtypes; genomics; metastasis; molecular profiling; paraganglioma; pheochromocytoma; sequencing.
Copyright © 2017 Elsevier Inc. All rights reserved.
Figures
References
-
- Alves-Guerra MC, Ronchini C, Capobianco AJ. Mastermind-like 1 Is a specific coactivator of beta-catenin transcription activation and is essential for colon carcinoma cell survival. Cancer Res. 2007;67:8690–8698. - PubMed
-
- Amar L, Bertherat J, Baudin E, Ajzenberg C, Bressac-de Paillerets B, Chabre O, Chamontin B, Delemer B, Giraud S, Murat A, et al. Genetic testing in pheochromocytoma or functional paraganglioma. J Clin Oncol. 2005;23:8812–8818. - PubMed
-
- Amelio AL, Fallahi M, Schaub FX, Zhang M, Lawani MB, Alperstein AS, Southern MR, Young BM, Wu L, Zajac-Kaye M, et al. CRTC1/MAML2 gain-of-function interactions with MYC create a gene signature predictive of cancers with CREB-MYC involvement. Proc Natl Acad Sci U S A. 2014;111:E3260–3268. - PMC - PubMed
-
- Ayala-Ramirez M, Feng L, Johnson MM, Ejaz S, Habra MA, Rich T, Busaidy N, Cote GJ, Perrier N, Phan A, et al. Clinical risk factors for malignancy and overall survival in patients with pheochromocytomas and sympathetic paragangliomas: primary tumor size and primary tumor location as prognostic indicators. J Clin Endocrinol Metab. 2011;96:717–725. - PubMed
-
- Beard CM, Sheps SG, Kurland LT, Carney JA, Lie JT. Occurrence of pheochromocytoma in Rochester, Minnesota, 1950 through 1979. Mayo Clin Proc. 1983;58:802–804. - PubMed
MeSH terms
Substances
Grants and funding
- P30 CA016672/CA/NCI NIH HHS/United States
- U24 CA143882/CA/NCI NIH HHS/United States
- U54 HG003067/HG/NHGRI NIH HHS/United States
- T32 CA009582/CA/NCI NIH HHS/United States
- U24 CA143835/CA/NCI NIH HHS/United States
- U24 CA143866/CA/NCI NIH HHS/United States
- U24 CA210950/CA/NCI NIH HHS/United States
- U24 CA143845/CA/NCI NIH HHS/United States
- U24 CA143799/CA/NCI NIH HHS/United States
- U54 HG003273/HG/NHGRI NIH HHS/United States
- U24 CA144025/CA/NCI NIH HHS/United States
- U24 CA180951/CA/NCI NIH HHS/United States
- U24 CA143840/CA/NCI NIH HHS/United States
- U24 CA143843/CA/NCI NIH HHS/United States
- U24 CA210974/CA/NCI NIH HHS/United States
- U24 CA143858/CA/NCI NIH HHS/United States
- U24 CA143848/CA/NCI NIH HHS/United States
- U54 HG003079/HG/NHGRI NIH HHS/United States
- U24 CA210949/CA/NCI NIH HHS/United States
- U24 CA143883/CA/NCI NIH HHS/United States
- R00 CA157954/CA/NCI NIH HHS/United States
- U24 CA143867/CA/NCI NIH HHS/United States
- U24 CA199461/CA/NCI NIH HHS/United States
LinkOut - more resources
Full Text Sources
Other Literature Sources
Medical
Research Materials
Miscellaneous
