. 2017 Feb 14;8(2):216-225.
doi: 10.1016/j.stemcr.2016.12.024. Epub 2017 Feb 2.

Thyroid Progenitors Are Robustly Derived from Embryonic Stem Cells through Transient, Developmental Stage-Specific Overexpression of Nkx2-1

Affiliations

Thyroid Progenitors Are Robustly Derived from Embryonic Stem Cells through Transient, Developmental Stage-Specific Overexpression of Nkx2-1

Keri Dame et al. Stem Cell Reports. .

Abstract

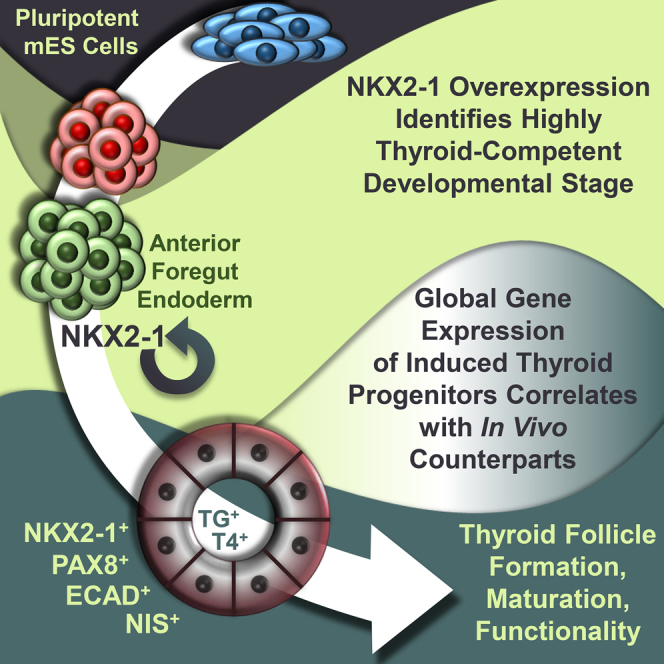
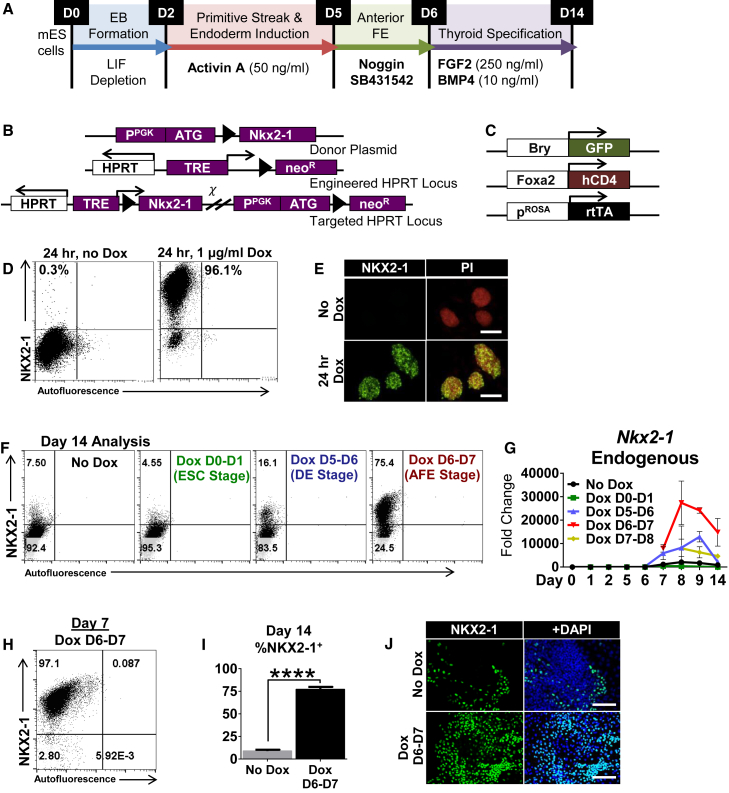
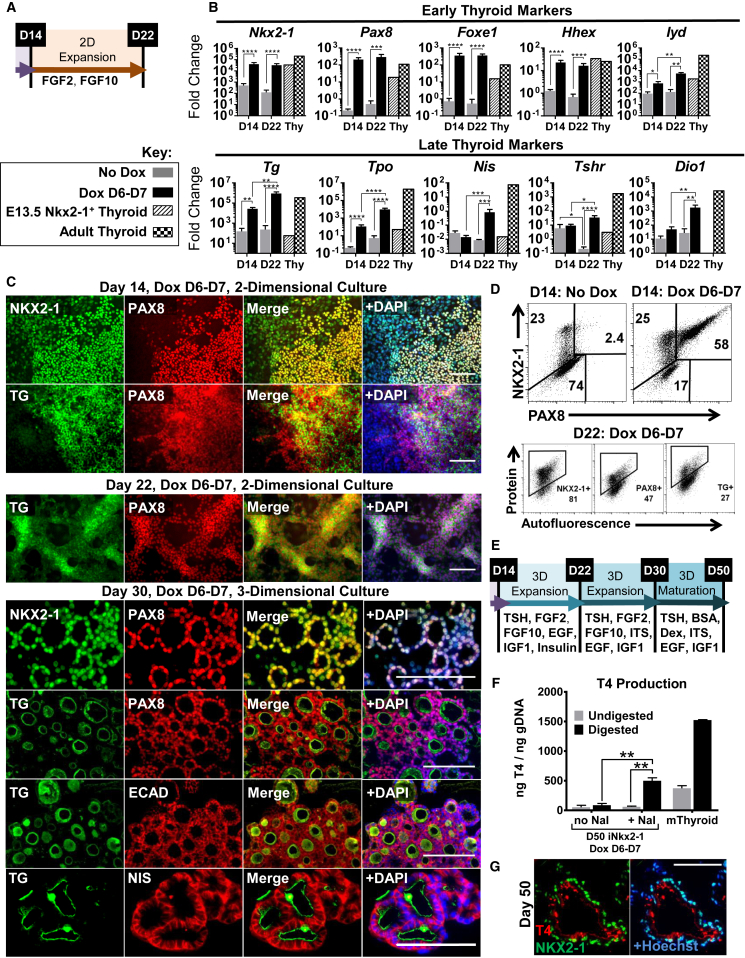
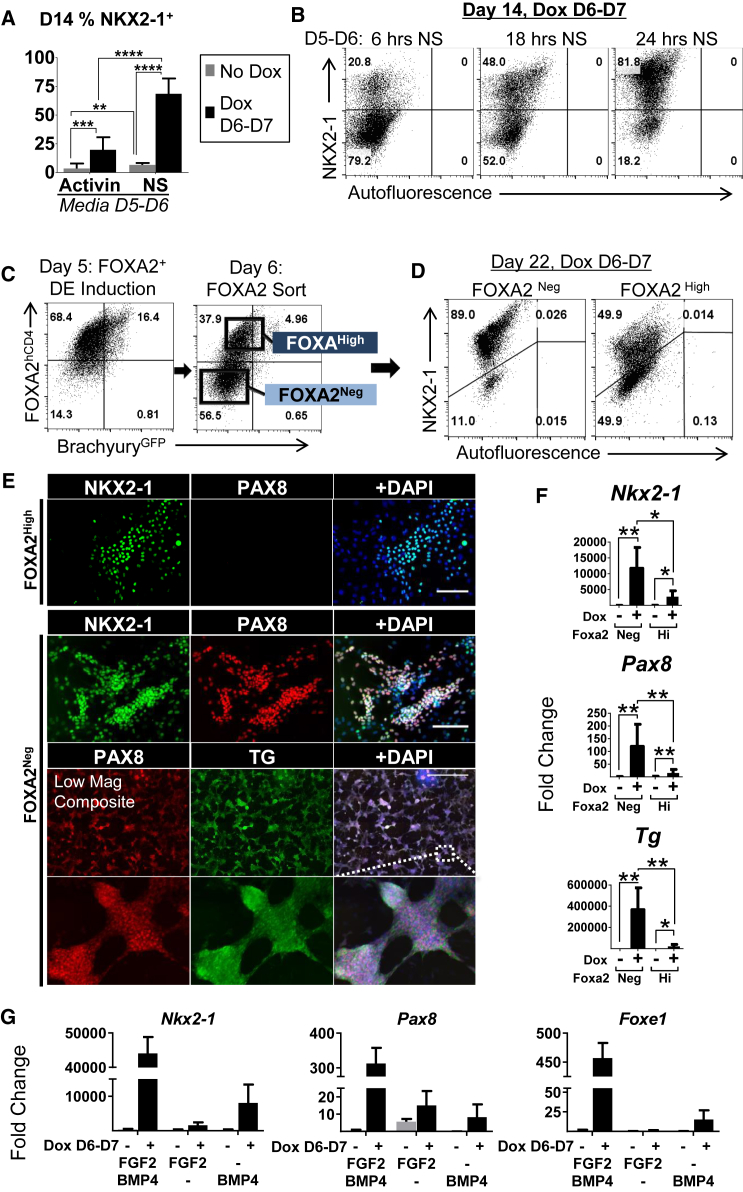
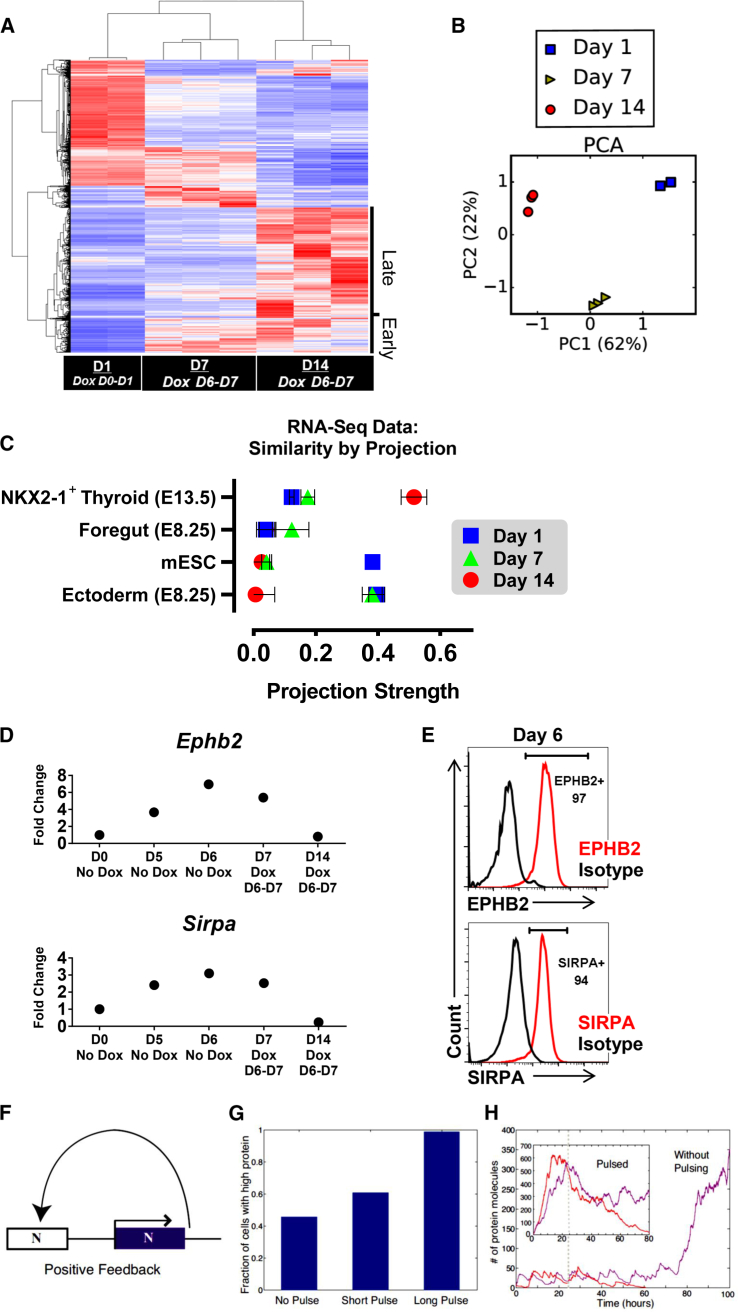
The clinical importance of anterior foregut endoderm (AFE) derivatives, such as thyrocytes, has led to intense research efforts for their derivation through directed differentiation of pluripotent stem cells (PSCs). Here, we identify transient overexpression of the transcription factor (TF) NKX2-1 as a powerful inductive signal for the robust derivation of thyrocyte-like cells from mouse PSC-derived AFE. This effect is highly developmental stage specific and dependent on FOXA2 expression levels and precise modulation of BMP and FGF signaling. The majority of the resulting cells express thyroid TFs (Nkx2-1, Pax8, Foxe1, Hhex) and thyroid hormone synthesis-related genes (Tg, Tpo, Nis, Iyd) at levels similar to adult mouse thyroid and give rise to functional follicle-like epithelial structures in Matrigel culture. Our findings demonstrate that NKX2-1 overexpression converts AFE to thyroid epithelium in a developmental time-sensitive manner and suggest a general methodology for manipulation of cell-fate decisions of developmental intermediates.

Keywords: Nkx2-1; directed differentiation; foregut; inducible; mouse embryonic stem cell; overexpression; pluripotent stem cell; progenitor specification; thyroid development; transcription factor.


Figures

None
Graphical abstract
Figure 1
Figure 1
Stage-Specific Effect of Nkx2-1 Overexpression on Derivation of NKX2-1+ Progenitors (A) Directed differentiation protocol for NKX2-1+ TPs. (B) Integration schematic of the Nkx2-1 transgene into the HPRT locus. (C) Schematic of the knockin reporters (BrachyuryGFP and Foxa2hCD4) and rtTA engineered into the iNkx2-1 line. (D) Intracellular flow cytometry for NKX2-1 in undifferentiated cells with and without 24 hr of Dox treatment. (E) Immunostaining of undifferentiated iNkx2-1 cells post-24-hr Dox; nuclear counterstain with propidium iodide (PI). Scale bars represent 100 μm. (F) Intracellular NKX2-1 flow cytometry plots from D14 following 24-hr pulses of Dox added at indicated intermediate stages. Representative of three differentiations. (G) Kinetics of endogenous Nkx2-1 expression by RT-qPCR following 24-hr staged pulses of Dox. Fold changes relative to undifferentiated cells, error bars represent SD (n = 3 wells from same differentiation). Representative of three independent experiments. (H) Representative flow cytometry plot of NKX2-1 expression directly post-24-hr Dox. (I) Averaged flow cytometry data (n = 12 independent experiments) comparing untreated (no Dox) and treated (Dox D6–D7) samples. Error bars represent SEM. ∗∗∗∗p < 0.0001. (J) Representative immunostaining of Dox-induced and uninduced cultures at D14. Scale bars represent 100 μm. See also Figure S1.
Figure 2
Figure 2
Nkx2-1 Overexpression at AFE Stage Results in Efficient Thyroid Differentiation (A) Experimental schematic of the extended culture conditions in (B), (C) (top three panels), and (D). (B) RT-qPCR for thyroid marker expression. Fold changes calculated relative to undifferentiated cells, error bars represent SEM (n = 5 independent experiments, n = 1 control). (C) Immunostaining of induced cultures at D14, D22 (gelatin substratum), and D30 (Matrigel embedded). Scale bars represent 100 μm. (D) Intracellular flow cytometry for populations at D14 (top), separate differentiation single stains at D22 (bottom). (E) Schematic of the maturation culture conditions for (F) and (G). (F) T4 ELISA from D50 (Dox D6–D7) cells ± 10 μM NaI from D40 to D50 (n = 3 wells from the same differentiation). Mouse thyroid tissue for reference (n = 2 tissue samples). (G) D50 immunostaining for +NaI cultures corresponding with (F). Scale bar represents 100 μm. p < 0.05, ∗∗p < 0.01, ∗∗∗p < 0.001, ∗∗∗∗p < 0.0001. See also Figure S2.
Figure 3
Figure 3
Efficient Thyroid Specification Is Dependent on Precise Modulation of BMP/FGF Signaling and Derivation of the Thyroid-Competent FOXA2Neg AFE Population (A) Intracellular D14 flow cytometry for NKX2-1 following D5–D6 NS or Activin treatment (n = 3 independent experiments). (B) Intracellular D14 flow cytometry plots from varying duration of the anteriorization stage followed by 24 hr of Dox treatment. (C) Flow cytometry sort schematic of D6 FOXA2+ AFE. (D) Intracellular D22 flow cytometry from the sorted and induced populations shown in (C). Representative of three independent experiments. (E) D22 immunostaining from FOXA2High and FOXA2Neg sorted populations. Top, scale bar represents 100 μm; bottom, scale bars represent 1,000 μm (composite image). (F) D22 RT-qPCR data from the sorted populations shown in (C), with and without Dox D6–D7. Fold changes relative to undifferentiated cells, statistics from paired t tests, (n = 5 independent experiments). (G) D14 RT-qPCR from induced and uninduced cells with specification factor variations. Fold changes relative to undifferentiated cells (n = 3 wells from same differentiation). Results are representative of three independent experiments. p < 0.05, ∗∗p < 0.01, ∗∗∗p < 0.001, ∗∗∗∗p < 0.0001. See also Figure S3.
Figure 4
Figure 4
RNA-Sequencing Data Reveal Thyroid Signature (A) RNA-seq heatmap of the top 9,088 differentially expressed genes with highest variance (false discovery rate <0.05) among samples, clustered by samples (columns) and genes (rows). Late and early clusters are indicated. (B) PCA plot of RNA-seq populations. (C) Projection graph representing the degree of similarity (x axis, exact match = 1) between RNA-seq samples (dots) and reference gene expression datasets (y axis). (D) RT-qPCR validation data of cell surface markers identified in the early cluster. (E) Flow cytometry data corresponding with (D). (F) Bistable model: a protein that cooperatively binds its own promoter leads to a positive feedback-based, bistable switch. (G) Percentage of high-protein-expressing cells in Monte-Carlo simulations of the bistable switch shown in (F) for three pulse lengths of protein expression. Results were calculated using 1,000 simulations in each condition. (H) Stochastic trajectories of protein number as a function of time in the absence of pulsing (main figure) and in the presence of a long pulse (inset). Colored lines show stochastic trajectories that successfully activate the Nkx2-1 feedback loop (purple lines) or fail to activate the feedback loop (red lines). The dashed line indicates the time the basal transcription rate was turned off in all simulations. See also Figure S4.

References

    1. Antonica F., Kasprzyk D.F., Opitz R., Iacovino M., Liao X.H., Dumitrescu A.M., Refetoff S., Peremans K., Manto M., Kyba M. Generation of functional thyroid from embryonic stem cells. Nature. 2012;491:66–71. - PMC - PubMed
    1. Boggaram V. Thyroid transcription factor-1 (TTF-1/Nkx2.1/TITF1) gene regulation in the lung. Clin. Sci. (Lond) 2009;116:27–35. - PubMed
    1. Bondue A., Lapouge G., Paulissen C., Semeraro C., Lacovino M., Kyba M., Blanpain C. Mesp1 acts as a master regulator of multipotent cardiovascular progenitor specification. Cell Stem Cell. 2008;3:69–84. - PubMed
    1. Dravis C., Henkemeyer M. Ephrin-B reverse signaling controls septation events at the embryonic midline through separate tyrosine phosphorylation-independent signaling avenues. Dev. Biol. 2011;355:138–151. - PMC - PubMed
    1. Fagman H., Amendola E., Parrillo L., Zoppoli P., Marotta P., Scarfò M., De Luca P., de Carvalho D.P., Ceccarelli M., De Felice M. Gene expression profiling at early organogenesis reveals both common and diverse mechanisms in foregut patterning. Dev. Biol. 2011;359:163–175. - PMC - PubMed

Publication types

MeSH terms

Substances