. 2017 Feb:16:262-274.
doi: 10.1016/j.ebiom.2017.01.030. Epub 2017 Jan 22.

Munc18b Increases Insulin Granule Fusion, Restoring Deficient Insulin Secretion in Type-2 Diabetes Human and Goto-Kakizaki Rat Islets with Improvement in Glucose Homeostasis

Affiliations

Munc18b Increases Insulin Granule Fusion, Restoring Deficient Insulin Secretion in Type-2 Diabetes Human and Goto-Kakizaki Rat Islets with Improvement in Glucose Homeostasis

Tairan Qin et al. EBioMedicine. 2017 Feb.

Abstract

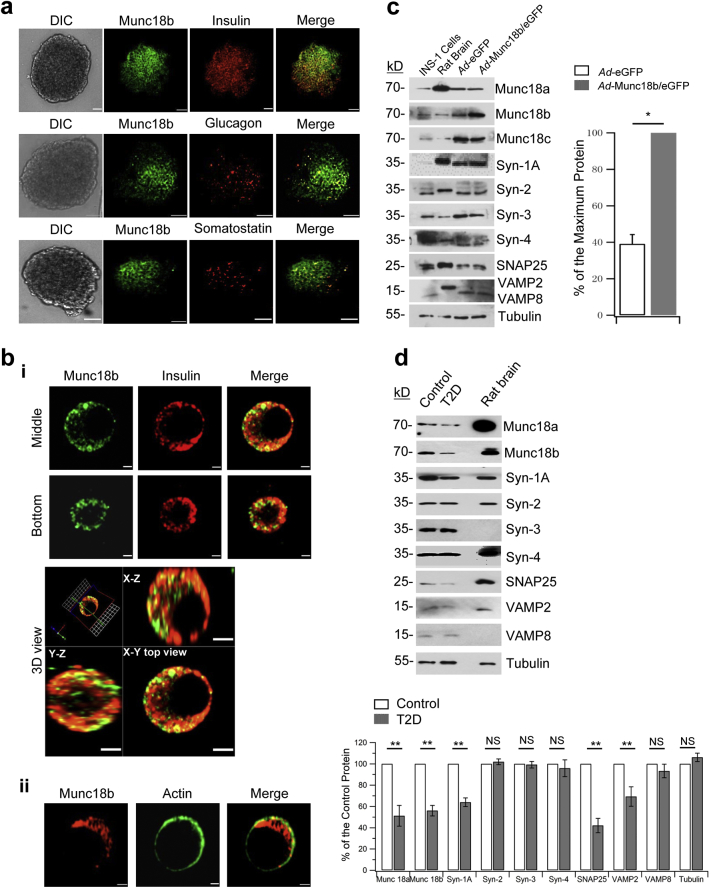
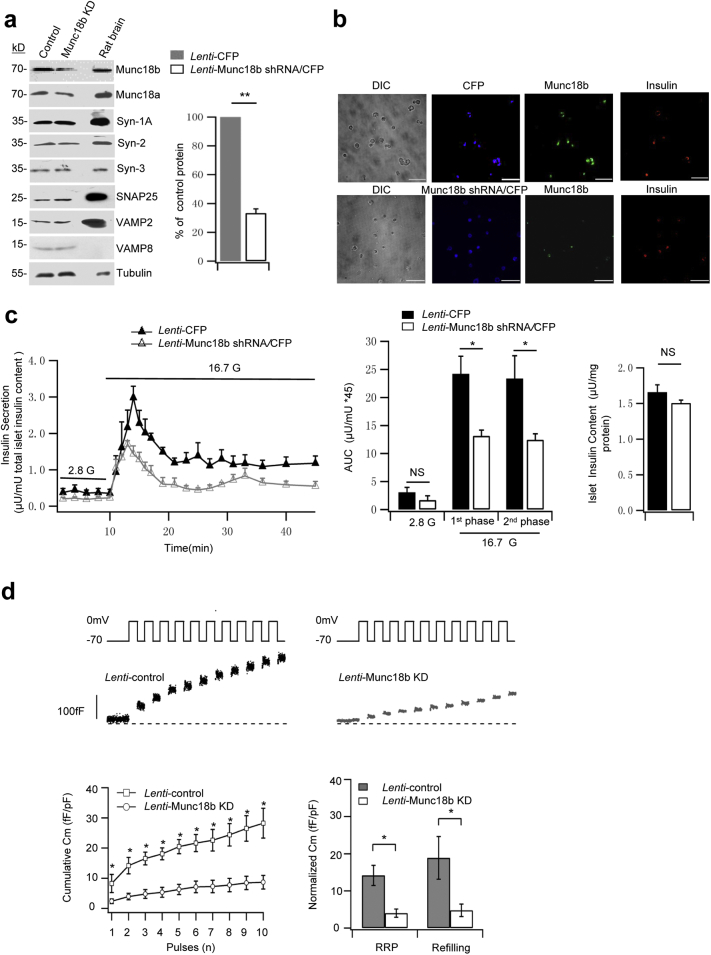
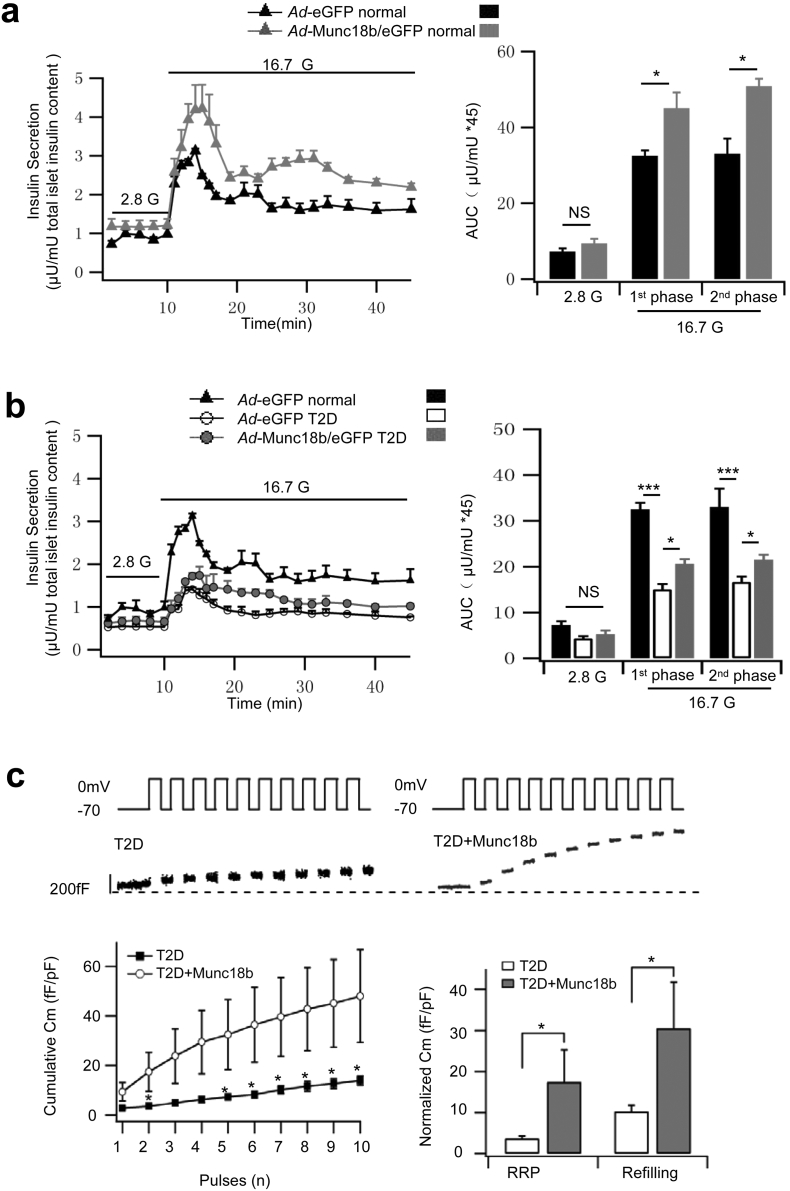
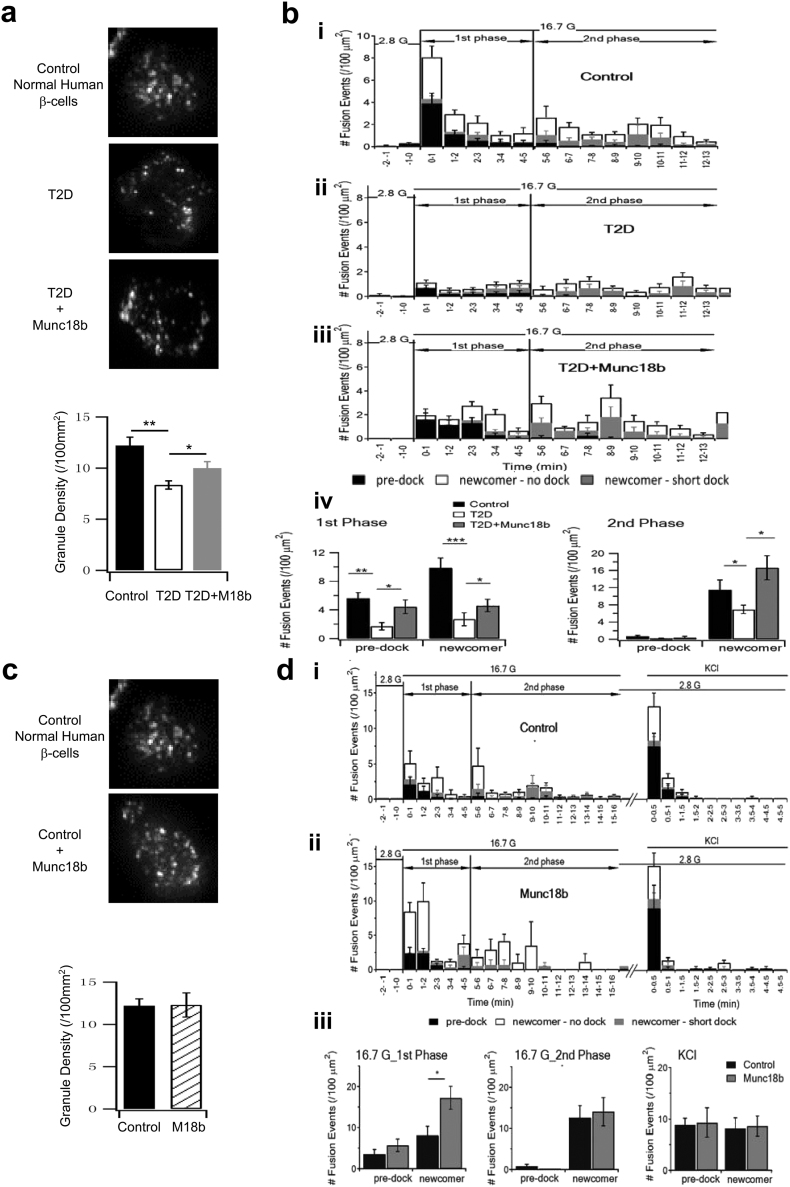
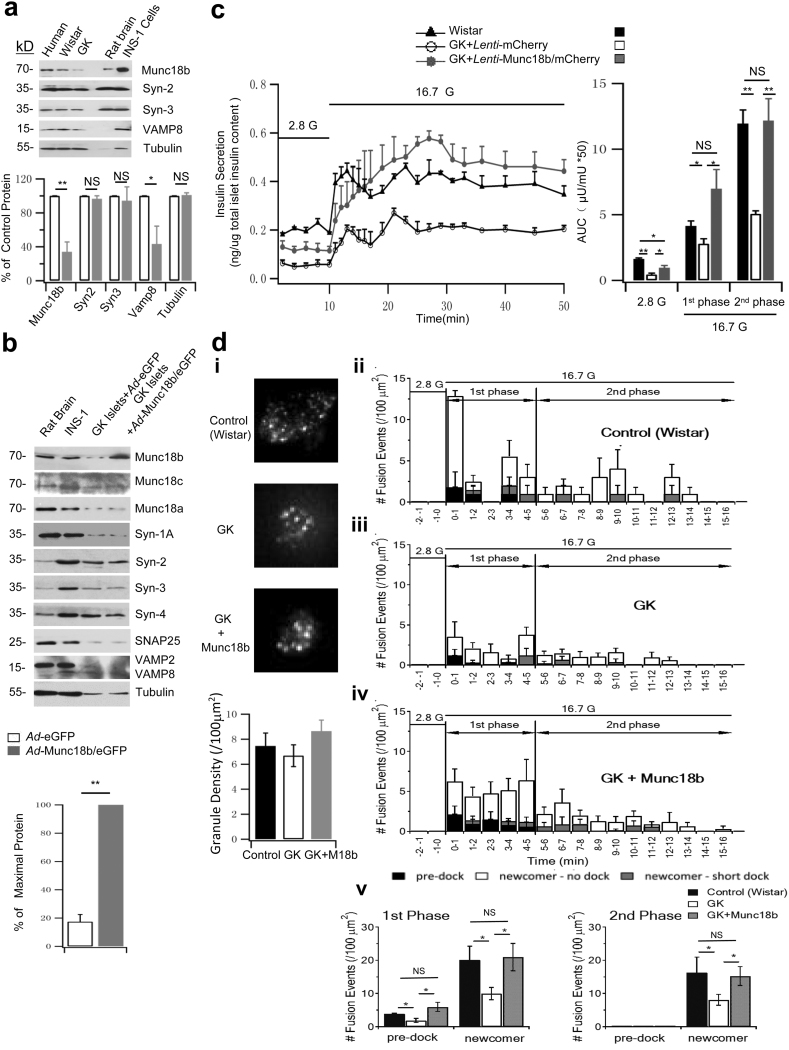
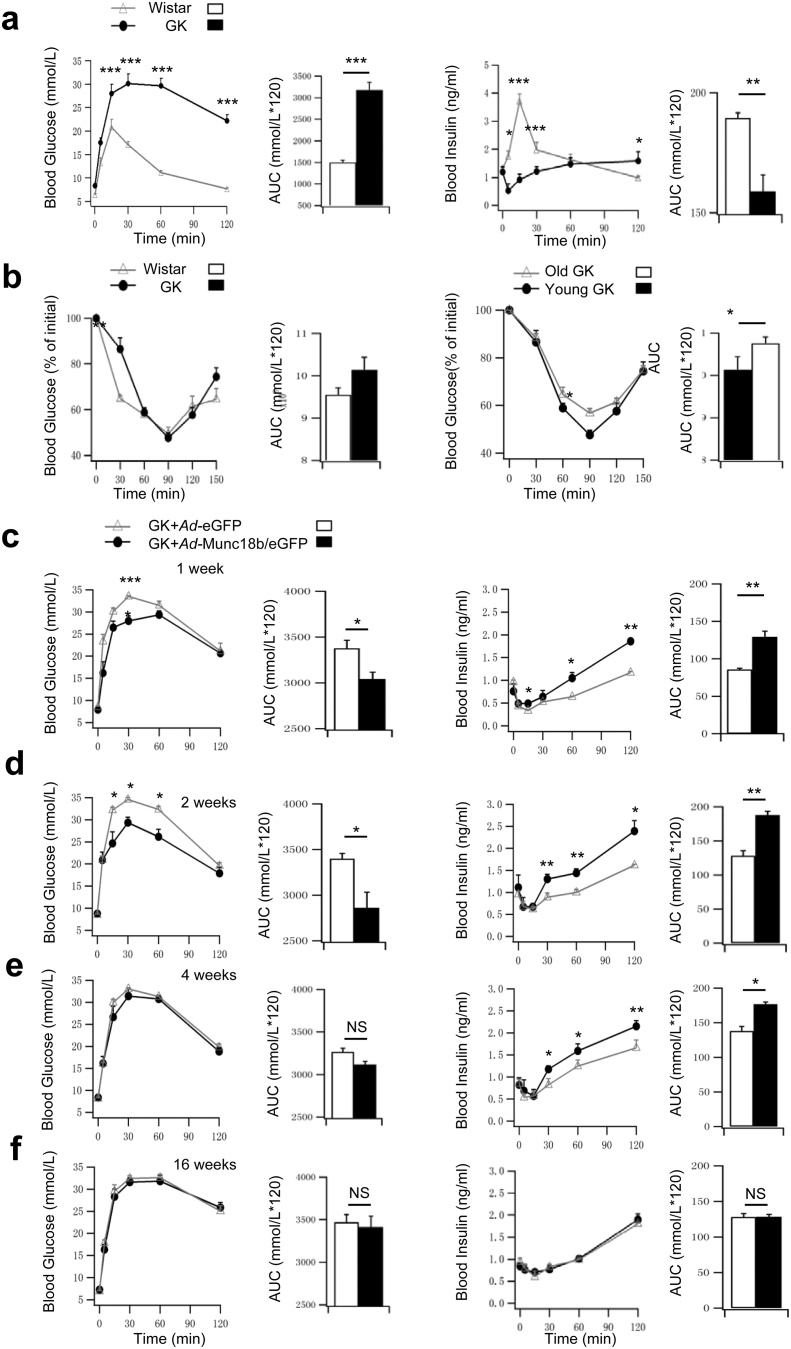
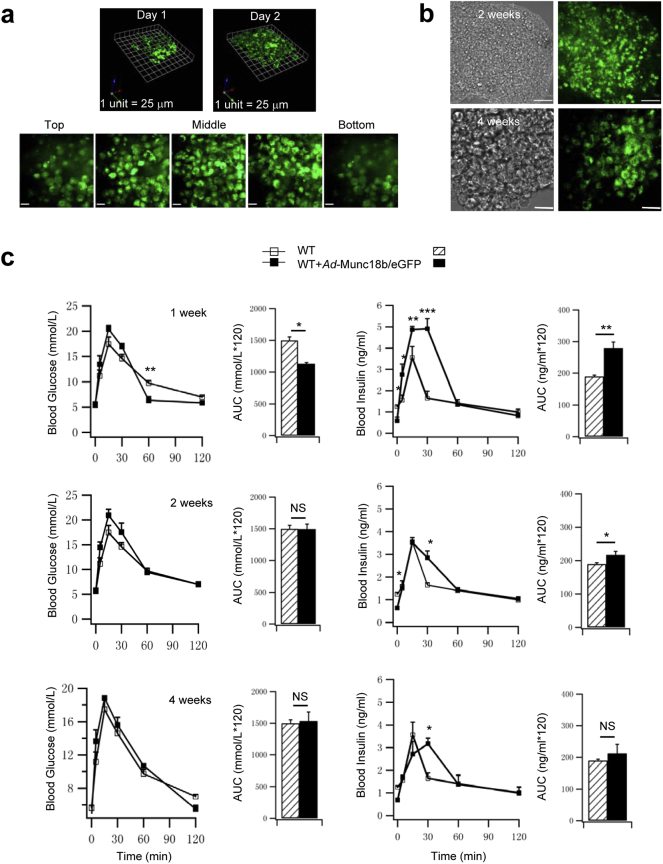
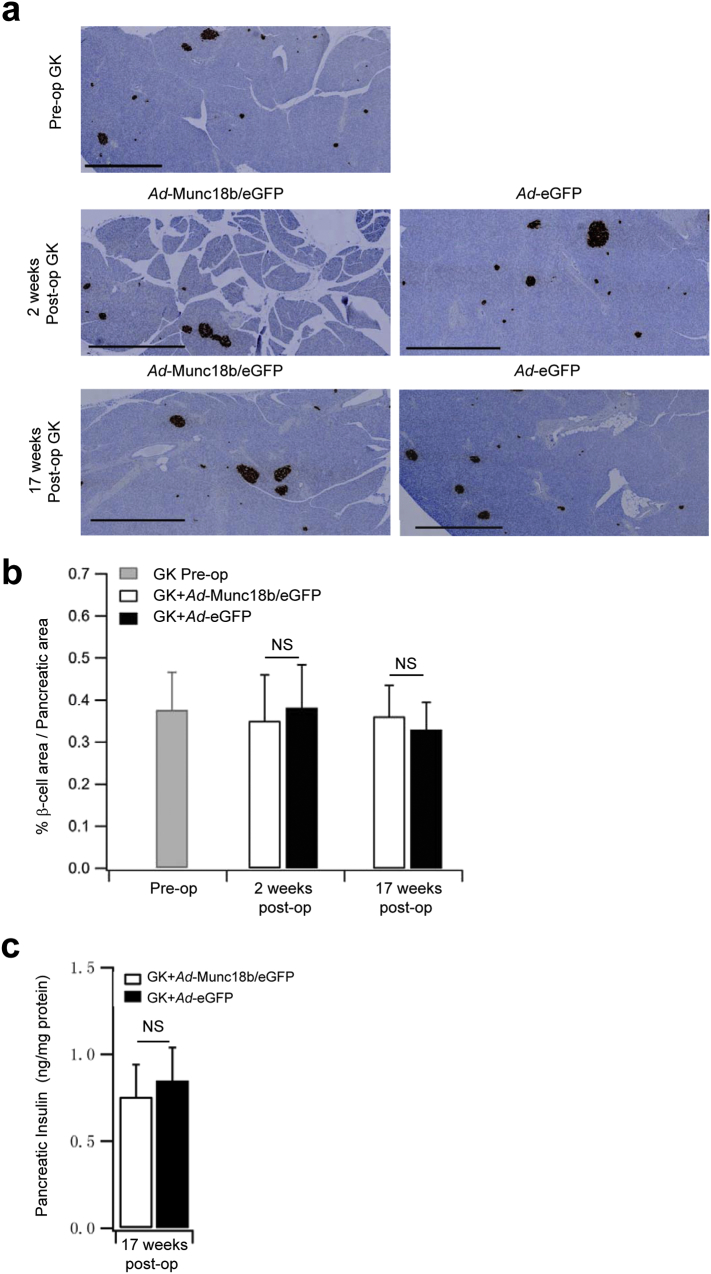
Reduced pancreatic islet levels of Munc18a/SNARE complex proteins have been postulated to contribute to the deficient glucose-stimulated insulin secretion (GSIS) in type-2 diabetes (T2D). Whereas much previous work has purported Munc18a/SNARE complex (Syntaxin-1A/VAMP-2/SNAP25) to be primarily involved in predocked secretory granule (SG) fusion, less is known about newcomer SGs that undergo minimal docking time at the plasma membrane before fusion. Newcomer SG fusion has been postulated to involve a distinct SM/SNARE complex (Munc18b/Syntaxin-3/VAMP8/SNAP25), whose levels we find also reduced in islets of T2D humans and T2D Goto-Kakizaki (GK) rats. Munc18b overexpression by adenovirus infection (Ad-Munc18b), by increasing assembly of Munc18b/SNARE complexes, mediated increased fusion of not only newcomer SGs but also predocked SGs in T2D human and GK rat islets, resulting in rescue of the deficient biphasic GSIS. Infusion of Ad-Munc18b into GK rat pancreas led to sustained improvement in glucose homeostasis. However, Munc18b overexpression in normal islets increased only newcomer SG fusion. Therefore, Munc18b could potentially be deployed in human T2D to rescue the deficient GSIS.


Figures

Fig. 1
Fig. 1
Munc18b in human β-cells and T2D patient islets. (a) Confocal microscopy showed Munc18b (green) localization to insulin positive β-cells (top), glucagon-positive α-cells (middle) and somatostatin-positive δ-cells (bottom) in human islets. Scale bar: 50 μm. (b) In dispersed single human islet β-cells, Munc18b (green) is largely located in insulin SGs (i, showing middle and bottom confocal cuts of the same cell). Substantial amounts were in the cytoplasm outside the SGs (green in Merge in i, and 3D view, bottom). 3D view is XY, XZ, and YZ cross-sectional views across the middle of the cell shown above. Munc18b also present in PM (ii, with actin). Scale bar: 0.5 μm. (c) Left: Western blot analysis of SNARE and SM proteins of Ad-Munc18b/eGFP and Ad-eGFP transduced normal human islets. Right: Densitometric analysis showing 2.56 fold Munc18b overexpression compared to normal levels (N = 3). Expression of other proteins was not affected by Munc18b overexpression (analysis data not shown). Data shown is representative of 3 separate experiments. (d) Western blots of islets from T2D patient donors compared to normal human islets. Graphical analysis (bottom) of Munc18b and SNARE proteins (N = 3). Data are shown as mean ± SEM, *p < 0.05; **p < 0.01; NS: no significant difference.
Fig. 2
Fig. 2
Munc18b depletion decreases biphasic GSIS in human islets. (a) Western blot analysis of Lenti-Munc18b shRNA/CFP-induced knockdown of Munc18b expression on normal human islets; representative of 3 experiments. Right: Densitometric analysis of the reduction of Munc18b normalized to percentage of control (N = 3); there was no change in any of the other proteins after Munc18b KD, therefore analysis not shown. (b) Islets transduced with Lenti-Munc18b shRNA/CFP (bottom) or Lenti-CFP (top) were dispersed to single cells, then triple labeled with CFP (assigned blue color), Munc18b/Cy5 (assigned green color) and insulin/TxRed (red color). Scale bar: 100 μm. (c) Islet perifusion assays on Lenti-Munc18b shRNA/CFP- vs Lenti-CFP-transduced normal human islets; corresponding AUCs analysis of first- (10–25 min) and second-phase (25–45 min) GSIS (middle) and total islet insulin content (right). N = 4 human islet donors. (d) Cm recording performed on single human β-cells (CFP-positive) infected with Lenti-Munc18b shRNA/CFP (N = 8) or Lenti-CFP (N = 6). Top: Representative recordings of ΔCm. Bottom left: Cumulative changes in Cm normalized to basal cell Cm (fF/pF). Bottom right: Summary of RRP (ΔCm1st–2nd pulses) and rate of SG refilling (ΔCm3rd–10th pulses). Data are shown as mean ± SEM, *p < 0.05; **p < 0.01, NS: no significant difference.
Fig. 3
Fig. 3
Munc18b overexpression rescues the deficient insulin secretion from pancreatic islets of type 2 diabetic patients. (a–b) Islet perifusion assays of (a) Ad-Munc18b/eGFP- vs Ad-eGFP-transduced normal human islets (N = 4 human islet donors); (b) Ad-eGFP-transduced normal (N = 4 from A) vs T2D human islets (N = 3 donors) vs Ad-Munc18b/eGFP-transduced T2D human islets (N = 3 donors). On the right are AUCs (area under the curve) summaries of the first- (10–25 min) and second-phase GSIS (25–45 min). (c) Cell membrane capacitance (Cm) recordings from T2D human pancreatic β-cells transduced with Lenti-Munc18b/mCherry (N = 7) vs Lenti-mCherry (Control, N = 10). Top: Representative recordings of ΔCm during a train of ten 500-ms depolarizations from − 70 mV to 0 mV. Bottom left: Cumulative changes in Cm normalized to basal cell Cm (fF/pF). Bottom right: Summary of RRP (ΔCm1st–2nd pulses) and rate of SG refilling (ΔCm3rd–10th pulses). Data are shown as mean ± SEM, *p < 0.05; ***p < 0.001, NS: no significant difference.
Fig. 4
Fig. 4
Munc18b rescues biphasic GSIS in T2D human islets by restoring exocytosis of predocked and newcomer SGs. TIRFM images (graphical analysis, bottom) SG density on the PM at basal condition (a–b) TIRFM images of SG density on the PM at basal condition (a) and histograms of SG fusion events during glucose-stimulated conditions (b) of T2D human β–cells. (a) SG density at resting condition (N = 12). Scale bars represent 2 μm. Bottom: Comparison of averaged SG densities. (b) Different glucose-stimulated fusion events in first-phase (first 5 min after 16.7 mM glucose stimulation) and second-phase (5–13 min) in control normal human β-cells (i, N = 15), T2D human β–cells transduced with Lenti-mCherry (ii, N = 18) or T2D human β–cells transduced with Lenti-Munc18b/mCherry (iii, N = 19). Data obtained from 3 independent experiments. (iv) Although (ii) and (iii) are shown in the three modes of fusion (predocked, short-dock and no-dock newcomer SGs) events in first- and second-phase GSIS, the summary combined the two populations of newcomer SGs. (c–d) TIRFM images showing the SG density on the PM at basal condition (c; N = 8; scale bars represent 2 μm; Bottom: Comparison of averaged SG densities) and histograms of SG fusion events at glucose-stimulated conditions of normal human β-cells (d). Normal human β-cells were transduced with Lenti-mCherry (i, control, N = 16) or Lenti-Munc18b/mCherry (ii, N = 17) and stimulated with 16.7 mM glucose followed by 40 mM KCl (right). Data obtained from 3 independent experiments. (iii) Although (i) and (ii) are shown in the three modes of fusion (predocked, short-dock and no-dock newcomer SGs) events in first- and second-phase GSIS, the summary combined the two populations of newcomer SGs, including the KCl stimulation. Data are shown as mean ± SEM, *p < 0.05; **p < 0.01, ***p < 0.001.
Fig. 5
Fig. 5
Munc18b restores the deficient GSIS in GK rat islets to normal levels. (a) Western blot analysis of Munc18b and cognate SNARE proteins in pancreatic islets of normal Wistar and GK rats. Bottom: Summary of densitometric analysis of blots from 3 separate experiments; results expressed as percentage of control values. (b) Western blot analysis of SM and SNARE proteins of Ad-Munc18b/eGFP and Ad-eGFP-transduced GK rat islets. Rat brain and INS-1 are positive controls. Data shown is representative of 3 sets of experiments. Bottom: densitometric analysis of Munc18b overexpression compared to Ad-eGFP-transduced GK rat islets (N = 3). Other proteins showed no change after Munc18b overexpression (analysis not shown). (c) Islet perifusion assays of Lenti-mCherry- and Lenti-Munc18b/mCherry-transduced GK rat islets, and Lenti-mCherry-transduced normal Wistar rat islets; and corresponding AUCs (right) of first-phase (10–25 min) and second-phase (25–50 min) insulin release. Data shown are from 3 sets of experiments. (d) TIRFM images showing SG density on the PM at basal condition (i, N = 9; scale bars represent 2 μm; Bottom: Comparison of averaged SG densities) and histograms of the different fusion events after glucose-stimulation (ii–iv). First-phase (5 min after 16.7 mM glucose stimulation) and second-phase (5–16 min) in Lenti-mCherry-transduced Wistar rat β-cells (i, N = 15), and GK rat β-cells transduced with Lenti-mCherry (ii, N = 17) or Lenti-Munc18b/mCherry (iii, N = 16). Data obtained from 3 independent experiments. (v) Although (ii), (iii) and (iv) are shown in three modes of fusion (predocked, short-dock and no-dock newcomer SGs) events in first- and second-phase GSIS, the summary combined the two populations of newcomer SGs. Data are shown as mean ± SEM, *p < 0.05; **p < 0.01, NS: no significant difference.
Fig. 6
Fig. 6
Infusion of Ad-Munc18b into the pancreas of T2D GK rats improves glucose homeostasis. (a) IPGTTs performed on age-matched Wistar and GK rats. Blood glucose (left) and insulin levels (right) are shown along with the AUCs encompassing 120 min of the IPGTT. N = 5 for each group. (b) IPITTs performed. Left: age-matched Wistar (N = 7) vs GK rats (N = 5). Right: Young (14 week old, N = 5) vs old (20 week old, N = 4) GK rats. Blood glucose results shown as percentage of initial levels along with AUCs encompassing 150 min of the IPITT. (c–f) Ad-Munc18b/eGFP vs Ad-eGFP infused via pancreatic duct into GK rats. IPGTTs (blood glucose (left), insulin levels (right)) performed post-op at 1 week (c), 2 weeks (d), 4 weeks (e) and 16 weeks (f). AUCs encompassing 120 min of the IPGTTs are shown. Ad-eGFP: N = 5 for 1 and 2 weeks, N = 4 for 4 and 16 weeks. Ad-Munc18b/eGFP: N = 6 for 1 and 2 weeks, N = 5 for 4 weeks, and N = 4 for 16 weeks. Data are shown as mean ± SEM; *p < 0.05, **p < 0.01, ***p < 0.001, NS: no significant difference.
Fig. S1
Fig. S1
Infusion of Ad-Munc18b into the pancreas of normal Wistar rats improves glucose homeostasis. (a) Islets from Wistar rats were isolated 2 h after pancreatic ductal infusion with Ad-Munc18b/eGFP, and placed into culture. Top: 3D reconstruction of 0.3 μm-thick optical confocal sections of islets at 1 and 2 days in culture. Bottom: corresponding images at different sections of the islet at 2 day culture. Scale bar: 25 μm. (b) Confocal images of islets isolated from Wistar rats at 2 weeks and 4 weeks post ductal infusion of Ad-Munc18b/eGFP (right; phase contrast images on left). Munc18b/eGFP expression remained optimal at 2 weeks (top, similar to the 2 day culture) but was substantially reduced at 4 weeks (bottom). Scale bar: 50 μm. (c) IPGTTs performed on normal Wistar rats treated with Ad-Munc18b/eGFP at 1-week, 2-week and 4-week post-op. Blood glucose (left) and insulin levels (right) are shown along with the AUCs encompassing 120 min of the IPGTT. N = 4 for each group. Data are shown as mean ± SEM; *p < 0.05, **p < 0.01, NS: no significant difference.
Fig. S2
Fig. S2
In vivo Ad-Munc18b treatment of GK rats does not alter islet β-cell mass. (a) Insulin-immunostained pancreatic sections (scale bars represent 1000 μm). (b) Insulin positive β-cell area per pancreatic area ratios. (N = 12 for each group from 2 independent experiments). (c) Islet insulin content (N = 4 for each group). Data are shown as mean ± SEM; NS: no significant difference.

Similar articles

Cited by

References

    1. Al Hawas R., Ren Q., Ye S., Karim Z.A., Filipovich A.H., Whiteheart S.W. Munc18b/STXBP2 is required for platelet secretion. Blood. 2012;120:2493–2500. - PMC - PubMed
    1. Banks K., Qin T., Liang T., Wang A.J., Gaisano H.Y. Biliopancreatic route for effective viral transduction of pancreatic islets. Pancreas. 2014;43:240–244. - PubMed
    1. Gaddy D.F., Riedel M.J., Bertera S., Kieffer T.J., Robbins P.D. dsAAV8-mediated gene transfer and β-cell expression of IL-4 and β-cell growth factors are capable of reversing early-onset diabetes in NOD mice. Gene Ther. 2012;19:791–799. - PubMed
    1. Kwan E.P., Gaisano H.Y. Rescuing the subprime meltdown in insulin exocytosis in diabetes. Ann. N.Y. Acad. Sci. 2009;1152:154–164. - PubMed
    1. Gaisano H.Y. Here come the newcomers granules, better late than never. Trends Endocrinol. Metab. 2014;25:381–388. - PubMed

MeSH terms