. 2017 Sep;43(Pt B):125-136.
doi: 10.1016/j.ymben.2017.01.010. Epub 2017 Feb 2.

Probing the metabolic phenotype of breast cancer cells by multiple tracer stable isotope resolved metabolomics

Affiliations

Probing the metabolic phenotype of breast cancer cells by multiple tracer stable isotope resolved metabolomics

Andrew N Lane et al. Metab Eng. 2017 Sep.

Abstract

Breast cancers vary by their origin and specific set of genetic lesions, which gives rise to distinct phenotypes and differential response to targeted and untargeted chemotherapies. To explore the functional differences of different breast cell types, we performed Stable Isotope Resolved Metabolomics (SIRM) studies of one primary breast (HMEC) and three breast cancer cells (MCF-7, MDAMB-231, and ZR75-1) having distinct genotypes and growth characteristics, using 13C6-glucose, 13C-1+2-glucose, 13C5,15N2-Gln, 13C3-glycerol, and 13C8-octanoate as tracers. These tracers were designed to probe the central energy producing and anabolic pathways (glycolysis, pentose phosphate pathway, Krebs Cycle, glutaminolysis, nucleotide synthesis and lipid turnover). We found that glycolysis was not associated with the rate of breast cancer cell proliferation, glutaminolysis did not support lipid synthesis in primary breast or breast cancer cells, but was a major contributor to pyrimidine ring synthesis in all cell types; anaplerotic pyruvate carboxylation was activated in breast cancer versus primary cells. We also found that glucose metabolism in individual breast cancer cell lines differed between in vitro cultures and tumor xenografts, but not the metabolic distinctions between cell lines, which may reflect the influence of tumor architecture/microenvironment.

Keywords: (13)C(3)-glycerol; (13)C(3)-glycerol (PubChem CID:753); (13)C(5); (13)C(5),(15)N(2)-Glutamine (PubChem CID:5961); (13)C(6)-glucose; (13)C(6)-glucose (PubChem CID:5793); (13)C(8)-octanoate; (13)C(8)-octanoate (PubChem CID:11939); (15)N(2)-Gln; (PubChem CID:5927); 1D/2D NMR; ATP; Breast cancer metabolism; FT-ICR-MS; Mouse xenografts; Stable isotope-resolved metabolomics; UTP(PubChem CID:6133); alanine (PubChem CID:5950); aspartate (PubChem CID:5460541); glutamate (PubChem CID:5128032); lactate (PubChem CID:91435).


Figures

Figure 1
Figure 1. Carbon fates in central metabolism
Observed fates of glucose and glutamine-derived carbon in breast cancer cells. The inner dashed box represents mitochondrial reactions. 1 glucose transporter; 2 hexokinase; 3 phosphoglucomutase; 4 aldolase; 5 lactate dehydrogenase; 6 alanine amino transferase; 7 glucose/hexosamine pathway; 8 pentose phosphate pathway: oxidative branch; 9 pentose phosphate pathway: non-oxidative branch ; 10, pyrimidine nucleotide synthesis; 11 hexosamine pathway; 12 glycogen synthesis; 13 phosphoglycerate dehydrogenase; 14 glycerol-3-phosphate dehydrogenase 15 pyruvate dehydrogenase; 16 pyruvate carboxylase; 17 citrate synthase; 18, 18′ malate dehydrogenase; 19,19′ aspartate aminotransferase; 20 malic enzyme; 21 glutaminase; 22 ATP-dependent citrate lyase; 23 fatty acid synthesis; 24 purine biosynthesis.
Figure 2
Figure 2. 2D 1H TOCSY Spectra of four breast cell lines grown in the presence of 13C6-glucose show differential capacity for ribose incorporation into nucleotides
TCA extracts were prepared from cells grown for 24 h in the presence of 13C6-glucose. 2D TOCSY contour maps were shown along with the corresponding 1D high-resolution 1H spectra. Dashed boxes delineate 13C satellite cross-peaks for the H1′ (x-axis) to H2′ and H3′ (y-axis) in the ribosyl unit of adenine (AXP) and H1′ to H2/H3′ in the ribosyl unit of uracil (UXP) nucleotides. Such 13C labeling patterns are consistent with the presence of 13C5-ribose subunits in both types of nucleotides, which in turn suggests the operation of PPP via the oxidative and/or non-oxidative branches. Values in parenthesis denote fractional 13C enrichment in the ribosyl unit of AXP or UXP at the 1′ position. A. HMEC; B. MCF-7; C. ZR-75-1; D. MDA-MB-231
Figure 3
Figure 3. 13C atom tracing of 13C-1+13C-2-glucose transformations via glycolysis, PPP, and nucleotide (NT) biosynthesis
TCA extracts were prepared from cells grown for 24 h in the presence of equimolar 13C-1- and 13C-2-glucose. ● denotes 12C while formula image, formula image 
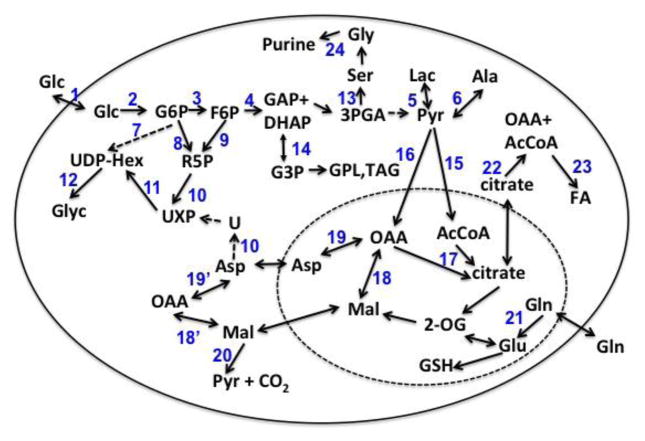
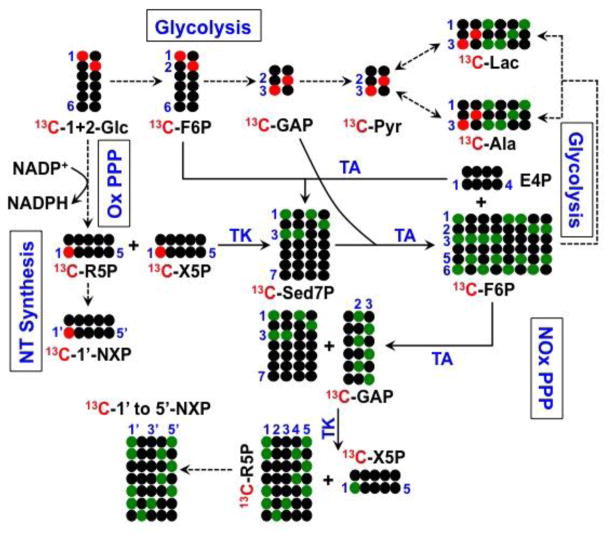
represent 13C derived from OxPPP and NOxPPP, respectively. Ox PPP and NOx PPP: oxidative and non-oxidative branches of the pentose phosphate pathway, respectively; Glc: glucose; F6P: fructose-6-phosphate; GAP: glyceraldehyde-3-phosphate; Pyr: pyruvate; Lac: lactate; R5P: ribose-5-phosphate; X5P: xylulose-5-phosphate; Sed7P: sedoheptulose-7-phosphate; NXP: nucleotides; TK: transketolase; TA: transaldolase
Figure 4
Figure 4. 2D 1H TOCSY Spectra of three breast cell lines grown in the presence of 13C-1-+13C-2-glucose reveal differential capacity for oxidative and non-oxidative branches of the pentose phosphate pathway
TCA extracts were prepared from cells grown for 24 h in the presence of 13C-1-+13C-2 glucose. 13C labeling patterns in the ribosyl subunits of nucleotides. These labeling pattern showed that both oxidative and non-oxidative branches of the PPP were active. Dashed lines indicated 13C satellite cross-peaks at given atomic positions of metabolites.
Figure 5
Figure 5
13C tracing from 13C6-Glc or 13C5,15N2-Gln into uracil ring. The two sets of atom tracing depict the transformation of 13C6-Glc (A) or 13C5,15N2-Gln (B) into Asp via the first turn of the Krebs cycle, and then into the uracil ring of UMP via the pyrimidine synthesis pathway. ●: 12C; formula image
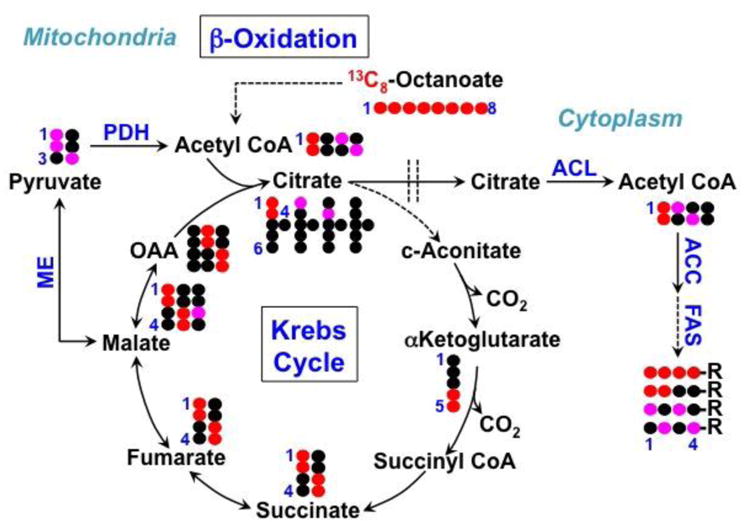
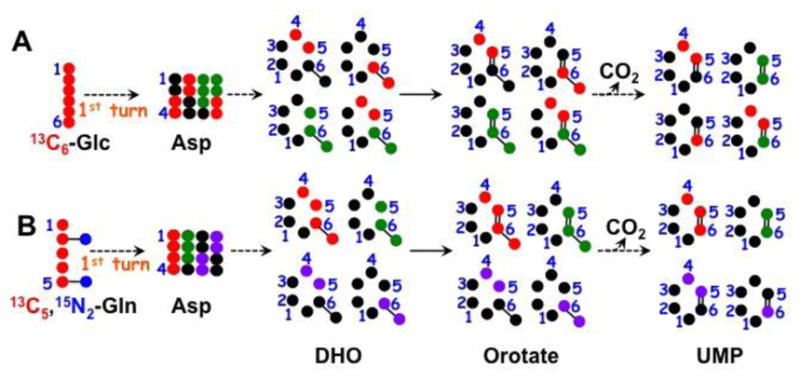
: 13C from pyruvate dehydrogenase-initiated Krebs cycle in A or from glutaminolysis+Krebs cycle in B; formula image : 13C from pyruvate carboxylase-initiated Krebs cycle ; formula image : 13C from glutaminolysis+Krebs cycle+malic enzyme (Le, Lane et al. 2012); DHO : dihydroorotate.
Figure 6
Figure 6. 13C incorporation from 13C6-glucose versus 13C5,15N2-Gln into pyrimidine nucleotides in three breast cell lines
Cells were grown for 24 h in the presence of 5 mM each labeled glutamine (A) or glucose (B) tracer. 2D TOCSY spectra were recorded at 600 or 800 MHz using a mixing time of 50 ms along. The 2D TOCSY contour maps were shown along with the 1D high-resolution 1H spectra. Dashed boxes depicted the 13C satellites of C5 to C6 cross-peaks of the uracil ring in UXP with horizontal pairs, vertical pairs, and 4-corner satellites representing 13C labeling at C5, C6, and C5,6 of uracil, respectively.
Figure 7
Figure 7
MDAMB-231 cells synthesize less lipids from glucose than other breast cell lines despite its higher proliferation rate. HMEC (A), MCF-7 (B) and MDA-MB-231 (C) cells were grown for 24 h in the presence of 13C6-glucose and extracted as described in the Methods. The lipid extracts were dissolved in d4-methanol, and TOCSY spectra were recorded at 14.1 T with an isotropic mixing time of 50 ms at 25 °C. Both HMEC (A) and MCF-7 (B) cells showed extensive 13C enrichment (as 13C satellite cross-peaks, green boxes) in the glycerol subunit and fatty acyl chains, which was less in extent for the glycerol subunit and absent for the fatty acyl chains in MDAMB-231 cells (C). Blue boxes denote covalent linkages of protons attached to 12C of the glycerol backbone and fatty acyl chains. 1/3, 2: 13C satellites, 12C-attached unsaturated protons, respectively; 3, 4: 12C-attached, 13C satellite of H2 of glycerol backbone, respectively; 5, 6/7: 13C satellite,12C-attached H1 of glycerol backbone, respectively; 8/10, 9: 13C satellites, 12C-attached H3 of glycerol backbone, respectively; 11, 12: : 13C satellites, 12C-attached H2 of fatty acyl chains, respectively; 13, 14: 12C-attached, 13C satellite of H11 of fatty acyl chains, respectively; 15, 16: 12C-attached, 13C satellite of H3 of fatty acyl chains, respectively.
Figure 8
Figure 8. Differential incorporation of carbon from different sources into phospholipids of ZR-75-1 cells
Cells were grown in the presence of 20% oxygen and 13C6-glucose (A), 13C5,15N2-glutamine (B), 13C3-glycerol (C) or 13C8-octanoate (D) for 72 h, and extracted for phospholipids (PL) with methanol. The TOCSY spectra were recorded at 18.8 T, 20 °C. Blue and green boxes respectively denote 1H connectives between 12C-attached protons and 13C satellites of 13C-attached protons. See Fig. 7 for the assignment of each numbered peaks.
Figure 9
Figure 9. 13C incorporation from 13C8-octonate into fatty acyl chains of lipids in ZR75-1 cells via beta-oxidation and malic enzyme activity
The 13C atom in 13C8-octanoate is traced into lipids via the reactions of β-oxidation, Krebs cycle, malic enzyme (ME), pyruvate dehydrogenase (PDH), ATP-citrate lyase (ACL), acetyl CoA carboxylase (ACC), and fatty acid synthase (FAS). Double dashed lines delineate mitochondria from the cytoplasm. OAA: oxaloacetate.
Figure 10
Figure 10. FT-ICR-MS analysis of lipids extracted from three breast cell lines reveals distinct capacity of 13C6-glucose in fueling de novo lipid synthesis
Lipids were extracted from cells grown in the presence of 13C6-glucose and analyzed by FT-ICR-MS as described in the Methods. A. the m/z range of MDAMB-231, MCF-7, and HMEC extracts dominated by diacylglycerophospholipids; B the expanded m/z range dominated respectively by is PC 32:1+H labeled in all 3 cell types. The prominent, labeled peaks are the isotopologues (blue box from A); C. expansion red box of panel A: assignments are as follows: MDA is PS-pmg 40:7 +H (820.548398 m/z for m0 ; MCF7 is PE 40:7+Na -m0 (812.513658 m/z) is at the base of the prominent peak (unlabeled). HMEC is PC-pmg 40:7 +H. The m0 (818.602868 m/z) was not detected.
Figure 11
Figure 11. 13C6-glucose transformations in ZR75-1 and MDAMB-231 cells as mouse xenografts show similar metabolic distinctions as observed in vitro
Orthotopic tumors were grown from ZR75-1 or MDAMB-231 cells as described in the Methods. Mice were treated with 20 mg each 13C6-glucose via three tail vein injections at a 15-min interval (Lane, Yan et al. 2015). The tumors were harvested, polar metabolites extracted, and analyzed by 1D 1H{13C}-HSQC at 14.1 T and 20 °C in A. ZR75-1 and MDAMB231 cells in B were cultured in DMEM medium containing 0.1% 13C6-glucose for 24 h before extraction of polar metabolites with 10% trichloroacetic acid (MDAMB231) or 60% acetonitrile (ZR75-1) and 1D HSQC analysis as described in Methods. Some of the metabolites in B such as lactate (Lac), Ala, Glu, Asp, and adenine nucleotides (AXP) displayed different chemical shifts between the extracts of the two cell lines due to their pH difference.

Similar articles

Cited by

References

    1. ACS. Breast Cancer Facts & Figures 2015–2016. Atlanta: American Cancer Society; 2016. pp. 1–38.
    1. Bliss J, Kilburn L, Coleman R, Forbes J, Coates A, Jones S, Jassem J, Delozier T, Andersen J, Paridaens R, van de Velde C, Lønning P, Morden J, Reise J, Cisar L, Menschik T, Coombes R. Disease-related outcomes with long-term follow-up: an updated analysis of the intergroup exemestane study. J Clin Oncol. 2012;30:709–717. - PubMed
    1. Boren J, Cascante M, Marin S, Comin-Anduix B, Centelles JJ, Lim S, Bassilian S, Ahmed S, Lee WNP, Boros LG. Gleevec (ST1571) influences metabolic enzyme activities and glucose carbon flow toward nucleic acid and fatty acid synthesis in myeloid tumor cells. Journal of Biological Chemistry. 2001;276(41):37747–37753. - PubMed
    1. Boros LG, Puigjaner J, Cascante M, Lee WNP, Brandes JL, Bassilian S, Yusuf FI, Williams RD, Muscarella P, Melvin WS, Schirmer WJ. Oxythiamine and dehydroepiandrosterone inhibit the nonoxidative synthesis of ribose and tumor cell proliferation. Cancer Research. 1997;57(19):4242–4248. - PubMed
    1. Centelles JJ, Ramos-Montoya A, Lim S, Bassilian S, Boros LG, Marin S, Cascante M, Lee WNP. Metabolic profile and quantification of deoxyribose synthesis pathways in HepG2 cells. Metabolomics. 2007;3(2):105–111.

Publication types