Review
. 2010;13(1):4.
doi: 10.12942/lrr-2010-4. Epub 2010 Sep 1.

The Pioneer Anomaly

Affiliations
Review

The Pioneer Anomaly

Slava G Turyshev et al. Living Rev Relativ. 2010.

Abstract

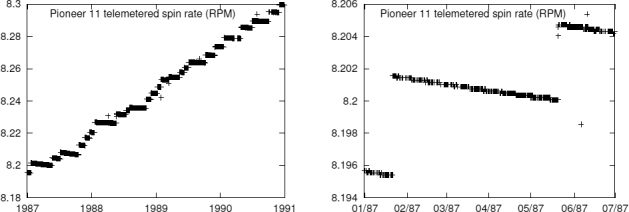
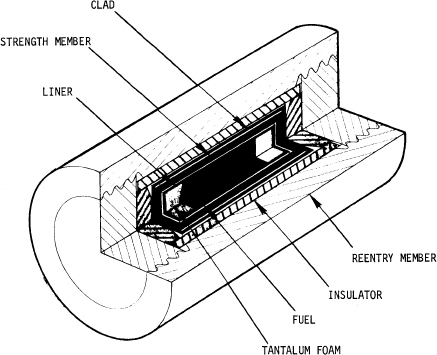
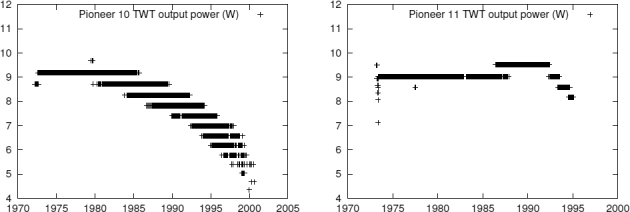
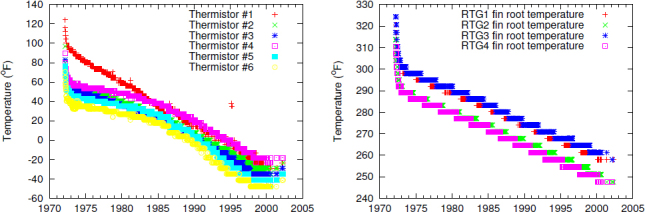
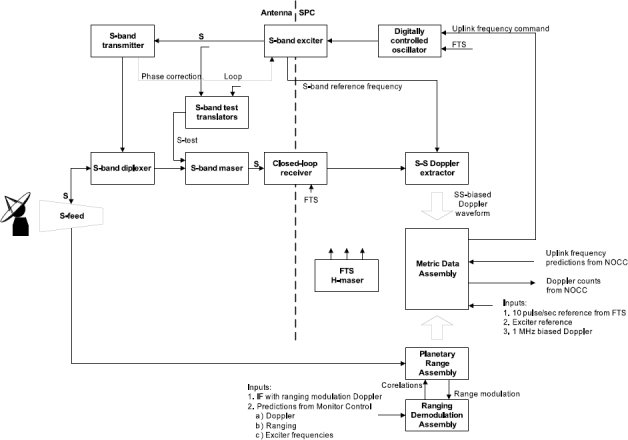
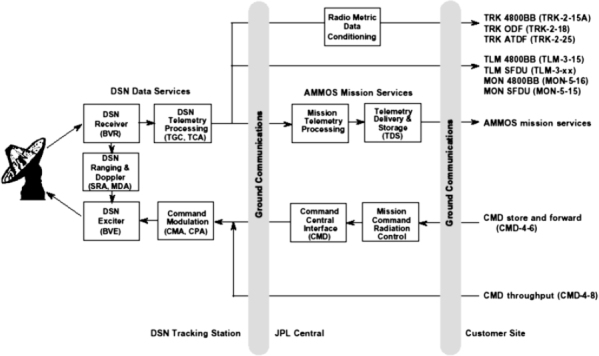
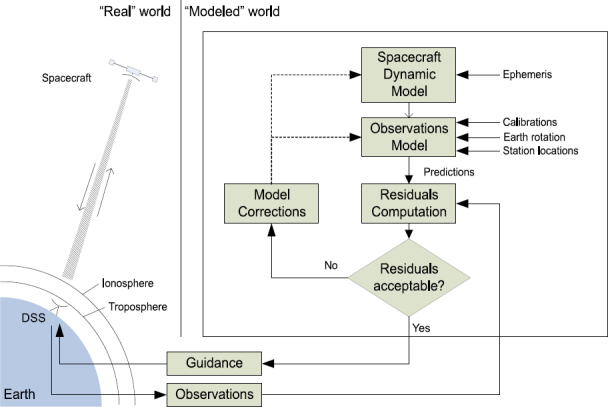
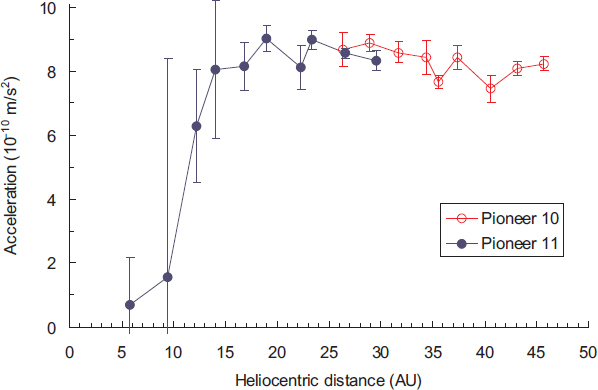
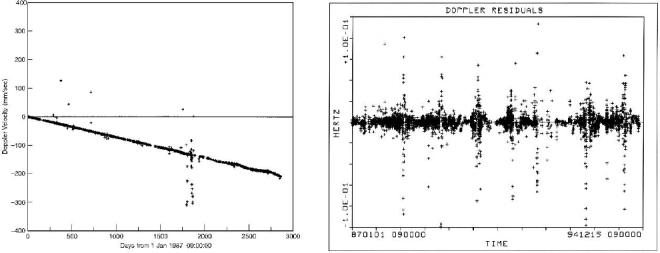
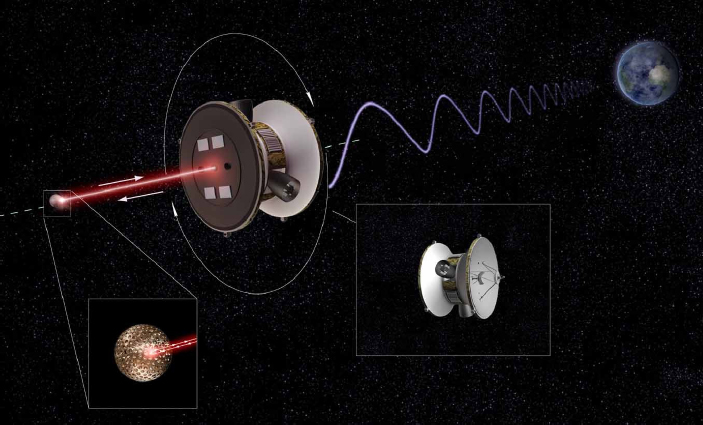
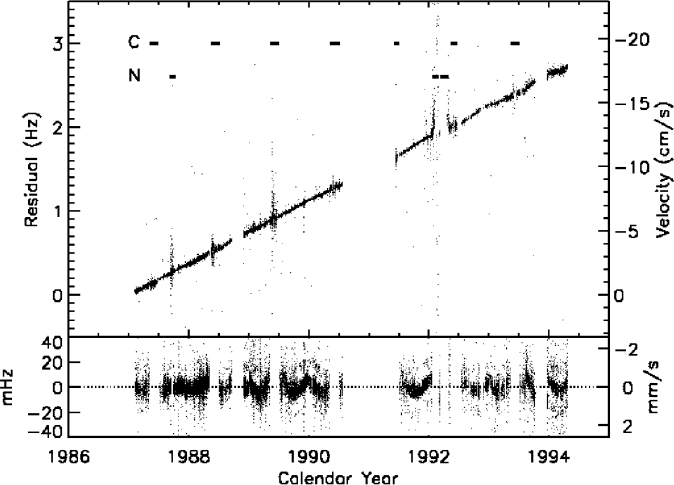
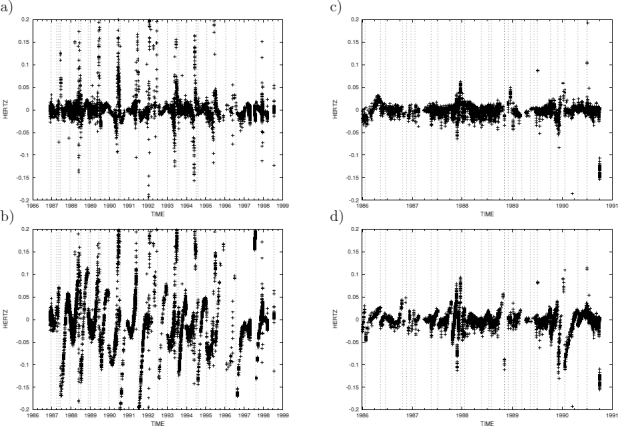
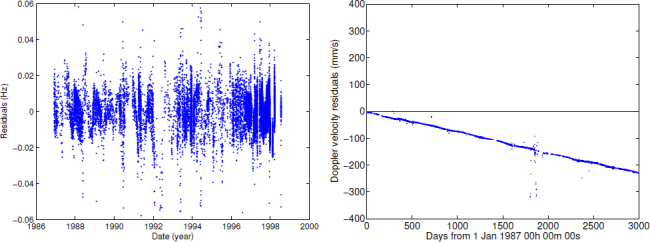
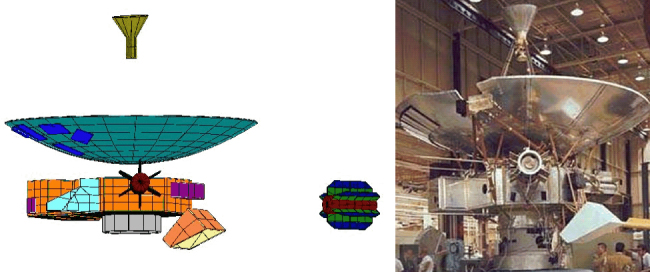
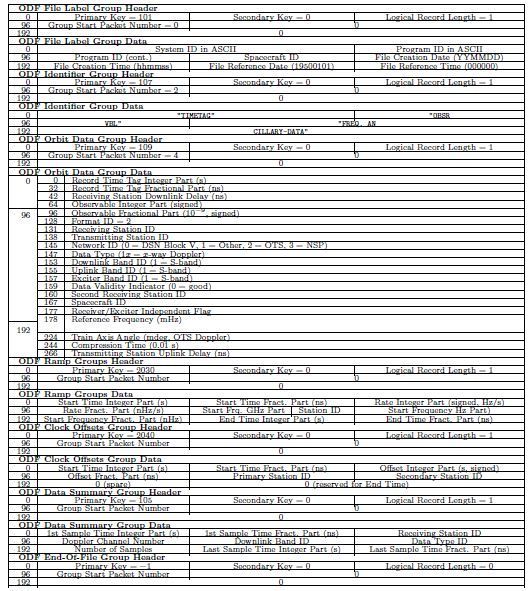
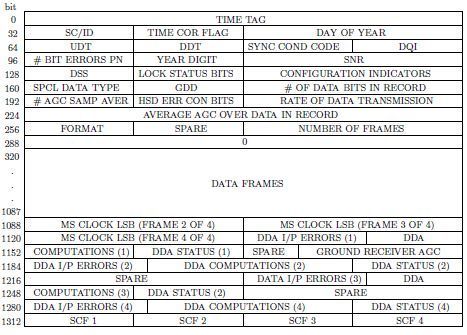
Radio-metric Doppler tracking data received from the Pioneer 10 and 11 spacecraft from heliocentric distances of 20-70 AU has consistently indicated the presence of a small, anomalous, blue-shifted frequency drift uniformly changing with a rate of ∼ 6 × 10⁻⁹ Hz/s. Ultimately, the drift was interpreted as a constant sunward deceleration of each particular spacecraft at the level of aP = (8.74 ± 1.33) × 10-10 m/s2. This apparent violation of the Newton's gravitational inverse-square law has become known as the Pioneer anomaly; the nature of this anomaly remains unexplained. In this review, we summarize the current knowledge of the physical properties of the anomaly and the conditions that led to its detection and characterization. We review various mechanisms proposed to explain the anomaly and discuss the current state of efforts to determine its nature. A comprehensive new investigation of the anomalous behavior of the two Pioneers has begun recently. The new efforts rely on the much-extended set of radio-metric Doppler data for both spacecraft in conjunction with the newly available complete record of their telemetry files and a large archive of original project documentation. As the new study is yet to report its findings, this review provides the necessary background for the new results to appear in the near future. In particular, we provide a significant amount of information on the design, operations and behavior of the two Pioneers during their entire missions, including descriptions of various data formats and techniques used for their navigation and radio-science data analysis. As most of this information was recovered relatively recently, it was not used in the previous studies of the Pioneer anomaly, but it is critical for the new investigation.


Figures

Figure 2.1
Figure 2.1
Trajectories of Pioneer 10 and 11 during their primary missions in the solar system (from [126]). The time ticks shown along the trajectories and planetary orbits represent the distance traveled during each year.
Figure 2.2
Figure 2.2
Ecliptic pole view of the Pioneer 10 and Pioneer 11 trajectories during major parts of their extended missions. Pioneer 10 is traveling in a direction almost opposite to the galactic center, while Pioneer 11 is heading approximately in the shortest direction to the heliopause. The direction of the solar system’s motion in the galaxy is approximately towards the top. (From [27].)
Figure 2.3
Figure 2.3
A drawing of the Pioneer spacecraft. (From [292].)
Figure 2.4
Figure 2.4
Pioneer 10 and 11 internal equipment arrangement. (From [292].)
Figure 2.5
Figure 2.5
The SNAP-19 RTGs used on Pioneer 10 and 11 (from [350]). Note the enlarged fin structure. Dimensions are in inches (1″ = 2.54 cm).
Figure 2.6
Figure 2.6
Overview of the Pioneer 10 and 11 electrical subsystem (from [292]).
Figure 2.7
Figure 2.7
Pioneer 10 power budget on July 25, 1981, taken as an example. Power readings that were obtained from spacecraft telemetry are indicated by the telemetry word in the form Cnnn. The discrepancy between generated power and power consumption is due to rounding errors and uncertainties in the nominal vs. actual power consumption of various subsystems.
Figure 2.8
Figure 2.8
An overview of the Pioneer 10 and 11 propulsion subsystem (from [292]).
Figure 2.9
Figure 2.9
Location of thermal sensors in the instrument compartment of the Pioneer 10 and 11 spacecraft (from [292]). Platform temperature sensors are mounted at locations 1 to 6. Some locations (i.e., end of RTG booms, propellant tank interior, etc.) not shown.
Figure 2.10
Figure 2.10
The Pioneer 10 and 11 thermal control louver system, as seen from the aft (−z) direction (from [292]).
Figure 2.11
Figure 2.11
Louver blade angle as a function of platform temperature (from [385]). Temperatures in °F ([°C] = ([°F]−32) × 5/9).
Figure 2.12
Figure 2.12
Louver structure heat loss as a function of platform temperature (from [385]). Temperatures in °F ([°C] = ([°F]−32) × 5/9).
Figure 2.13
Figure 2.13
Louver assembly performance (from [385]). Temperatures in °F ([°C] = ([°F]−32) × 5/9).
Figure 2.14
Figure 2.14
Changes in total RTG electrical output (in W) on board Pioneer 10 (left) and 11 (right), as computed using the missions’ on-board telemetry.
Figure 2.15
Figure 2.15
Propulsion tank pressure (in pounds per square inch absolute; 1 psia = 6.895 kPa) on board Pioneer 10. The three intervals studied in [27] are marked by roman numerals and separated by vertical lines.
Figure 2.16
Figure 2.16
On-board spin rate measurements (in rpm) for Pioneer 10 (left) and Pioneer 11 (right). The sun sensor used on Pioneer 10 for spin determination was temporarily disabled between November 1983 and July 1985, and was turned off in May 1986, resulting in a ‘frozen’ value being telemetered that no longer reflected the actual spin rate of the spacecraft. Continuing spot measurements of the spin rate were made using the Imaging Photo-Polarimeter (IPP) until 1993. The anomalous increase in Pioneer 11’s spin rate early in the mission was due to a failed spin thruster. Continuing increases in the spin rate were due to maneuvers; when the spacecraft was undisturbed, its spin rate slowly decreased, as seen in Figure 2.17.
Figure 2.17
Figure 2.17
Zoomed plots of the spin rate of Pioneer 11. On the left, the interval examined in [27] is shown; maneuvers are clearly visible, resulting in discrete jumps in the spin rate. The figure on the right focuses on the first half of 1987; the decrease in the spin rate when the spacecraft was undisturbed is clearly evident.
Figure 2.18
Figure 2.18
1 W radioisotope heater unit (RHU). From [292].
Figure 2.19
Figure 2.19
The emitted power (measured in dBm, converted to W) of the traveling wave tube transmitter throughout the mission, as measured by on-board telemetry. Left: Pioneer 10, which used TWT A (telemetry word C231). Right: Pioneer 11, initially using TWT A but switching to TWT B (telemetry word C214) early in its mission.
Figure 2.20
Figure 2.20
Platform temperatures (left) and RTG fin root temperatures (right) on board Pioneer 10. Temperatures in °F ([° C] = ([°F]−32) × 5/9).
Figure 2.21
Figure 2.21
Platform temperatures (left) and RTG fin root temperatures (right) on board Pioneer 11. Temperatures in °F ([° C] = ([°F]−32) × 5/9).
Figure 3.1
Figure 3.1
DSN facilities planned to be used by the Pioneer project in 1972 [334]. DSIF stands for Deep Space Instrumentation Facility, GCF is the abbreviation for Ground Communications Facility, while SFOF stands for the Space Flight Operations Facility.
Figure 3.2
Figure 3.2
DSN performance estimate throughout the primary missions of Pioneer 10 and 11. Adapted from [339].
Figure 3.3
Figure 3.3
The Doppler extraction process. Adapted from [374].
Figure 3.4
Figure 3.4
Block diagram of the DSN baseline configuration as used for radio Doppler tracking of the Pioneer 10 and 11 spacecraft. Adapted from [27, 101]. (IF stands for Intermediate Frequency.)
Figure 3.5
Figure 3.5
Typical tracking configuration for a Pioneer-class mission and corresponding data format flow [397].
Figure 4.1
Figure 4.1
Schematic overview of the radio navigation process. Adapted from [374].
Figure 5.1
Figure 5.1
Early unmodeled sunward accelerations of Pioneer 10 (from about 1981 to 1989) and Pioneer 11 (from 1977 to 1989). Adapted from [27], which contained this important footnote: “Since both the gravitational and radiation pressure forces become so large close to the Sun, the anomalous contribution close to the Sun in [this figure] is meant to represent only what anomaly can be gleaned from the data, not a measurement.”
Figure 5.2
Figure 5.2
Left: Two-way Doppler residuals (observed Doppler velocity minus model Doppler velocity) for Pioneer 10. On the vertical axis, 1 Hz is equal to 65 mm/s range change per second. Right: The best fit for the Pioneer 10 Doppler residuals with the anomalous acceleration taken out. After adding one more parameter to the model (a constant radial acceleration of aP = (8.74 ± 1.33) × 10−10 m/s2) the residuals are distributed about zero Doppler velocity with a systematic variation ∼ 3.0 mm/s on a time scale of ∼ 3 months [27].
Figure 6.1
Figure 6.1
A drawing for the measurement concept chosen of the Deep Space Gravity Probe (from [106], drawing courtesy of Alexandre D. Szames). The formation-flying approach relies on actively controlled spacecraft and a set of passive test-masses. The main objective is to accurately determine the heliocentric motion of the test-mass by utilizing the 2-step tracking needed for common-mode noise rejection purposes. The trajectory of the spacecraft will be determined using standard methods of radiometric tracking, while the motion of the test mass relative to the spacecraft will be established by laser ranging technology. The test mass is at an environmentally quiet distance from the craft, ≥ 250 m. With occasional maneuvers to maintain formation, the concept establishes a flexible craft to test mass formation.
Figure 7.1
Figure 7.1
Results of Markwardt’s analysis [194] show Doppler residuals as a function of time of the best fit model. The top panel shows the residuals after setting aP = 0, and demonstrates the linear increase with time. The top panel shows all of the data, including segments that were filtered out because of interference due to the solar corona (designated by a horizontal bar with “C”) or due to general noise (designated “N”). The bottom panel shows the filtered residuals, including the best fit value of the anomalous acceleration. The equivalent spacecraft velocity is also shown.
Figure 7.2
Figure 7.2
Results of Toth’s analysis [377]: a) best-fit residuals for Pioneer 10; b) best-fit residuals for Pioneer 10 with no anomalous acceleration term; c-d) same as a-b, for Pioneer 11.
Figure 7.3
Figure 7.3
Best-fit Pioneer 10 residuals using the ODYSSEY orbit determination program [179]. Left: residuals after a best-fit constant acceleration of aP = (8.40 ± 0.01) × 10−10 m/s2. Right: reconstruction of the anomalous acceleration contribution.
Figure 7.4
Figure 7.4
The four possible different directions for the Pioneer anomaly: (1) toward the Sun, (2) toward the Earth, (3) along the velocity vector, and (4) along the spin axis. These directions would offer different signal modulations [260, 391] that could be detected in the new study.
Figure 7.5
Figure 7.5
Proposed directions (along the spin and antenna axes) from the Pioneer F spacecraft (to become Pioneer 10) toward the Earth [337].
Figure 7.6
Figure 7.6
The earlier part of the Pioneer 10 trajectory before Jupiter encounter, the part of the trajectory when antenna articulation was largest [337].
Figure 7.7
Figure 7.7
A geometric model (left) of the Pioneer spacecraft, used for finite element analysis, and a photograph (right) of Pioneer 10 prior to launch. The geometric model accurately incorporates details such as the Medium Gain Antenna (MGA), the Asteroid-Meteoroid Detector, and the star sensor shade. Note that in the geometric model, the RTGs are shown in the extended position; in the photograph, the RTGs are stowed. From [171, 172].
Figure 7.8
Figure 7.8
A “work-in-progress” temperature map of the outer surface of the Pioneer 10 spacecraft body, comparing temperatures calculated via a numerical finite element method vs. temperatures measured by platform temperature (PLT) sensors and telemetered. While agreement between calculated and telemetered temperatures is expected to improve as the model is being developed, discrepancies between these values illustrate the difficulties of creating a reliable temperature map using numerical methods. (From [171, 172]).
Figure 7.9
Figure 7.9
Heat generated by RTGs (red, approximately straight line, scale on left) and electrical equipment (green, scale on right) in Pioneer 10 over the lifetime of the spacecraft.
Figure A.1
Figure A.1
Side view (above) and top view (below) of the high gain antenna, spacecraft body, and one RTG, with the boom length not to scale. Approximate measurements are in centimeters. For more accurate dimensions of the RTGs, consult Figure 2.5.
None
None

Similar articles

Cited by

References

    1. Abelson RD, Balint TS, Marshall KE, Noravian H, Randolph JE, Satter CM, Schmidt GR, Shirley JH. Enabling Exploration with Small Radioisotope Power Systems. Pasadena, CA: JPL; 2004.
    1. Abramovici A, Vager Z. Test of Newton’s second law at small accelerations. Phys. Rev. D. 1986;34:3240–3241. doi: 10.1103/PhysRevD.34.3240. - DOI - PubMed
    1. Acker RM. Pioneer F/G Feed Movement Mechanism. In: Herzl GG, editor. 6th Aerospace Mechanisms Symposium; Washington, DC: NASA; 1972. pp. 21–26.
    1. Acton CH. Ancillary data services of NASA’s Navigation and Ancillary Information Facility. Planet. Space Sci. 1996;44:65–70. doi: 10.1016/0032-0633(95)00107-7. - DOI
    1. Adamski TP. Pioneer Mission Support. Pasadena, CA: JPL; 1976. pp. 42–35.

LinkOut - more resources