

Autophagy Is Impaired in Neutrophils from Streptozotocin-Induced Diabetic Rats
- PMID: 28163707
- PMCID: PMC5247474
- DOI: 10.3389/fimmu.2017.00024
Autophagy Is Impaired in Neutrophils from Streptozotocin-Induced Diabetic Rats
Abstract
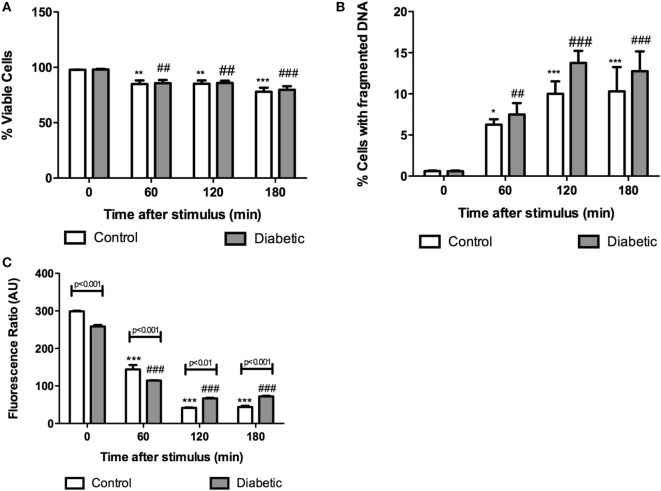
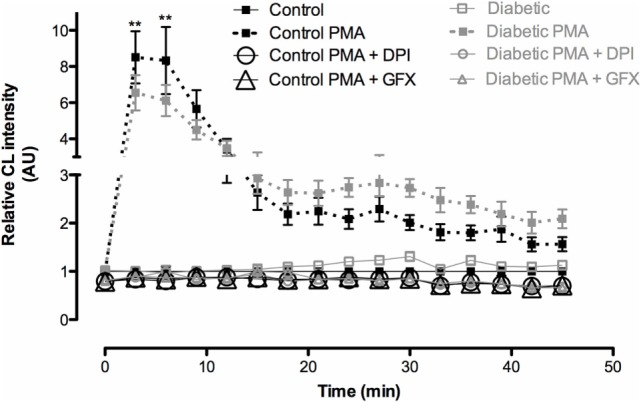
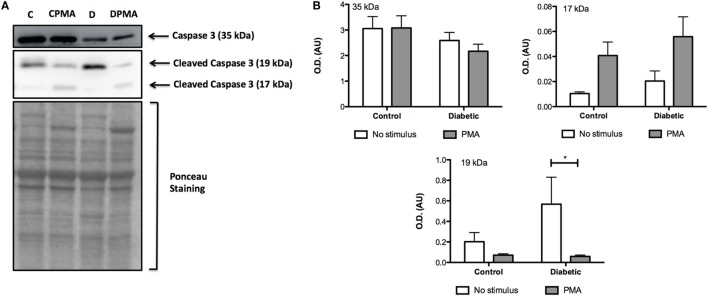
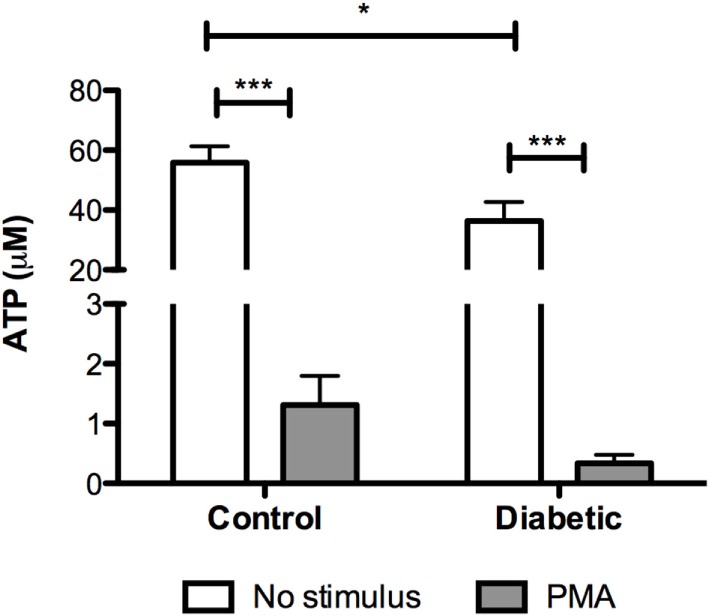
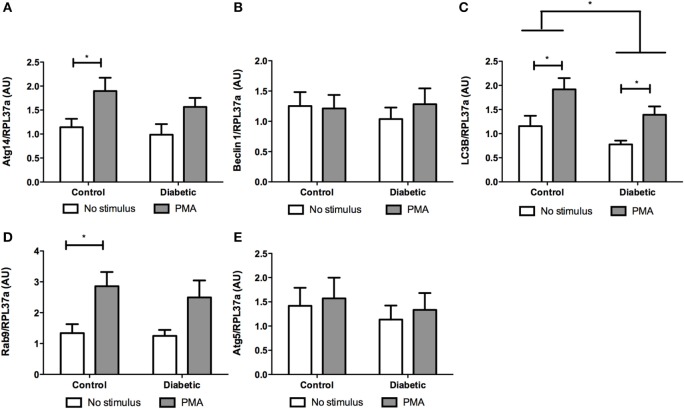
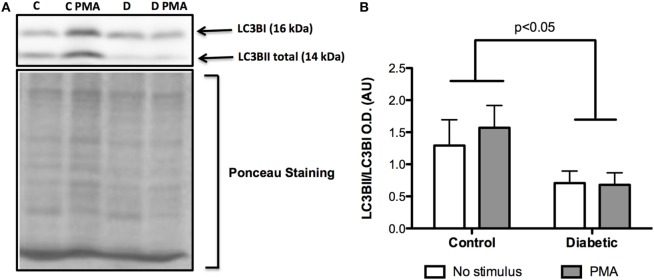
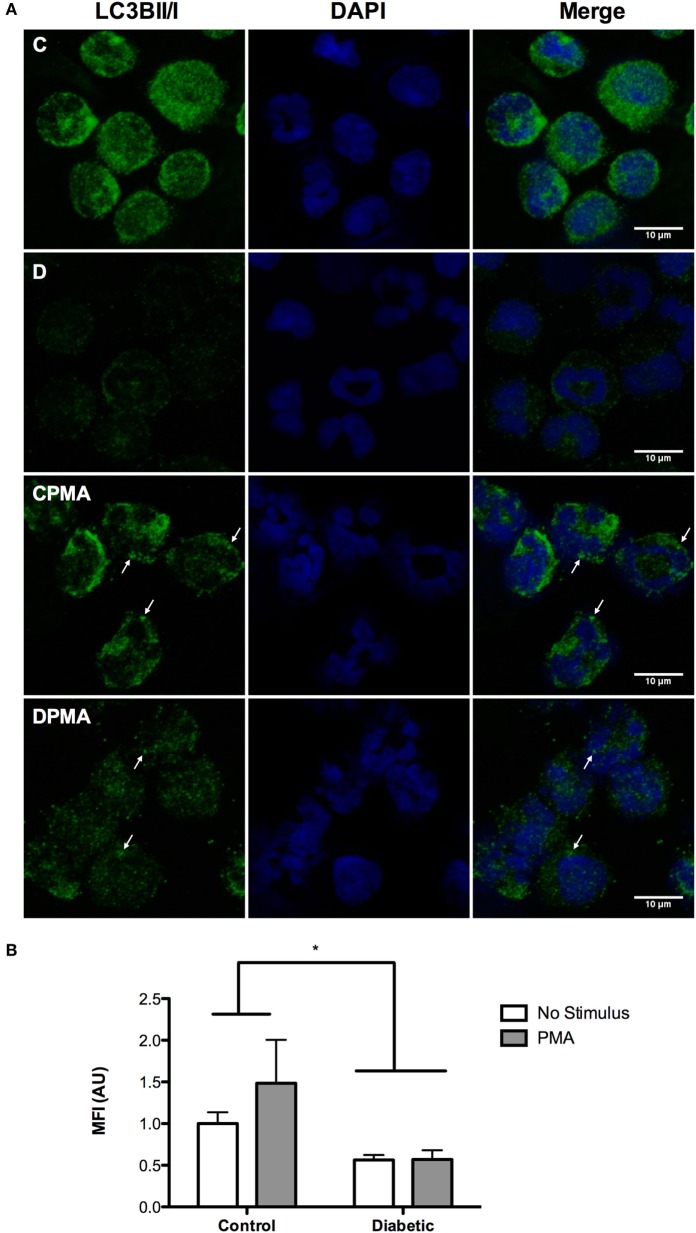
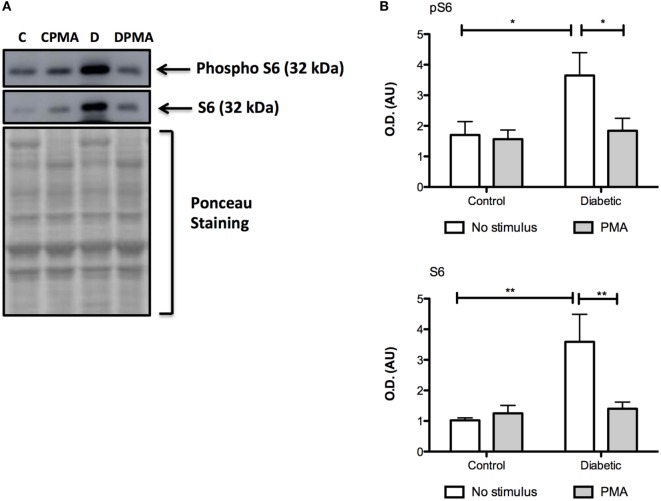
We tested the hypothesis that changes reported on functions of neutrophils from streptozotocin-induced diabetic rats involve autophagy impairment. Wistar rats were rendered diabetic by streptozotocin injection (65 mg/kg, i.v.), and the measurements were carried out 2 weeks afterward. Neutrophils were collected through intraperitoneal cavity lavage after 4 h of i.p. oyster glycogen type 2 injection. Neutrophils cultured with PMA (20 nM) for 1 h were used for analysis of plasma membrane integrity, DNA fragmentation, and mitochondrial depolarization by flow cytometry; expression of Atg5, Atg14, Beclin1, LC3BII, and Rab9 by RT-PCR; the contents of caspase 3, LC3BII/LC3BI, and pS6 by western blotting; ATP content by fluorescence essay; reactive oxygen species production by chemiluminescence (Luminol), and autophagy by immunofluorescence tracking LC3B cleavage. Herein, neutrophils from diabetic rats had high DNA fragmentation, depolarization of mitochondrial membrane, low content of ATP, and high content of cleaved caspase 3 after PMA stimulation. Neutrophils from diabetic rats also had low expression of LC3B, failed to increase the expression of Rab9 and Atg14 induced by PMA stimulation. Neutrophils from diabetic animals also had low cleavage of LC3BI to LC3BII and do not present punctate structures that label autophagosomal membranes after stimulus. The changes of neutrophil function reported in diabetic rats do involve impaired autophagy. The suppression of autophagy in neutrophils from diabetic rats may be associated with the activation of the mTOR signaling as indicated by the high content of pS6.
Keywords: autophagy; cell death and LC3B; diabetes type 1; neutrophil.
Figures
Similar articles
-
Effect of epalrestat, an aldose reductase inhibitor, on the generation of oxygen-derived free radicals in neutrophils from streptozotocin-induced diabetic rats.Endocrinology. 1998 Aug;139(8):3404-8. doi: 10.1210/endo.139.8.6152. Endocrinology. 1998. PMID: 9681489
-
Reduced ability of neutrophils to produce active oxygen species in streptozotocin-induced diabetic rats.Exp Clin Endocrinol. 1992;99(1):31-3. doi: 10.1055/s-0029-1211128. Exp Clin Endocrinol. 1992. PMID: 1385786
-
Beneficial effect of glutamine on exercise-induced apoptosis of rat neutrophils.Med Sci Sports Exerc. 2004 Feb;36(2):210-7. doi: 10.1249/01.MSS.0000113490.98089.B1. Med Sci Sports Exerc. 2004. PMID: 14767242
-
Diabetes causes marked changes in function and metabolism of rat neutrophils.J Endocrinol. 2006 Feb;188(2):295-303. doi: 10.1677/joe.1.06438. J Endocrinol. 2006. PMID: 16461555
-
Glutamine supplementation prevents exercise-induced neutrophil apoptosis and reduces p38 MAPK and JNK phosphorylation and p53 and caspase 3 expression.Cell Biochem Funct. 2007 Sep-Oct;25(5):563-9. doi: 10.1002/cbf.1421. Cell Biochem Funct. 2007. PMID: 17542038
Cited by
-
Metabolic Insight of Neutrophils in Health and Disease.Front Immunol. 2019 Sep 20;10:2099. doi: 10.3389/fimmu.2019.02099. eCollection 2019. Front Immunol. 2019. PMID: 31616403 Free PMC article. Review.
-
The emerging role for metabolism in fueling neutrophilic inflammation.Immunol Rev. 2023 Mar;314(1):427-441. doi: 10.1111/imr.13157. Epub 2022 Nov 3. Immunol Rev. 2023. PMID: 36326284 Free PMC article. Review.
-
Autophagy Induced by Palmitic Acid Regulates Neutrophil Adhesion Through the Granule-Dependent Degradation of αMβ2 Integrin in Dairy Cows With Fatty Liver.Front Immunol. 2021 Oct 7;12:726829. doi: 10.3389/fimmu.2021.726829. eCollection 2021. Front Immunol. 2021. PMID: 34691032 Free PMC article.
-
Long noncoding RNA GSEC promotes neutrophil inflammatory activation by supporting PFKFB3-involved glycolytic metabolism in sepsis.Cell Death Dis. 2021 Dec 14;12(12):1157. doi: 10.1038/s41419-021-04428-7. Cell Death Dis. 2021. PMID: 34907156 Free PMC article.
-
A metabolic perspective of the neutrophil life cycle: new avenues in immunometabolism.Front Immunol. 2024 Jan 8;14:1334205. doi: 10.3389/fimmu.2023.1334205. eCollection 2023. Front Immunol. 2024. PMID: 38259490 Free PMC article. Review.
References
-
- Tan JS, Anderson JL, Watanakunakorn C, Phair JP. Neutrophil dysfunction in diabetes mellitus. J Lab Clin Med (1975) 85:26–33. - PubMed
LinkOut - more resources
Full Text Sources
Other Literature Sources
Research Materials
Miscellaneous