. 2017 Jan 20:8:32.
doi: 10.3389/fimmu.2017.00032. eCollection 2017.

Loss of CD44dim Expression from Early Progenitor Cells Marks T-Cell Lineage Commitment in the Human Thymus

Affiliations

Loss of CD44dim Expression from Early Progenitor Cells Marks T-Cell Lineage Commitment in the Human Thymus

Kirsten Canté-Barrett et al. Front Immunol. .

Abstract

Human T-cell development is less well studied than its murine counterpart due to the lack of genetic tools and the difficulty of obtaining cells and tissues. Here, we report the transcriptional landscape of 11 immature, consecutive human T-cell developmental stages. The changes in gene expression of cultured stem cells on OP9-DL1 match those of ex vivo isolated murine and human thymocytes. These analyses led us to define evolutionary conserved gene signatures that represent pre- and post-αβ T-cell commitment stages. We found that loss of dim expression of CD44 marks human T-cell commitment in early CD7+CD5+CD45dim cells, before the acquisition of CD1a surface expression. The CD44-CD1a- post-committed thymocytes have initiated in frame T-cell receptor rearrangements that are accompanied by loss of capacity to differentiate toward myeloid, B- and NK-lineages, unlike uncommitted CD44dimCD1a- thymocytes. Therefore, loss of CD44 represents a previously unrecognized human thymocyte stage that defines the earliest committed T-cell population in the thymus.

Keywords: CD44; OP9-DL1; T-cell commitment; gene expression; human T-cell development; multi-lineage potential; thymus.


Figures
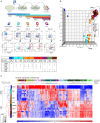
Figure 1
Figure 1
Consecutive stages of human early in vitro T-cell differentiation represent two major gene signatures. (A) Schematic representation of the OP9-DL1 coculture with the sorting strategy of consecutive T-cell differentiation stages. The table displays the sorted populations (and the replicates, from a total of five cocultures) based on surface markers (CD45, CD34, CD7, CD5, CD1a, CD4, CD8) and number of days in coculture. All populations were also gated for CD45+GFP to exclude OP9-DL1 cells that are GFP positive. (B) Principal component analysis of 29 samples based on the 2,179 probesets with high variance (top 5%) and log2 expression values (>8). These probesets were summarized into 1,387 genes by taking the median of all probesets across a gene. UCB-derived CD34+ stem cells (dark blue, upper left corner), an early, and a late population can be distinguished. (C) Hierarchical clustering analysis using 1,387 genes (see Table S1 in Supplementary Material). Pearson dissimilarity measure and average linkage were applied to cluster the samples, and Euclidean distance and Ward’s method were applied to define 16 distinct gene signatures with similar expression patterns. (D) Average expression pattern of genes in the 16 gene signatures; some example genes are displayed. z-scores are on the y-axis and 29 populations on the x-axis, ordered according to Figure 1C. The gray area represents 1SD. (E) Gene set enrichment analysis on the in vitro T-cell differentiation dataset to select gene signatures that are significantly enriched in the early or late T-cell program (marked in green and bold). The Normalized Enrichment Score (NES) and false discovery rate (FDR) q-value for each gene signature are given on top of each sub-figure. Populations belonging to the early/late T-cell program were determined according to Figure 1C. Gene sets with FDR q ≤ 0.25 were considered significantly correlated to the class distinction (22).
Figure 1
Figure 1
Consecutive stages of human early in vitro T-cell differentiation represent two major gene signatures. (A) Schematic representation of the OP9-DL1 coculture with the sorting strategy of consecutive T-cell differentiation stages. The table displays the sorted populations (and the replicates, from a total of five cocultures) based on surface markers (CD45, CD34, CD7, CD5, CD1a, CD4, CD8) and number of days in coculture. All populations were also gated for CD45+GFP to exclude OP9-DL1 cells that are GFP positive. (B) Principal component analysis of 29 samples based on the 2,179 probesets with high variance (top 5%) and log2 expression values (>8). These probesets were summarized into 1,387 genes by taking the median of all probesets across a gene. UCB-derived CD34+ stem cells (dark blue, upper left corner), an early, and a late population can be distinguished. (C) Hierarchical clustering analysis using 1,387 genes (see Table S1 in Supplementary Material). Pearson dissimilarity measure and average linkage were applied to cluster the samples, and Euclidean distance and Ward’s method were applied to define 16 distinct gene signatures with similar expression patterns. (D) Average expression pattern of genes in the 16 gene signatures; some example genes are displayed. z-scores are on the y-axis and 29 populations on the x-axis, ordered according to Figure 1C. The gray area represents 1SD. (E) Gene set enrichment analysis on the in vitro T-cell differentiation dataset to select gene signatures that are significantly enriched in the early or late T-cell program (marked in green and bold). The Normalized Enrichment Score (NES) and false discovery rate (FDR) q-value for each gene signature are given on top of each sub-figure. Populations belonging to the early/late T-cell program were determined according to Figure 1C. Gene sets with FDR q ≤ 0.25 were considered significantly correlated to the class distinction (22).
Figure 2
Figure 2
The in vitro gene expression signatures recapitulate in vivo signatures of pre- and post-T-cell committed thymocytes. (A) Gene set enrichment analysis of our in vitro gene signature on the gene expression dataset of consecutive T-cell development populations from murine thymi (see Table S2 in Supplementary Material). The first and second sub-figures from the left are the analysis results using gene signatures #7 and #8. The Normalized Enrichment Score (NES), Nominal p-value, and false discovery rate q-value indicate that these two gene signatures correlate with the pre-commitment stages. Also shown in the first sub-figure is the list of top 10 input genes with the highest signal-to-noise ratios in this dataset. The third and fourth sub-figures are the same analysis for gene signatures #2, #15, and #16, which correlate with the post-commitment stages. (B) Hierarchical clustering (Euclidean distance and Ward’s method) on human thymocyte populations was performed using 399 out of the 547 in vitro pre-/post-commitment signature genes (see Table S3 in Supplementary Material); the remaining 148 genes were not profiled because they were not on the HG-U133A array used in the dataset in Ref. (16). The dendrogram on the left shows the clustering of different sorted human thymocytes, separating the pre- and post-committed populations.
Figure 3
Figure 3
Loss of CD44 surface expression marks T-cell commitment in vitro. (A) Sorting strategy for isolating T-cell differentiation stages A–F from duplicate (n = 2) 12- and 18-day cocultures started with pooled CD34+ hematopoietic stem cells, based on surface markers CD45, CD34, CD7, CD5, CD1a, and CD44. (B) Hierarchical clustering (Pearson average) of sorted populations A–F using 47 selected T-cell development genes. Expression values were obtained by Taqman array microfluidic cards, followed by ANOVA to remove day and pool effects.
Figure 4
Figure 4
CD45bright are mature and CD45dim are immature human thymocytes, correlating with the intensity of CD44 expression. Human thymocytes were thawed and stained directly (A) or after CD3, CD4, and CD8 (partial) depletion of ~95% of all thymocytes (B) with various antibodies as indicated.
Figure 5
Figure 5
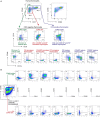
Loss of CD44 surface expression marks T-cell commitment in early human thymocytes. (A) Sorting strategy for isolating T-cell developmental stages I–III from four independent donors (n = 4), based on CD45, CD7, CD5, CD1a, and CD44 after pre-depletion of CD3-, CD4-, CD8-, and CD19-expressing thymocytes. (B) Hierarchical clustering (Pearson average) of sorted populations I–III using 47 selected T-cell development genes. Expression values were obtained by Taqman array microfluidic cards, followed by quantile normalization.
Figure 6
Figure 6
Loss of CD44 functionally marks human T-cell commitment. (A) GeneScan visualization of in-frame Dβ–Jβ (left column) and Vβ–Jβ (middle and right columns) gene rearrangements, determined using the BIOMED-2 multiplex PCR (19). One representative example of three independent donors is shown. Healthy peripheral blood mononuclear cells were used as a positive, polyclonal control (top row); populations I–III are indicated (rows 2–4). Primers for the Jβ1 cluster were hexachloro-6-carboxy-fluorescein-labeled (blue traces), and primers for the Jβ2 cluster were 6-carboxy-fluorescein (FAM)-labeled (green traces). Red traces: internal size markers. (B) Flow cytometry analysis of sorted human thymocyte populations I–III after 10 days of coculture on OP9-DL1:GFP mixed cells. Differentiation into various hematopoietic lineages is defined as follows: T-lineage (blue): CD5+CD1a+, NK-lineage (red): CD56+CD94+, B-lineage (yellow): CD19+, myeloid lineage (green): CD33+. During differentiation, all populations remain CD45+ and CD7+. (C) Absolute cell numbers ± SD of each differentiated and proliferated hematopoietic lineage from a representative of three experiments, after 10 days of coculture on a layer of OP9-DL1, a 1:1 mix, or OP9-GFP (ctrl.) cells. The number of cells from populations I–III used to initiate the cocultures on day 0 was 4,000 cells/well, indicated by the dashed horizontal line.
Figure 7
Figure 7
Schematic comparison of human and mouse early T-cell development in the thymus. Bone marrow-derived lymphoid progenitors enter the thymus (depicted as a blue oval) and exhibit dim CD44 expression. T-cell commitment is marked by the downregulation of CD44. As cells mature, they regain CD44 expression.

Similar articles

Cited by

References

    1. Rothenberg EV, Moore JE, Yui MA. Launching the T-cell-lineage developmental programme. Nat Rev Immunol (2008) 8(1):9–21.10.1038/nri2232 - DOI - PMC - PubMed
    1. Zhang JA, Mortazavi A, Williams BA, Wold BJ, Rothenberg EV. Dynamic transformations of genome-wide epigenetic marking and transcriptional control establish T cell identity. Cell (2012) 149(2):467–82.10.1016/j.cell.2012.01.056 - DOI - PMC - PubMed
    1. Plum J, De Smedt M, Defresne MP, Leclercq G, Vandekerckhove B. Human CD34+ fetal liver stem cells differentiate to T cells in a mouse thymic microenvironment. Blood (1994) 84(5):1587–93. - PubMed
    1. Schmitt TM, Zuniga-Pflucker JC. Induction of T cell development from hematopoietic progenitor cells by delta-like-1 in vitro. Immunity (2002) 17(6):749–56.10.1016/S1074-7613(02)00474-0 - DOI - PubMed
    1. Yoshida H, Hayashi S, Kunisada T, Ogawa M, Nishikawa S, Okamura H, et al. The murine mutation osteopetrosis is in the coding region of the macrophage colony stimulating factor gene. Nature (1990) 345(6274):442–4.10.1038/345442a0 - DOI - PubMed