

Mitochondrial mutations and metabolic adaptation in pancreatic cancer
- PMID: 28163917
- PMCID: PMC5282905
- DOI: 10.1186/s40170-017-0164-1
Mitochondrial mutations and metabolic adaptation in pancreatic cancer
Abstract
Background: Pancreatic cancer has a five-year survival rate of ~8%, with characteristic molecular heterogeneity and restricted treatment options. Targeting metabolism has emerged as a potentially effective therapeutic strategy for cancers such as pancreatic cancer, which are driven by genetic alterations that are not tractable drug targets. Although somatic mitochondrial genome (mtDNA) mutations have been observed in various tumors types, understanding of metabolic genotype-phenotype relationships is limited.
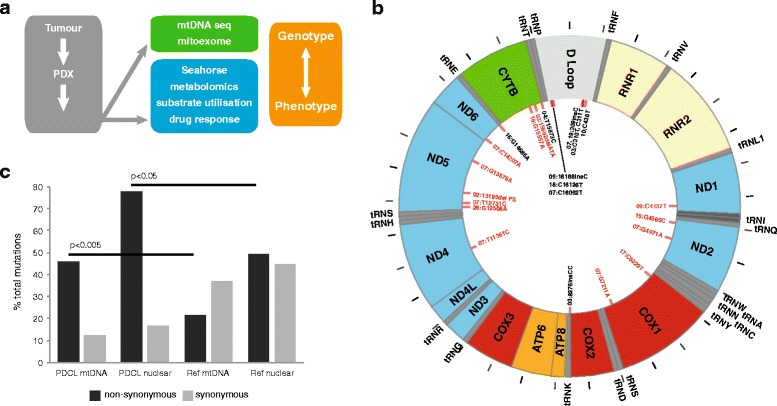
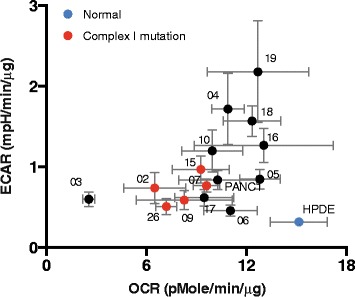
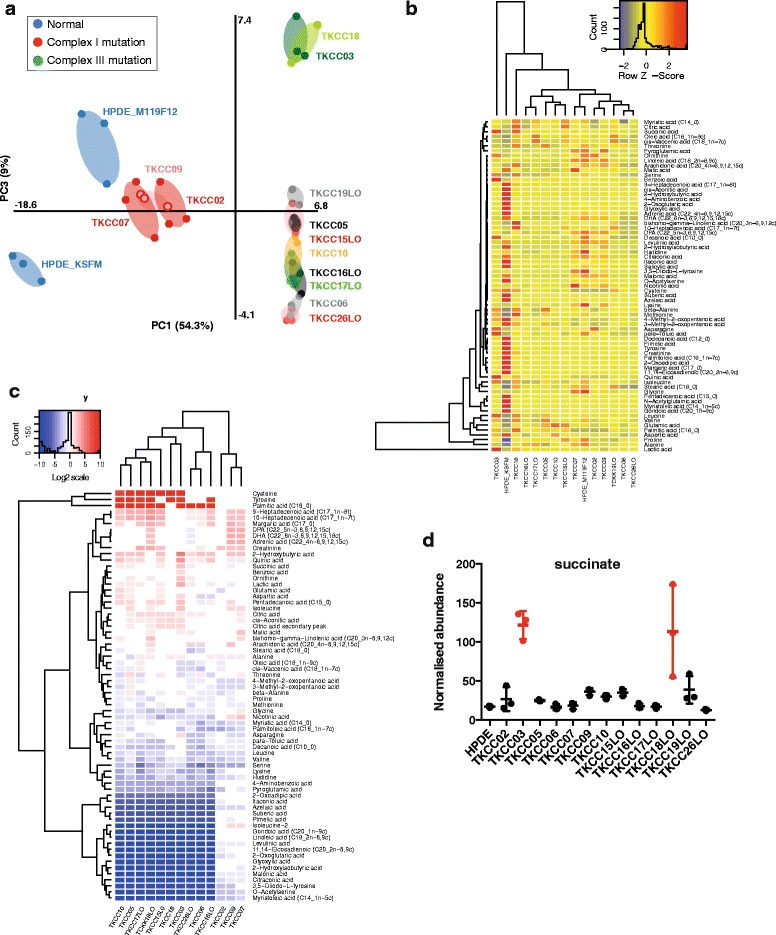
Methods: We deployed an integrated approach combining genomics, metabolomics, and phenotypic analysis on a unique cohort of patient-derived pancreatic cancer cell lines (PDCLs). Genome analysis was performed via targeted sequencing of the mitochondrial genome (mtDNA) and nuclear genes encoding mitochondrial components and metabolic genes. Phenotypic characterization of PDCLs included measurement of cellular oxygen consumption rate (OCR) and extracellular acidification rate (ECAR) using a Seahorse XF extracellular flux analyser, targeted metabolomics and pathway profiling, and radiolabelled glutamine tracing.
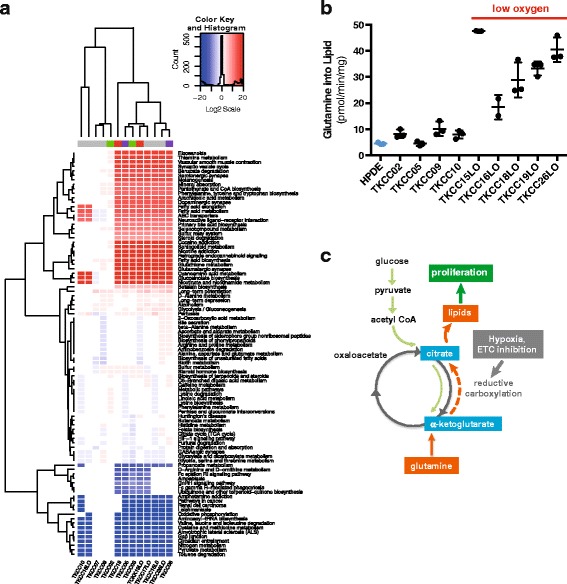
Results: We identified 24 somatic mutations in the mtDNA of 12 patient-derived pancreatic cancer cell lines (PDCLs). A further 18 mutations were identified in a targeted study of ~1000 nuclear genes important for mitochondrial function and metabolism. Comparison with reference datasets indicated a strong selection bias for non-synonymous mutants with predicted functional effects. Phenotypic analysis showed metabolic changes consistent with mitochondrial dysfunction, including reduced oxygen consumption and increased glycolysis. Metabolomics and radiolabeled substrate tracing indicated the initiation of reductive glutamine metabolism and lipid synthesis in tumours.
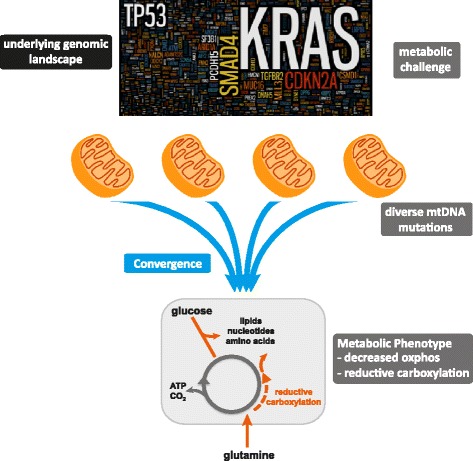
Conclusions: The heterogeneous genomic landscape of pancreatic tumours may converge on a common metabolic phenotype, with individual tumours adapting to increased anabolic demands via different genetic mechanisms. Targeting resulting metabolic phenotypes may be a productive therapeutic strategy.
Keywords: Genome; Glutamine; Lipid; Metabolomics; Mitochondria; Pancreas.
Figures
Similar articles
-
Measurement of Oxygen Consumption Rate (OCR) and Extracellular Acidification Rate (ECAR) in Culture Cells for Assessment of the Energy Metabolism.Bio Protoc. 2018 May 20;8(10):e2850. doi: 10.21769/BioProtoc.2850. eCollection 2018 May 20. Bio Protoc. 2018. PMID: 34285967 Free PMC article.
-
Studying the Metabolism of Epithelial-Mesenchymal Plasticity Using the Seahorse XFe96 Extracellular Flux Analyzer.Methods Mol Biol. 2021;2179:327-340. doi: 10.1007/978-1-0716-0779-4_25. Methods Mol Biol. 2021. PMID: 32939731
-
Rubella Viruses Shift Cellular Bioenergetics to a More Oxidative and Glycolytic Phenotype with a Strain-Specific Requirement for Glutamine.J Virol. 2018 Aug 16;92(17):e00934-18. doi: 10.1128/JVI.00934-18. Print 2018 Sep 1. J Virol. 2018. PMID: 29950419 Free PMC article.
-
Mitochondrial DNA Alterations in Glioblastoma and Current Therapeutic Targets.Front Biosci (Landmark Ed). 2024 Oct 23;29(10):367. doi: 10.31083/j.fbl2910367. Front Biosci (Landmark Ed). 2024. PMID: 39473421 Review.
-
Mitochondrial determinants of cancer health disparities.Semin Cancer Biol. 2017 Dec;47:125-146. doi: 10.1016/j.semcancer.2017.05.001. Epub 2017 May 6. Semin Cancer Biol. 2017. PMID: 28487205 Free PMC article. Review.
Cited by
-
Metabolic Regulation of Epithelial to Mesenchymal Transition: Implications for Endocrine Cancer.Front Endocrinol (Lausanne). 2019 Nov 26;10:773. doi: 10.3389/fendo.2019.00773. eCollection 2019. Front Endocrinol (Lausanne). 2019. PMID: 31849832 Free PMC article. Review.
-
Biological and Clinical Impacts of Glucose Metabolism in Pancreatic Ductal Adenocarcinoma.Cancers (Basel). 2023 Jan 13;15(2):498. doi: 10.3390/cancers15020498. Cancers (Basel). 2023. PMID: 36672448 Free PMC article. Review.
-
ClinGen Cancer Somatic Working Group - standardizing and democratizing access to cancer molecular diagnostic data to drive translational research.Pac Symp Biocomput. 2018;23:247-258. Pac Symp Biocomput. 2018. PMID: 29218886 Free PMC article.
-
Rewiring carbohydrate catabolism differentially affects survival of pancreatic cancer cell lines with diverse metabolic profiles.Oncotarget. 2017 Jun 20;8(25):41265-41281. doi: 10.18632/oncotarget.17172. Oncotarget. 2017. PMID: 28476035 Free PMC article.
-
KRAS, A Prime Mediator in Pancreatic Lipid Synthesis through Extra Mitochondrial Glutamine and Citrate Metabolism.Int J Mol Sci. 2021 May 11;22(10):5070. doi: 10.3390/ijms22105070. Int J Mol Sci. 2021. PMID: 34064761 Free PMC article. Review.
References
-
- Hruban RH, Goggins M, Parsons J, Kern SE. Progression model for pancreatic cancer. Clin Cancer Res. 2000;6(8):2969–72. - PubMed
Grants and funding
LinkOut - more resources
Full Text Sources
Other Literature Sources
