

Dual inhibition of Akt and c-Met as a second-line therapy following acquired resistance to sorafenib in hepatocellular carcinoma cells
- PMID: 28164434
- PMCID: PMC5527443
- DOI: 10.1002/1878-0261.12039
Dual inhibition of Akt and c-Met as a second-line therapy following acquired resistance to sorafenib in hepatocellular carcinoma cells
Abstract
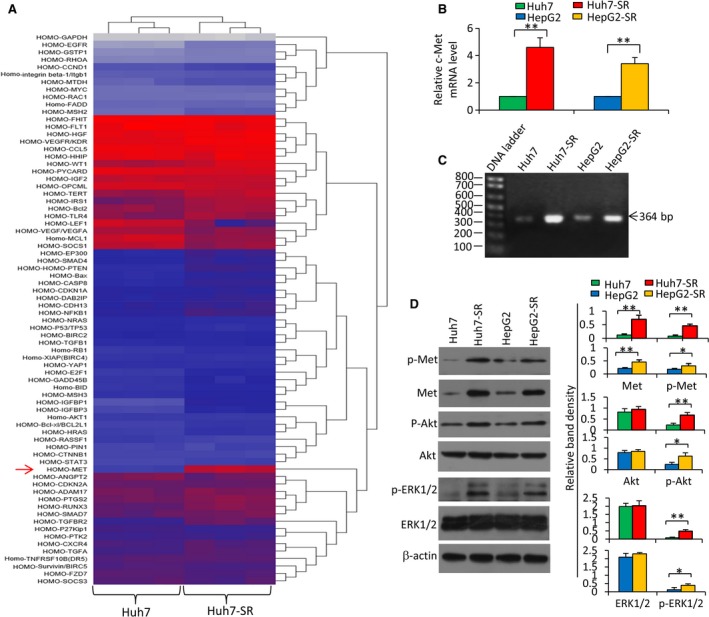
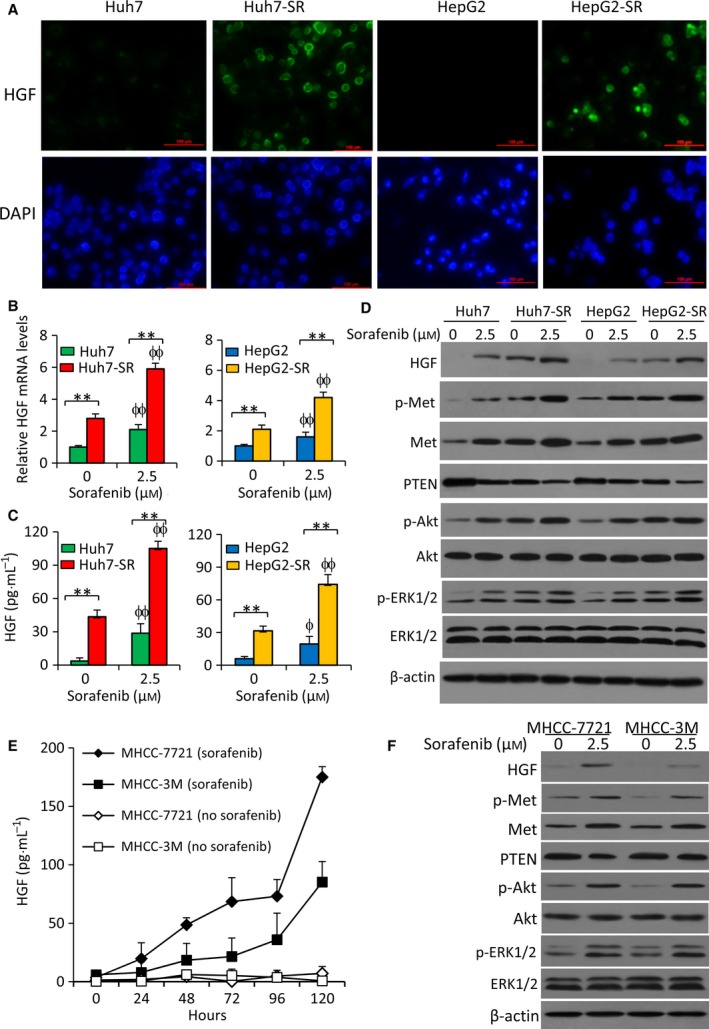
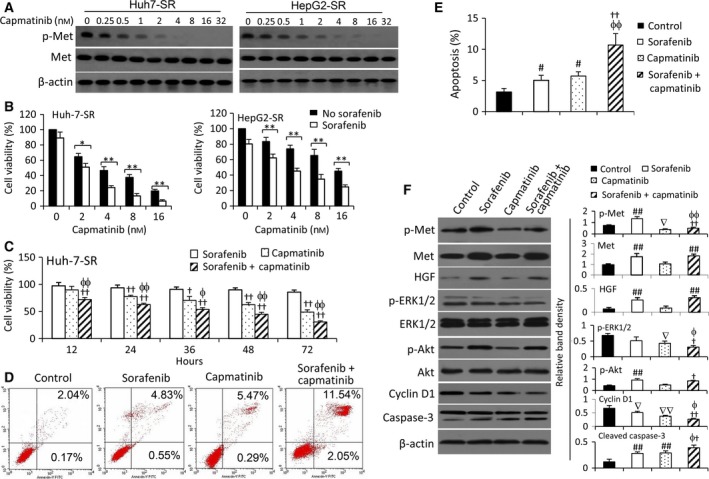
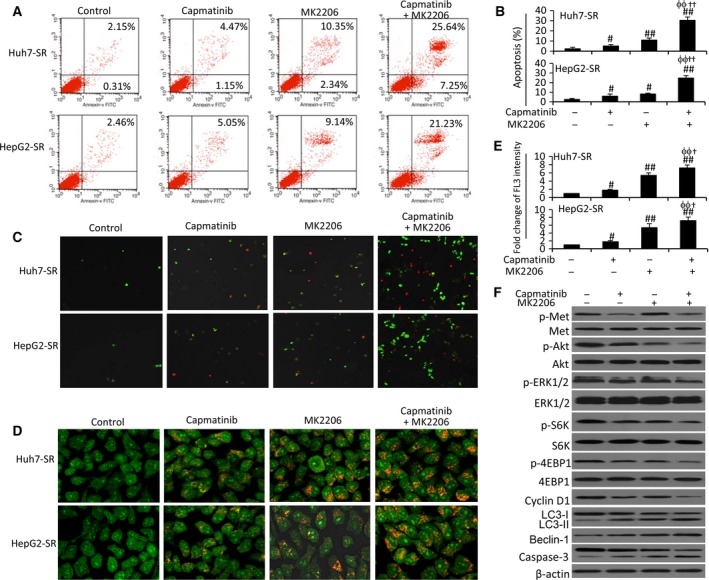
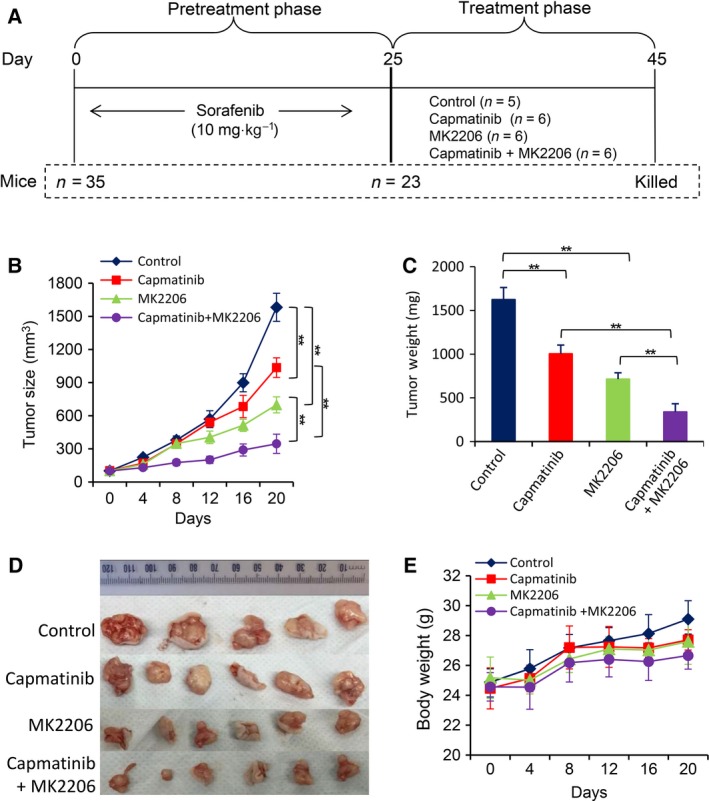
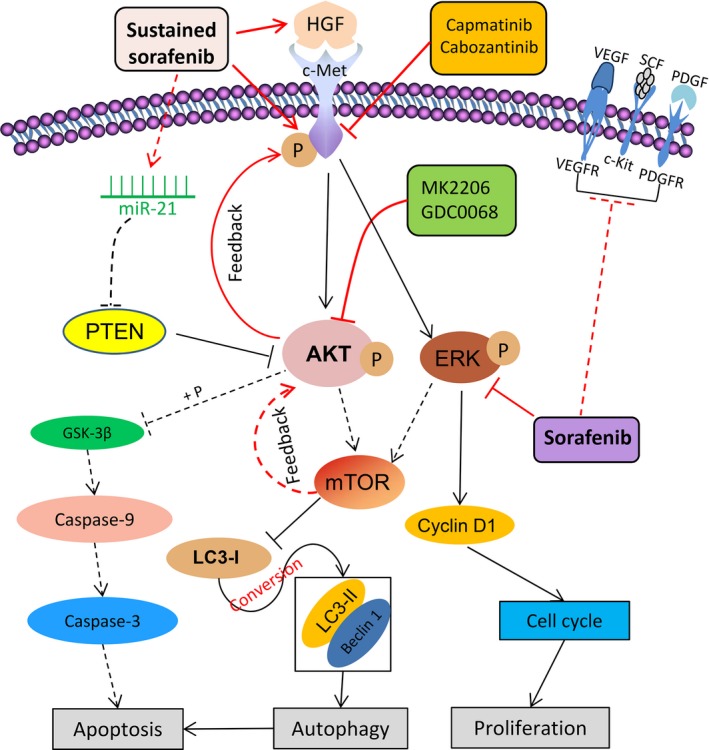
Sorafenib displays a limited efficacy for advanced hepatocellular carcinoma (HCC). Some patients with HCC initially respond to sorafenib, but eventually succumb to the disease, indicating that the acquired resistance to sorafenib reduces its beneficial effects. No alternative drugs are available after the failure of sorafenib therapy. Therefore, investigation of the mechanisms underlying the acquired resistance and development of second-line treatments for sorafenib-resistant HCC are urgently required. In this study, sorafenib-resistant HCC cells generated from sorafenib-sensitive human HCC cells were shown to overproduce hepatocyte growth factor (HGF) and overexpress c-Met kinase and its phosphorylated form, leading to the activation of Akt and ERK (extracellular signaling-regulated kinase) pathways. Use of specific c-Met inhibitors enhanced the effects of sorafenib by inhibiting the growth of sorafenib-resistant HCC cells. Akt inhibitors, a class of second-line therapeutic drugs under investigation for treating HCC in clinical trials, enhanced the effects of sorafenib, but also activated the c-Met pathway in sorafenib-resistant cells. Dual inhibition of Akt and c-Met by their respective inhibitors, MK2206 and capmatinib, additively or synergistically suppressed sorafenib-resistant HCC cells in vitro and sorafenib-resistant HCC xenografts in mice. The anticancer activities of MK2206 mainly rely on its ability to induce cell apoptosis and autophagic death, while capmatinib treatment leads to cell cycle arrest at phase G1. These results provide strong evidence for further investigation on the clinical utility of dual inhibition of Akt and c-Met, particularly MK2206 and capmatinib, as a second-line therapy for advanced HCC that has acquired resistance to sorafenib.
Keywords: Akt; acquired resistance; c-Met; cellular signaling pathway; hepatocellular carcinoma; sorafenib.
© 2017 The Authors. Published by FEBS Press and John Wiley & Sons Ltd.
Figures

Similar articles
-
MiR-21 mediates sorafenib resistance of hepatocellular carcinoma cells by inhibiting autophagy via the PTEN/Akt pathway.Oncotarget. 2015 Oct 6;6(30):28867-81. doi: 10.18632/oncotarget.4814. Oncotarget. 2015. PMID: 26311740 Free PMC article.
-
MK2206 overcomes the resistance of human liver cancer stem cells to sorafenib by inhibition of pAkt and upregulation of pERK.Tumour Biol. 2016 Jun;37(6):8047-55. doi: 10.1007/s13277-015-4707-1. Epub 2015 Dec 28. Tumour Biol. 2016. PMID: 26711788
-
Bufalin Reverses Resistance to Sorafenib by Inhibiting Akt Activation in Hepatocellular Carcinoma: The Role of Endoplasmic Reticulum Stress.PLoS One. 2015 Sep 18;10(9):e0138485. doi: 10.1371/journal.pone.0138485. eCollection 2015. PLoS One. 2015. PMID: 26381511 Free PMC article.
-
Met as a therapeutic target in HCC: facts and hopes.J Hepatol. 2014 Feb;60(2):442-52. doi: 10.1016/j.jhep.2013.09.009. Epub 2013 Sep 14. J Hepatol. 2014. PMID: 24045150 Review.
-
Deregulation of signaling pathways involved in sorafenib resistance of hepatocellular carcinoma.Klin Lab Diagn. 2013 Oct;(10):66-8, 34-7. Klin Lab Diagn. 2013. PMID: 24640100 Review. English, Russian.
Cited by
-
BEZ235 increases sorafenib inhibition of hepatocellular carcinoma cells by suppressing the PI3K/AKT/mTOR pathway.Am J Transl Res. 2019 Sep 15;11(9):5573-5585. eCollection 2019. Am J Transl Res. 2019. PMID: 31632530 Free PMC article.
-
AXL and MET in Hepatocellular Carcinoma: A Systematic Literature Review.Liver Cancer. 2022 Feb 10;11(2):94-112. doi: 10.1159/000520501. eCollection 2022 Apr. Liver Cancer. 2022. PMID: 35634427 Free PMC article. Review.
-
M2 macrophages mediate sorafenib resistance by secreting HGF in a feed-forward manner in hepatocellular carcinoma.Br J Cancer. 2019 Jul;121(1):22-33. doi: 10.1038/s41416-019-0482-x. Epub 2019 May 27. Br J Cancer. 2019. PMID: 31130723 Free PMC article.
-
FoxM1 promotes epithelial-mesenchymal transition, invasion, and migration of tongue squamous cell carcinoma cells through a c-Met/AKT-dependent positive feedback loop.Anticancer Drugs. 2018 Mar;29(3):216-226. doi: 10.1097/CAD.0000000000000585. Anticancer Drugs. 2018. PMID: 29360662 Free PMC article.
-
Activation of c-Met in cancer cells mediates growth-promoting signals against oxidative stress through Nrf2-HO-1.Oncogenesis. 2019 Jan 15;8(2):7. doi: 10.1038/s41389-018-0116-9. Oncogenesis. 2019. PMID: 30647407 Free PMC article.
References
-
- Aksamitiene E, Kiyatkin A and Kholodenko BN (2012) Cross‐talk between mitogenic Ras/MAPK and survival PI3K/Akt pathways: a fine balance. Biochem Soc Trans 40, 139–146. - PubMed
-
- Ang C, O'Reilly EM and Abou‐Alfa GK (2013) Targeted agents and systemic therapy in hepatocellular carcinoma. Recent results in cancer research. Fortschritte der Krebsforschung. Progres dans les recherches sur le cancer 190, 225–246. - PubMed
-
- Berasain C (2013) Hepatocellular carcinoma and sorafenib: too many resistance mechanisms? Gut 62, 1674–1675. - PubMed
-
- Bruix J, Reig M and Sherman M (2016) Evidence‐based diagnosis, staging, and treatment of patients with hepatocellular carcinoma. Gastroenterology 150, 835–853. - PubMed
MeSH terms
Substances
Associated data
- Actions
- Actions
LinkOut - more resources
Full Text Sources
Other Literature Sources
Medical
Miscellaneous
