. 2017 Feb 6:8:14360.
doi: 10.1038/ncomms14360.

FAK signalling controls insulin sensitivity through regulation of adipocyte survival

Affiliations

FAK signalling controls insulin sensitivity through regulation of adipocyte survival

Cynthia T Luk et al. Nat Commun. .

Abstract

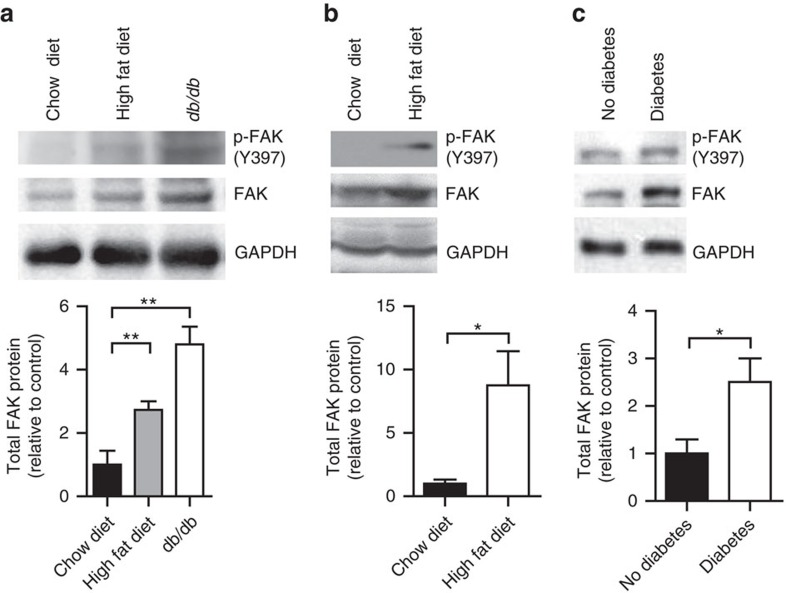
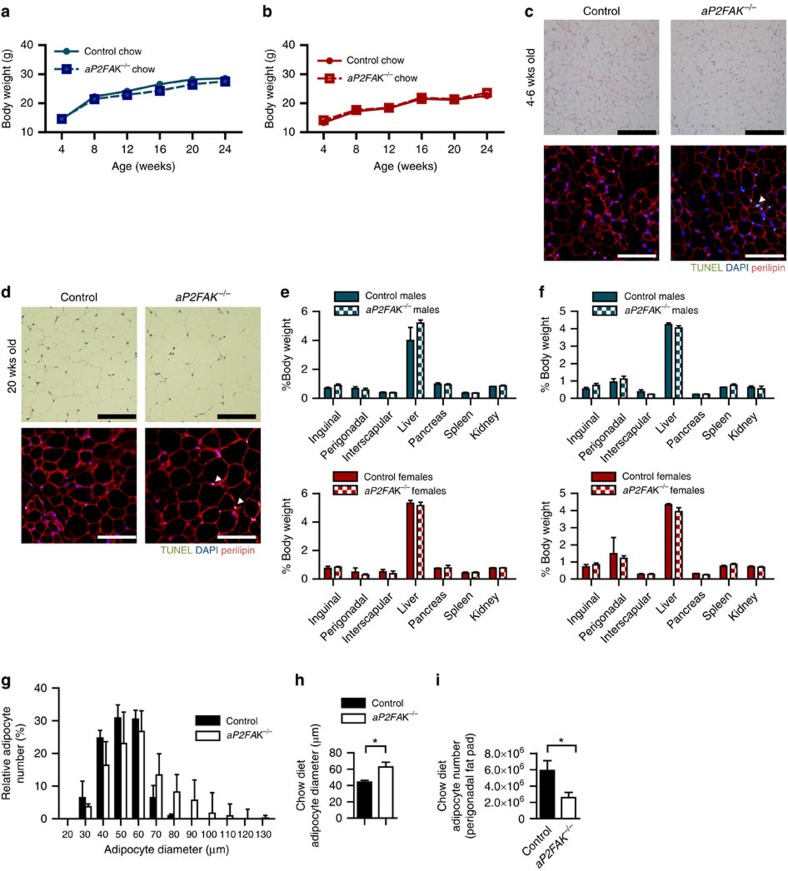
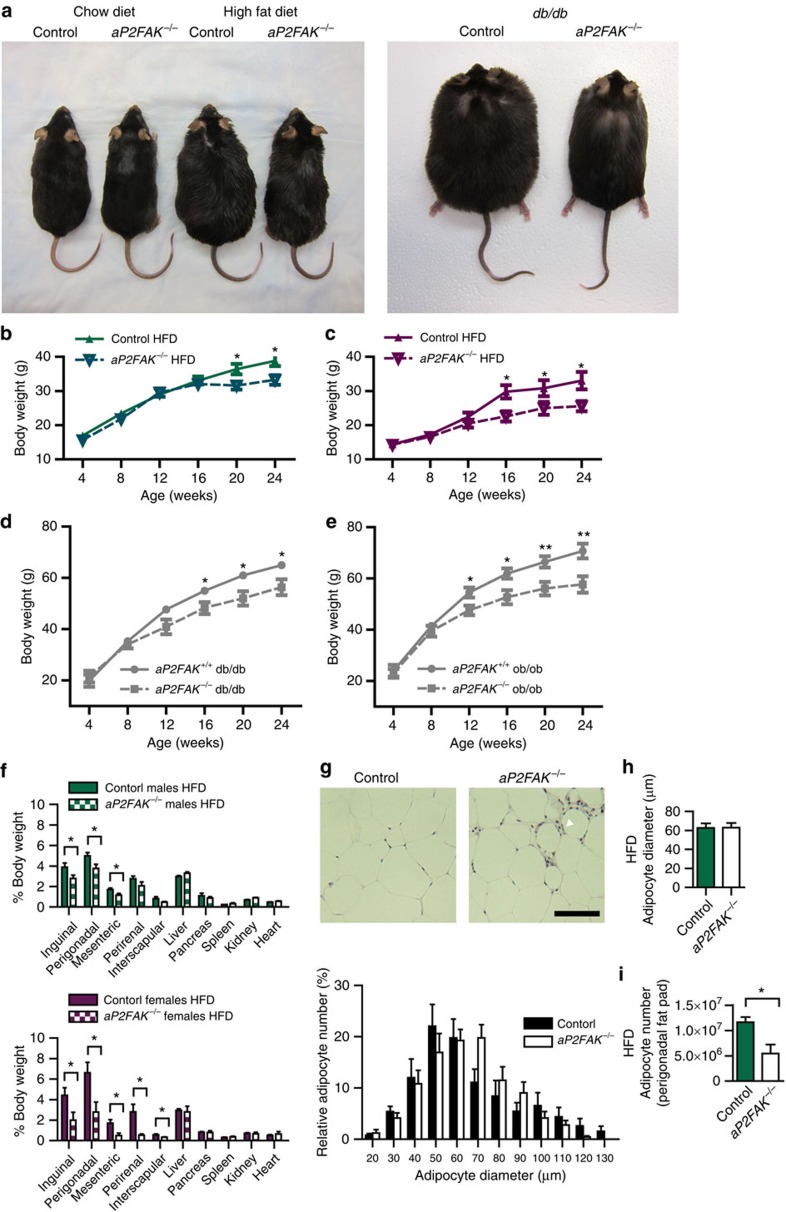
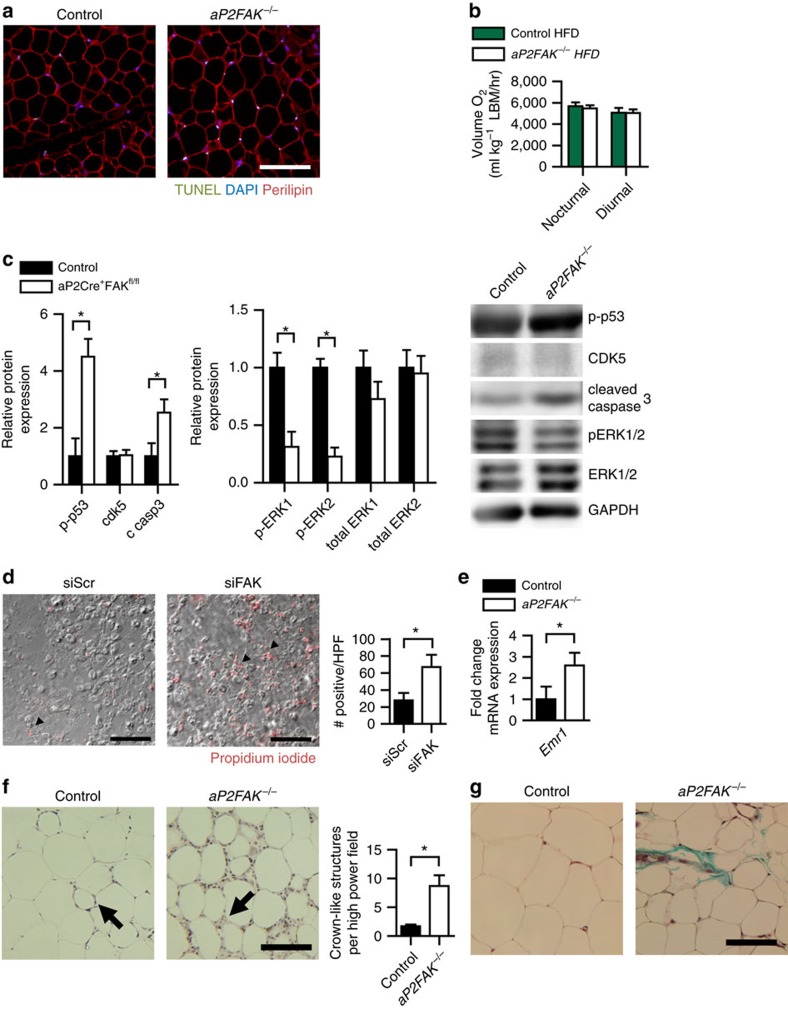
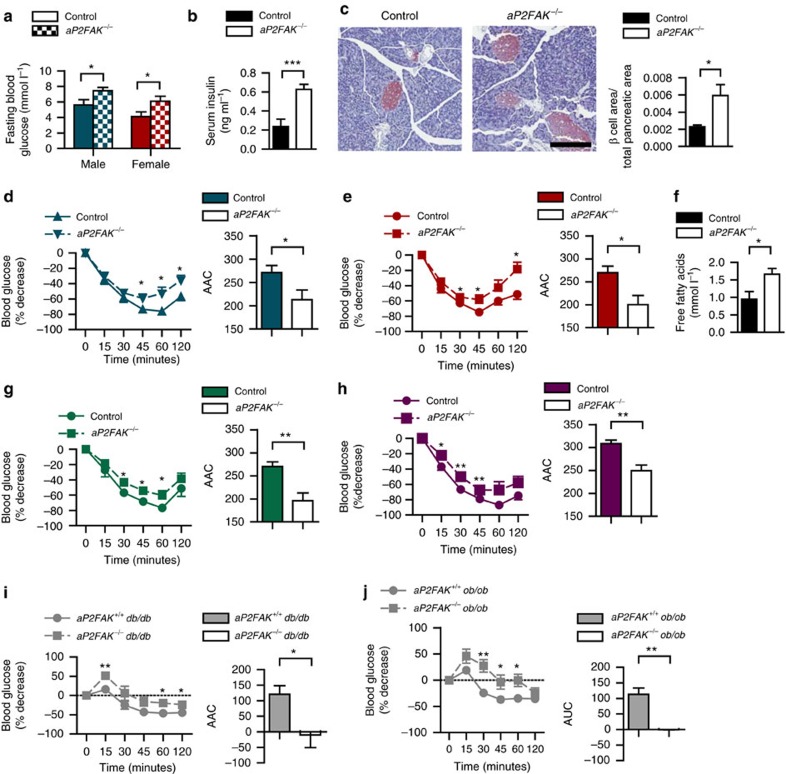
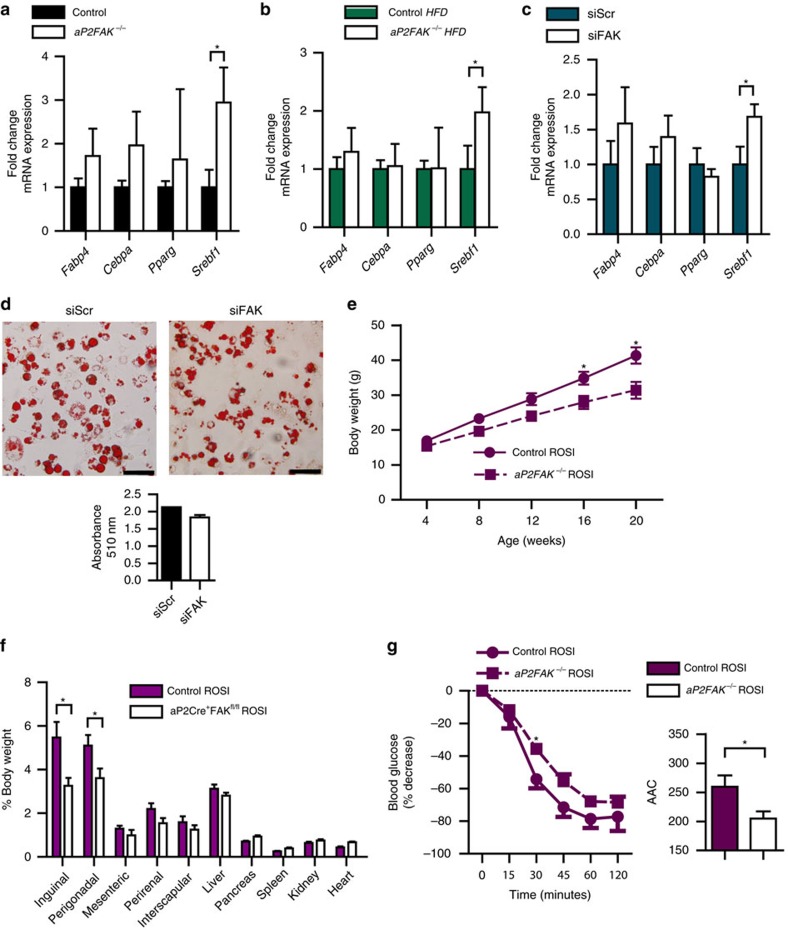
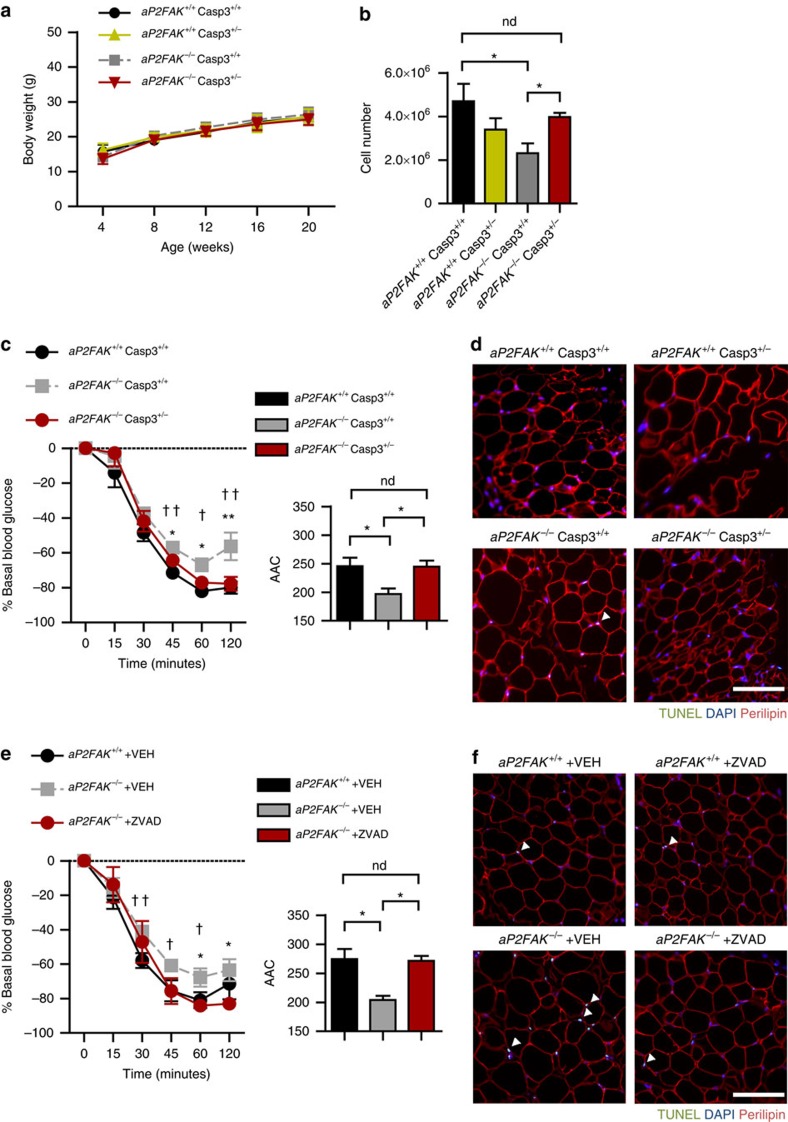
Focal adhesion kinase (FAK) plays a central role in integrin signalling, which regulates growth and survival of tumours. Here we show that FAK protein levels are increased in adipose tissue of insulin-resistant obese mice and humans. Disruption of adipocyte FAK in mice or in 3T3 L1 cells decreases adipocyte survival. Adipocyte-specific FAK knockout mice display impaired adipose tissue expansion and insulin resistance on prolonged metabolic stress from a high-fat diet or when crossed on an obese db/db or ob/ob genetic background. Treatment of these mice with a PPARγ agonist does not restore adiposity or improve insulin sensitivity. In contrast, inhibition of apoptosis, either genetically or pharmacologically, attenuates adipocyte death, restores normal adiposity and improves insulin sensitivity. Together, these results demonstrate that FAK is required for adipocyte survival and maintenance of insulin sensitivity, particularly in the context of adipose tissue expansion as a result of caloric excess.


Conflict of interest statement

The authors declare no competing financial interests.

Figures

Figure 1
Figure 1. FAK increases in adipose tissue with obesity and insulin resistance.
(a,b) Representative blot and quantification of FAK protein in adipocytes isolated from perigonadal WAT (n=4 mice) (a) and interscapular BAT (n=5 mice) (b) of 20-week-old mice fed HFD or db/db mice relative to chow diet-fed mice. (c) Representative blot and quantification of FAK in protein lysates from omental adipocytes of humans with and without type 2 diabetes (DM) (n=3 humans). Data are mean±s.e.m. *P<0.05 and **P<0.01 by Student's t-test.
Figure 2
Figure 2. FAK is required for adipocyte survival.
(a,b) Body weight in male (a) and female (b) littermate control or aP2FAK−/− mice fed chow diet (n=10). (c,d) Representative haematoxylin and eosin (H&E) and TUNEL of perigonadal WAT sections from 4- to 6-week-old mice (n=3 mice) (c) and 20-week-old mice (n=4 mice) (d) (black scale bar, 100 μm; white scale bar, 100 μm, arrows indicate positive nuclei). (e,f) Body composition expressed as per cent total body weight in 4- to 6-week- (n=5) (e) and 20-week-old (f) male (blue) and female (red) mice (n=6 males, 5 females). (gi) Adipocyte size distribution (g), average adipocyte diameter (h) and calculated total adipocyte number (i) in 20-week-old mice (n=4 mice). Data are mean±s.e.m. *P<0.05 by Student's t-test between means.
Figure 3
Figure 3. Disruption of FAK impairs adipose tissue expansion with caloric excess.
(a) Photograph of 24-week-old littermate control and aP2FAK−/− mouse fed chow or HFD for 16 weeks, and littermate control aP2FAK+/+ db/db and aP2FAK−/− db/db mouse. (be) Body weight of male (n=12) (b) or female (n=8) (c) mice fed HFD starting at 8 weeks of age or mice on db/db (n=10) (d) or ob/ob (n=8) (e) genetic background. (f) Body composition expressed as per cent total body weight in 20- to 24-week-old male (green) and female (purple) mice fed HFD diet for 12–16 weeks (n=6). (gi) Perigonadal WAT sections stained with haematoxylin and eosin (H&E) (scale bar, 100 μm; arrows indicate macrophage crown-like structures) with adipocyte size distribution (g), average adipocyte diameter (h) and calculated total adipocyte number (i) from 20- to 24-week-old mice fed HFD for 12–16 weeks (n=4 mice). Data are mean±s.e.m. *P<0.05 and **P<0.01 by Student's t-test between means.
Figure 4
Figure 4. Disruption of FAK decreases survival signalling.
(a) Representative TUNEL of perigonadal WAT sections from 20- to 24-week-old mice fed HFD for 12–16 weeks (scale bar, 100 μm; arrows indicate TUNEL-positive nuclei) (n=4 mice). (b) Energy expenditure measured by oxygen consumption normalized to lean body mass (LBM) in mice fed HFD (n=3 control or 4 aP2FAK−/− mice). (c) Representative western blotting for cell survival signalling proteins in adipocytes from perigonadal WAT of HFD-fed mice with quantification (n=3 mice). (d) Representative PI staining of 3T3-L1 adipocytes day 7 after siRNA knockdown of FAK (scale bar, 100 μm; arrows indicate PI-positive nuclei) with quantification (n=3 replicates). (e) Relative macrophage F4/80 gene (Emr1) expression in whole perigonadal WAT of aP2FAK−/− versus control mice (n=6 mice). (f,g) Macrophage crown-like structures (arrow) seen with haematoxylin and eosin (H&E) staining with quantification (h) and fibrosis seen with Masson's trichrome staining (i) in perigonadal WAT sections from 24-week-old HFD-fed mice (scale bar, 100 μm). Data are mean±s.e.m. *P<0.05 by Student's t-test.
Figure 5
Figure 5. Adipocyte FAK is required for maintenance of glucose homeostasis.
(a) Fasting blood glucose in male (n=9) (blue) and female (n=10) (red) control or aP2FAK−/− mice at 12 weeks of age. Fasting serum insulin (n=10) (b) and pancreas sections from 20- to 24-week-old mice stained by IHC for insulin (red; scale bar, 200 μm) with quantification (n=5 mice) (c). ITT and area above the curve (AAC) in male (n=12) (d) and female (n=10) (e) 20- to 24-week-old mice. (f) Fasting serum free fatty acid levels in 20- to 24-week-old mice (n=6). ITT and AUC in male (n=10) (g) and female (n=9) (h) 20- to 24-week-old mice fed HFD for 12–16 weeks or 6- to 8-week-old mice on db/db (n=6) (i) or ob/ob genetic background (n=9) (j). Data are mean±s.e.m. * P<0.05, **P<0.01 and ***P<0.001 by Student's t-test.
Figure 6
Figure 6. Impaired adipose tissue expansion with disruption of FAK cannot be overcome by PPARγ agonist.
(ac) Relative expression of adipogenic genes from perigonadal WAT of aP2FAK−/− versus control 20- to 24-week-old mice fed chow diet (n=7) (a) or HFD (n=5) (b) and in 3T3-L1 cells day 3 after FAK versus control scramble siRNA treatment (n=6) (c). (d) Oil red O staining of differentiated 3T3-L1 adipocytes day 7 following siRNA knockdown of FAK (scale bar, 100 μm). (e) Body weight in 20- to 24-week-old control or aP2FAK−/− mice fed HFD with rosiglitazone for 12–16 weeks (n=7). (f) Body composition expressed as percent total body weight (n=10). (g) ITT in 20- to 24-week-old mice fed HFD with rosiglitazone for 12–16 weeks (n=5). Data are mean±s.e.m. *P<0.05 by Student's t-test.
Figure 7
Figure 7. Inhibiting apoptosis restores adiposity and insulin sensitivity with FAK deletion.
(a) Body weight in littermate control or aP2FAK−/− Casp3+/− mice fed chow diet (n=6). (b) Calculated total adipocyte cell number from perigonadal WAT of aP2FAK−/− Casp3+/− mice (n=4 mice). (c) ITT in 20- to 24-week-old aP2FAK+/+ Casp3+/+, aP2FAK−/− Casp3+/+ and aP2FAK−/− Casp3+/− mice and area above the curve (AAC) (n=10). *P<0.05 aP2FAK−/− Casp3+/− versus aP2FAK−/− Casp3+/+mice. †P<0.05 aP2FAK−/− Casp3+/+ versus aP2FAK+/+ Casp3+/+ mice. (d) Representative TUNEL of perigonadal WAT sections from 20- to 24-week-old aP2FAK−/− Casp3+/− mice (scale bar, 100 μm; arrows indicate positive nuclei) (n=3 mice). (e) ITT and AUC for 20- to 24-week-old aP2FAK−/− mice treated with Z-VAD-FMK (ZVAD) or vehicle (VEH) and aP2FAK+/+ mice treated with VEH (n=3). *P<0.05 aP2FAK−/− +ZVAD versus aP2FAK−/− +VEH. †P<0.05 aP2FAK−/− +VEH versus aP2FAK+/++VEH. (f) Representative TUNEL of perigonadal WAT sections from 20- to 24-week-old aP2FAK−/− and aP2FAK+/+ mice fed HFD for 12–16 weeks then treated with ZVAD or VEH (scale bar, 100 μm; arrows indicate positive nuclei) (n=3 mice). Data are mean±s.e.m. *P<0.05 by Student's t-test. ND, no stastistically significant difference, P>0.05 by Student's t-test.

References

    1. Sun K., Kusminski C. M. & Scherer P. E. Adipose tissue remodeling and obesity. J. Clin. Invest. 121, 2094–2101 (2011). - PMC - PubMed
    1. Osborn O. & Olefsky J. M. The cellular and signaling networks linking the immune system and metabolism in disease. Nat. Med. 18, 363–374 (2012). - PubMed
    1. Rosen E. D. & Spiegelman B. M. What we talk about when we talk about fat. Cell 156, 20–44 (2014). - PMC - PubMed
    1. Feng D. et al.. High-fat diet-induced adipocyte cell death occurs through a cyclophilin D intrinsic signaling pathway independent of adipose tissue inflammation. Diabetes 60, 2134–2143 (2011). - PMC - PubMed
    1. Strissel K. J. et al.. Adipocyte death, adipose tissue remodeling, and obesity complications. Diabetes 56, 2910–2918 (2007). - PubMed

Publication types

MeSH terms