. 2017 Feb 6:8:14341.
doi: 10.1038/ncomms14341.

Cell fate decisions emerge as phages cooperate or compete inside their host

Affiliations

Cell fate decisions emerge as phages cooperate or compete inside their host

Jimmy T Trinh et al. Nat Commun. .

Abstract

The system of the bacterium Escherichia coli and its virus, bacteriophage lambda, is paradigmatic for gene regulation in cell-fate development, yet insight about its mechanisms and complexities are limited due to insufficient resolution of study. Here we develop a 4-colour fluorescence reporter system at the single-virus level, combined with computational models to unravel both the interactions between phages and how individual phages determine cellular fates. We find that phages cooperate during lysogenization, compete among each other during lysis, and that confusion between the two pathways occasionally occurs. Additionally, we observe that phage DNAs have fluctuating cellular arrival times and vie for resources to replicate, enabling the interplay during different developmental paths, where each phage genome may make an individual decision. These varied strategies could separate the selection for replication-optimizing beneficial mutations during lysis from sequence diversification during lysogeny, allowing rapid adaptation of phage populations for various environments.


Conflict of interest statement

The authors declare no competing financial interests.

Figures

Figure 1
Figure 1. Individual phage decisions are visualized using a 4-colour fluorescence reporter system.
(a) Lytic reporters are constructed by translationally fusing mTurquoise2 (blue) and mNeongreen (green) to the phage capsid decorative protein, gpD. These phages are visible before infection, and upon lytic decisions, the cells produce progeny phages in the respective colours. Lysogenic reporters are constructed by transcriptionally fusing mKO2 (yellow) and mKate2 (red) to the phage lytic repressor gene, cI. Upon lysogenic decisions, cells express the lysogenic reporter colour then grow and divide. Combining the lytic and lysogenic reporters produces two new phages, each with separate decision reporters (blue phage with a blue lytic/yellow lysogenic reporter, and green phage with a green lytic/red lysogenic reporter). Cells infected with both phages (dual-colour infections) show how individual phages make decisions in cells. (bg) The overlay images (phase-contrast and fluorescent channels) of representative cells are shown for various cell fates. In the first frames of the movie (0 min), there are filled triangles pointing at blue phages and carets pointing at green phages adsorbed to cells. For lytic cells (b,c,f), fluorescence develops over time and forms localized spots in the cell (80 min), followed by cell lysis (160 min). The pure blue and pure green (b,c, respectively) lytic cells show only one fluorescence colour, but the mixed lytic cells (f) show both blue and green fluorescence, appearing as a cyan colour in the overlay image. For lysogenic cells (d,e,g), fluorescence develops uniformly throughout the cells, followed by cell growth and division. The pure yellow and pure red (d,e, respectively) lysogenic cells show only one fluorescence colour, but the mixed lysogenic cells (g) show both yellow and red fluorescence, appearing as orange in the overlay image. Scale bar, 2 μm.
Figure 2
Figure 2. Intracellular phages interact competitively during lysis and non-competitively during lysogeny.
(a) Mixed-infected cells at MOI=2, 3 and 4 are grouped by lytic/lysogenic fates, and furthermore into mixed (both lytic/both lysogenic) and pure (one lytic/lysogenic) fates. The ‘predicted' column shows the expected mixed/pure fate populations calculated from observed failed and dark infection frequencies of the blue/green phages. Sample sizes at MOI=2, 3, 4 are N=71, 45, and 11 (lytic), and N=49, 46, and 30 (lysogenic), respectively. (b,c) Cells infected at MOI=2, one of each phage, grouped as lytic or lysogenic, regardless of mixed/pure signals. For lytic cells (N=71) (b) we plot their blue/green signals and for lysogenic cells (N=49) (c) their red/yellow signals. Distributions of products for lytic (mean: 265, median: 30) and lysogenic (mean: 603, median: 159) data's X and Y values are significantly different (mean: K–S test, null hypothesis rejected, D=0.41, P=7e-5, median: Mann–Whitney U-test, null hypothesis rejected, U=3,701, P=2e-3). (d) Diagram of lytic and lysogenic development models for cells infected by one of each blue/green phage shown. DNAs arrive in the cell, bind a resource to replicate, and retain that resource after replication. In lytic cells, DNAs produce a reporter specific to the phage type. The blue/green reporter levels are recorded at the end of each simulation. For lysogenic cells, DNAs can switch into a lysogen after replicating, and lysogens convert DNA into lysogens and produce reporters. Phage arrival times and resource levels are key parameters varied. (e,f) Simulated cells at MOI=2, resource level=3, and average arrival delay=3 replications are shown for the lytic/lysogenic models (N=60 for each), resembling the experimental lytic/lysogenic data. Distributions of mean and median products for lytic (mean: 180, median: 22) and lysogenic (mean: 980, median: 490) data points' X and Y values are significantly different (mean: K–S test, null hypothesis rejected, D=0.56, P=3e-9, median: Mann–Whitney U-test, null hypothesis rejected, U=2,457, P=8e-10).
Figure 3
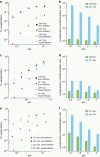
Figure 3. Mixed reporter signal frequency decreases with phage DNA arrival time and increases with resource level in lysis but not lysogeny.
(a,d) Mixed reporter signals versus average delay time: (a) for lytic cells (turquoise circles) decrease with delays whereas for lysogenic cells orange squares) they are relatively constant with respect to delays (fixed resource level=3, 0 cycles means simultaneous arrival). Mixed reporter signals are plotted against initial resource level in d similar to a (fixed delay time=three replication cycles). Simulation data (N=1,000 for all parameter sets) are normalized to the maximum and minimum of each data set and binned (20 bins), where trajectories ending with lytic/lysogenic signal >5% along both axes are classified as mixed signals for all histograms. Full histograms are shown in Supplementary Fig. 4. (b,c) Bivariate histograms of lysogenic (b) and lytic (c) reporter levels from simulations at given arrival delays. Magenta lines represent the pure-mixed threshold (5%) for each reporter. (e,f) Bivariate histograms of lysogenic (e) and lytic (f) reporter levels from simulations at given resource levels. Magenta lines represent the pure-mixed threshold (5%) for each reporter. (g) Percentage of pure (one antibiotic resistance, KanR or CmR) and mixed lysogens (both antibiotic resistances) from a bulk lysogenization assay using mixed WT phages is plotted as a function of API. The mixed lysogeny increases with API, and is similar between media. (h) Percentage of mixed and pure phage progeny from bulk lysis experiment (using the same blue and green phage mixture as in the infection movies) is shown compared with predicted values for different growth media, LB (N=1,522) and M9 (N=1,844). Predicted values assume no competition, and mixed population increases in richer LB medium.
Figure 4
Figure 4. Phages cooperate during lysogeny to mutually propagate integration.
(a,c,e) Mixed bulk lysogenization using WT phage mixed in a 1:1 ratio with either mutants λcII (a) or λP (c), and 1:1 ratio mixture of λcII and λP show complementation of mutant lysogenization defects via co-infection. Lysogenization frequency of pure infections with WT (circles), λcII (diamonds), and λP (squares) versus API are plotted on a log-log scale. Total phage integrations from mixed infections including lysogens from pure phage integrations and mixed phage integrations are shown (a,c, mutants in down triangles, and WT in up triangles, and e, up and down triangles correspond to different mutants) for each API, referring specifically to the number of mutant or WT phages. (b,d,f) Quantification of change in lysogenization from pure infections to mixed infections. (b corresponds to a,d to c and f to e). Values are calculated for each API by dividing the % lysogenization in the mixed infection by the % lysogenization in the pure infection; the bar represents the fold change in integration frequency, where ‘1' is no change. WT shows generally positive changes, and the mutants show increased lysogen frequency substantially. Representative plots are shown for each experiment, which were done with at least two biological replicates consisting of two technical replicates each. Error bars represent±s.d. of the technical replicates.
Figure 5
Figure 5. Dominating lysis results from phage competition during DNA ejection and replication.
(a) In dam seqA-mKO2 cells, the fully methylated phage DNA is bound by SeqA-mKO2 forming a focus. This reporter can show when DNA replicates once, producing two hemi-methylated DNAs bound by SeqA-mKO2. Dominating lysis occurs when unmethylated phage shows pure lysis with intracellular fully methylated phage DNA. (bd) Overlays showing different lysis types (blue/green phage is fully/unmethylated). Orange foci represent the first cellular DNA observed (arrowheads). After apparent DNA replication, multiple foci appear (branched arrows). (b) Normal lysis. Phage DNA seen at 0 min, two DNA foci at 45 min, then cell develops blue fluorescence and lyses. (c) Dominating lysis. DNA focus seen at 0 min, but the focus does not apparently split, and cell lyses with only green fluorescence. (d) Dominating lysis. DNA focus is absent at 0 min, appearing at 5 min. DNA focus divides, but green fluorescence accumulates, not blue. (e) Different lysis groups in dual-colour infection of fully methylated blue/unmethylated green phages (left, N=88) and of fully methylated green/unmethylated blue phages (right, N=85). Left, when blue phage DNA is labelled, pure green lysis (56%) is divided into pure green lacking blue DNA (failed blue phage infection, 29%), and dominating green with blue DNA (27%). Right, when green phage DNA is labelled, pure blue lysis (50%) is divided into pure blue without green DNA (failed green phage infection, 28%), and dominating blue with green DNA (20%). (f) Lytic cells with a focus (blue phage DNA) in mixed-phage infections (the blue/green phage is fully/un-methylated) are divided: lysis with blue signal (left, N=91) and dominating green (right, N=24). Within each lytic group, the frequency of the DNA focus separating into multiple foci is plotted. As lysis requires DNA replication, the 12% non-separating group in the blue lytic group represents basal failure of reporting DNA replication (left). The 62% non-separating group in the dominating green lytic group (right) is higher than basal failure. Of the dominated DNA that does divide, 6/9 showed late ejection. Scale bar, 2 μm.
Figure 6
Figure 6. Mixed voting for fates occurs between phage DNAs in a cell and delays lytic development.
(a) Examples of three different mixed voting cells including overlay images and their component fluorescence channels. The top row shows a ‘cross-phage mixed voting' cell with green and blue lytic signals and with red and yellow lysogenic signals. The middle and bottom rows show examples of ‘same-phage type mixed voting', as both lytic and lysogenic reporters can be found on the same phage. (b) A pie chart is shown comparing the different fates of all cells in this study (1,006 infected cells). Seven per cent are mixed voting cells resulting in lysis. (c) Lytic cells were divided into different groups: pure blue (N=178) (circles), pure green (N=179) (squares), mixed lytic (N=57) (diamonds), mixed voting blue lytic (N=35) (up triangles) and mixed voting green lytic (N=20) (down triangles). The number of cells lysed since the previous time point, as a percentage of the total group, is plotted with time. Each group's distribution is well fitted to a Gaussian distribution (lines), with an average lysis time of 114 min (pure blue), 114 min (pure green), 115 min (mixed lytic), 147 min (mixed voting blue) and 151 min (mixed voting green). (d) Example cells show lytic development yet lysogenic development and cell division using phage DNA reporter cells and fully/unmethylated phages. In the top and bottom rows the green and blue phages are methylated, respectively, with orange foci representing the ejected/replicated DNA. Green lytic signal builds up, but with time, the lysogenic reporter expression occurs (red or orange, the DNA reporter shares the same fluorescent protein as one lysogenic reporter) and the cell divides multiple times during the course of the movie, while the lytic signal ceases to accumulate. Scale bars, 2 μm.
Figure 7
Figure 7. Strategic DNA level phage interactions during development increase evolutionary fitness.
Individual phage DNAs make decisions to develop via lytic or lysogenic pathways, and interact with each other based on the decisions. During lysogeny, DNA replication is limited and favours mixed integrations of phage genomes. This cooperation may help diversify lysogens with different phage DNA to produce varied phages when induced later. Varied phages can be beneficial if the cells move to unknown environments. During lysis, extensive DNA replication results in resource competition, which typically favours a single phage type. Competition during lysis allows good genetics to propagate. If conditions favour lysis, dominating phages can spread quicker and more thoroughly. Different phage DNAs may choose different fates, which delays lytic progress. Confusion during development is non-optimal for propagating quickly, but if the delay allows survival in some rare situations, the tradeoff may increase the overall fitness of the phage.

Similar articles

Cited by

References

    1. Mcfarland D. J. Decision-making in animals. Nature 269, 15–21 (1977).
    1. Cotman C. Apoptosis decision cascades and degeneration in Alzheimers disease. Neurobiol. Aging 19, 29–32 (1998). - PubMed
    1. Balazsi G., van Oudenaarden A. & Collins J. J. Cellular decision making and biological noise: from microbes to mammals. Cell 144, 910–925 (2011). - PMC - PubMed
    1. Sanchez A. & Gore J. Feedback between population and evolutionary dynamics determines the fate of social microbial populations. PLoS Biol. 11, e1001547 (2013). - PMC - PubMed
    1. van Ditmarsch D. et al.. Convergent evolution of hyperswarming leads to impaired biofilm formation in pathogenic bacteria. Cell Rep. 4, 697–708 (2013). - PMC - PubMed

Publication types