. 2017 Feb 4;17(2):287.
doi: 10.3390/s17020287.

Diagnosis by Volatile Organic Compounds in Exhaled Breath from Lung Cancer Patients Using Support Vector Machine Algorithm

Affiliations

Diagnosis by Volatile Organic Compounds in Exhaled Breath from Lung Cancer Patients Using Support Vector Machine Algorithm

Yuichi Sakumura et al. Sensors (Basel). .

Abstract

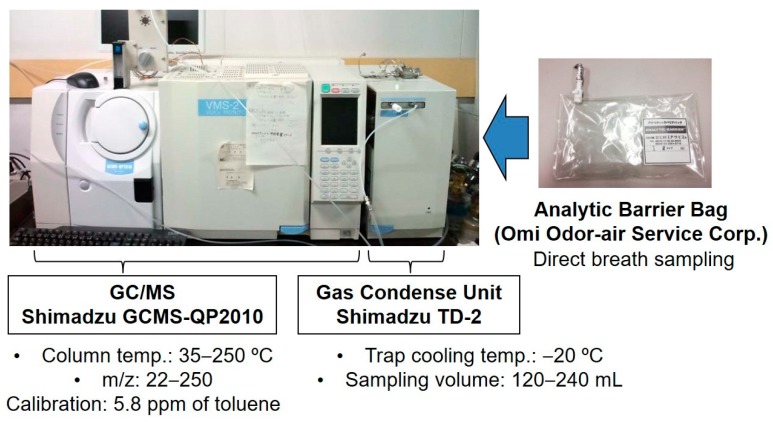
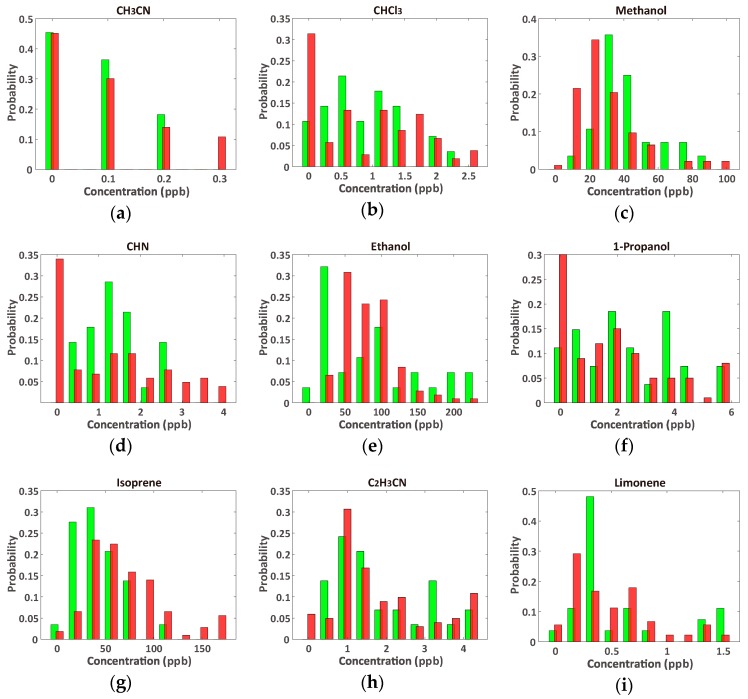
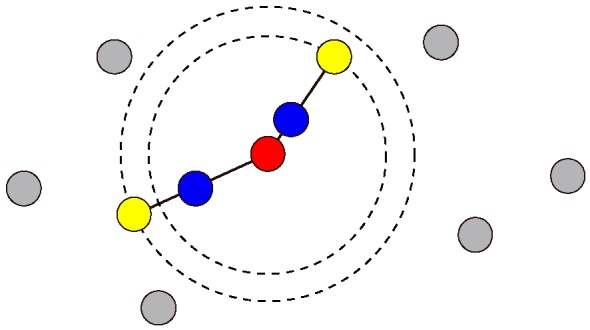
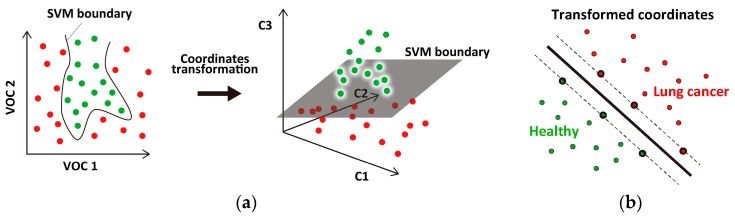
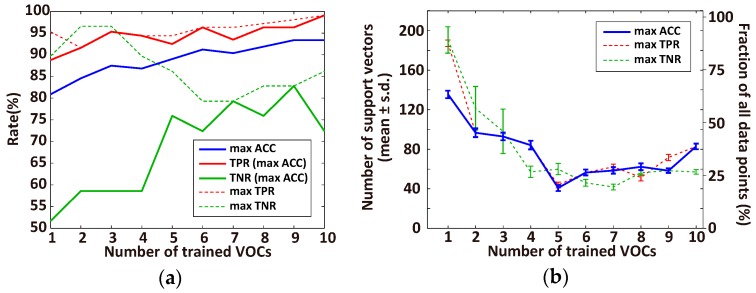
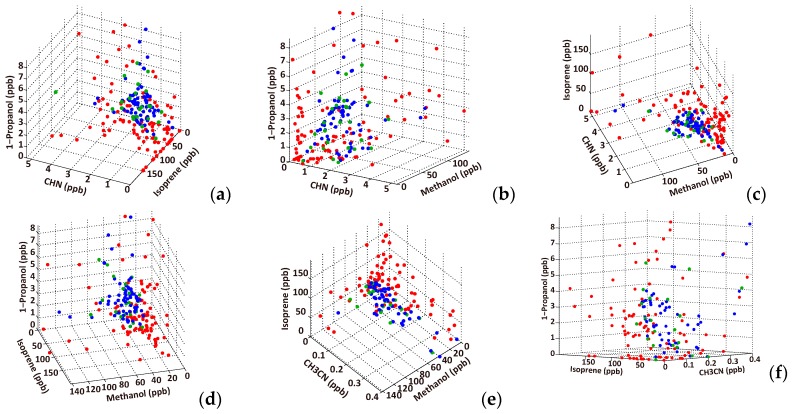
Monitoring exhaled breath is a very attractive, noninvasive screening technique for early diagnosis of diseases, especially lung cancer. However, the technique provides insufficient accuracy because the exhaled air has many crucial volatile organic compounds (VOCs) at very low concentrations (ppb level). We analyzed the breath exhaled by lung cancer patients and healthy subjects (controls) using gas chromatography/mass spectrometry (GC/MS), and performed a subsequent statistical analysis to diagnose lung cancer based on the combination of multiple lung cancer-related VOCs. We detected 68 VOCs as marker species using GC/MS analysis. We reduced the number of VOCs and used support vector machine (SVM) algorithm to classify the samples. We observed that a combination of five VOCs (CHN, methanol, CH₃CN, isoprene, 1-propanol) is sufficient for 89.0% screening accuracy, and hence, it can be used for the design and development of a desktop GC-sensor analysis system for lung cancer.

Keywords: exhaled air; gas chromatography–mass spectrometry analysis; lung cancer; screening; support vector machine (SVM); volatile organic compounds (VOCs).


Conflict of interest statement

The authors declare no conflict of interest.

Figures

Figure 1
Figure 1
Breath sampling and gas analysis by GC/MS.
Figure 2
Figure 2
Comparison of VOC concentration distributions from lung cancer (red, n = 107) and healthy (green, n = 29) controls’ breath; (a) CH3CN; (b) CHCl3; (c) methanol; (d) CHN; (e) ethanol; (f) 1-propanol; (g) isoprene; (h) C2H3CN; and (i) limonene. The VOCs in (ae) show significant differences between samples, while those in (fi) do not show significant differences (Table 1). The distributions of the remaining 11 VOCs are shown in the Supplementary Information (Figure S1).
Figure 3
Figure 3
Schematic illustrating the oversampling technique to obtain the same number of healthy control samples to that of the lung cancer patients. After one sample (red) is randomly chosen, two samples (blue) are randomly interpolated on the lines between the chosen sample and the two nearest samples (yellow).
Figure 4
Figure 4
Schematic illustrating nonlinear support vector machine (SVM). (a) The two-class data set is composed of two VOCs (VOC 1 and VOC 2; left panel), which are transformed into a different coordinate space (right panel) where the dataset can be classified by a flat boundary; (b) The SVM boundary (thick line) is determined using data points called support vectors (thick circles). The number of support vectors should be small to avoid overfitting the data points.
Figure 5
Figure 5
Schematic illustrating the leave-one-out cross-validation (LOOCV) procedure. A data point is repeatedly exchanged to categorize the training and testing data set.
Figure 6
Figure 6
Dependency of the performance of SVM diagnosis on the number of trained VOCs of the data set (lung cancer patients, n = 107; healthy individuals, n = 29, oversampling healthy samples, n = 78). (a) Best accuracy (ACC, blue line) with the corresponding true positive rate (TPR, solid red line) and true negative rate (TNR, solid green line) within all combinations of each number of trained VOCs (from 1 to 10). The dashed red and green lines represent the best TPR and TNR, respectively; (b) The number of support vectors that are used in the classifier in (a) for the best ACC (blue), TPR (red), and TNR (green). Left and right y-axes represent the actual number of data points and fraction of all data points, respectively.
Figure 7
Figure 7
VOC distributions on a 3D representation for the list of top accuracy combinations in Table 5. CHN, isoprene, 1-propanol (a); CHN, methanol, 1-propanol (b); CHN, methanol, isoprene (c); isoprene, methanol, 1-propanol (d); CH3CN, methanol, isoprene (e); and isoprene, CH3CN, 1-propanol (f). The red and green circles represent lung cancer patients and healthy controls, respectively, and the blue circles indicate the oversampling data. The oversampling data are more widely spread than the original healthy samples in this range because some of the healthy samples exist outside of the axis range.
Figure 8
Figure 8
(a) Schematic illustration of the hypothesis that the cancer stage correlates with distance from the SVM boundary in the transformed coordinates space; (b) The y-axis indicates the distance from the SVM boundary. The learning VOC combination of the best TPR in Table 3 (butane, ethanol, acetone, C2H3CN, and toluene) was used for computing the test sample distance.

References

    1. Gordon S., Szidon J., Krotoszynski B., Gibbons R., O’Neill H. Volatile organic compounds in exhaled air from patients with lung cancer. Clin. Chem. 1985;31:1278–1282. - PubMed
    1. Kharitonov S.A., Barnes P.J. Biomarkers of some pulmonary diseases in exhaled breath. Biomarkers. 2002;7:1–32. doi: 10.1080/13547500110104233. - DOI - PubMed
    1. Bach P.B., Kelley M.J., Tate R.C., McCrory D.C. Screening for lung cancer: A review of the current literature. Chest. 2003;123:72S–82S. doi: 10.1378/chest.123.1_suppl.72S. - DOI - PubMed
    1. Corazza G., Menozzi M., Strocchi A., Rasciti L., Vaira D., Lecchini R., Avanzini P., Chezzi C., Gasbarrini G. The diagnosis of small bowel bacterial overgrowth. Reliability of jejunal culture and inadequacy of breath hydrogen testing. Gastroenterology. 1990;98:302–309. doi: 10.1016/0016-5085(90)90818-L. - DOI - PubMed
    1. Phillips M., Gleeson K., Hughes J.M.B., Greenberg J., Cataneo R.N., Baker L., McVay W.P. Volatile organic compounds in breath as markers of lung cancer: A cross-sectional study. Lancet. 1999;353:1930–1933. doi: 10.1016/S0140-6736(98)07552-7. - DOI - PubMed

Substances