. 2017 Mar;23(3):368-375.
doi: 10.1038/nm.4278. Epub 2017 Feb 6.

A distinct innate lymphoid cell population regulates tumor-associated T cells

Affiliations

A distinct innate lymphoid cell population regulates tumor-associated T cells

Sarah Q Crome et al. Nat Med. 2017 Mar.

Abstract

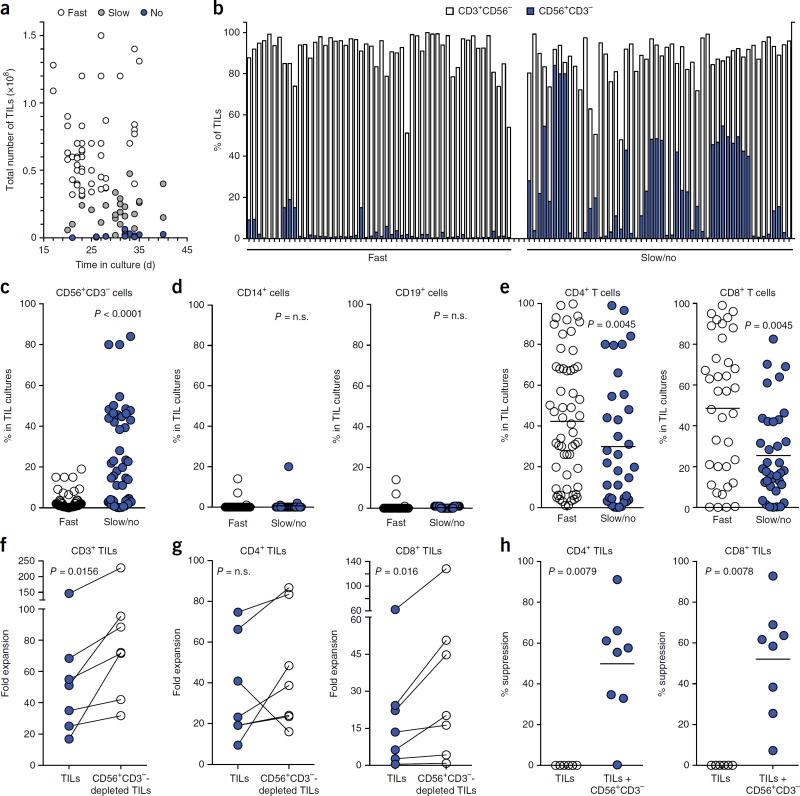
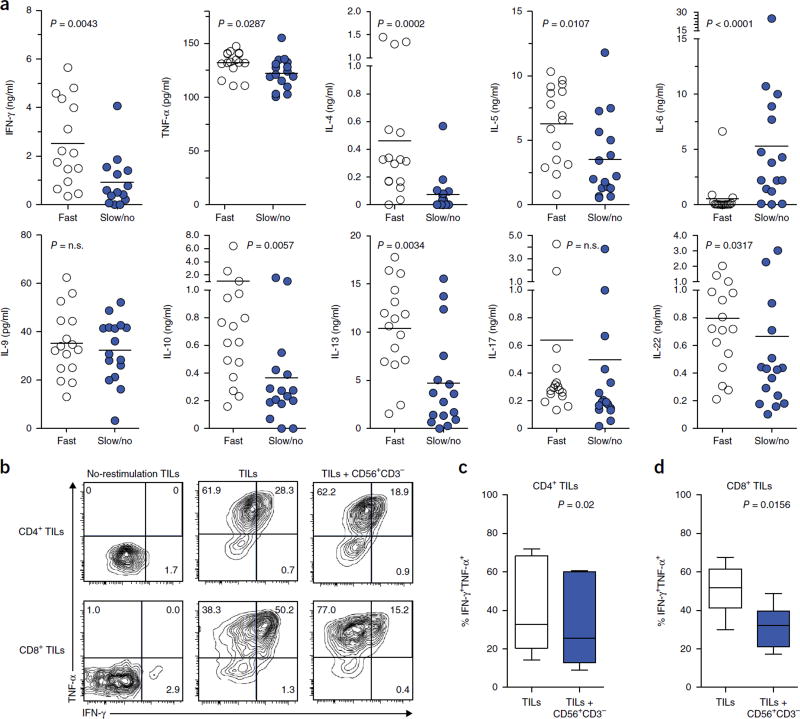
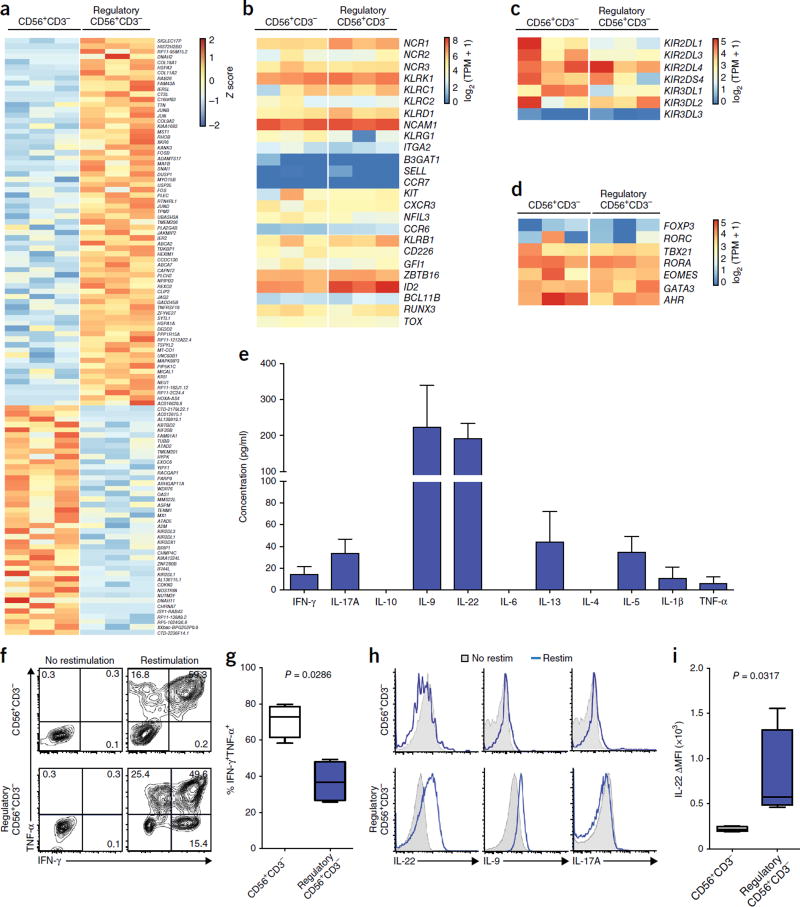
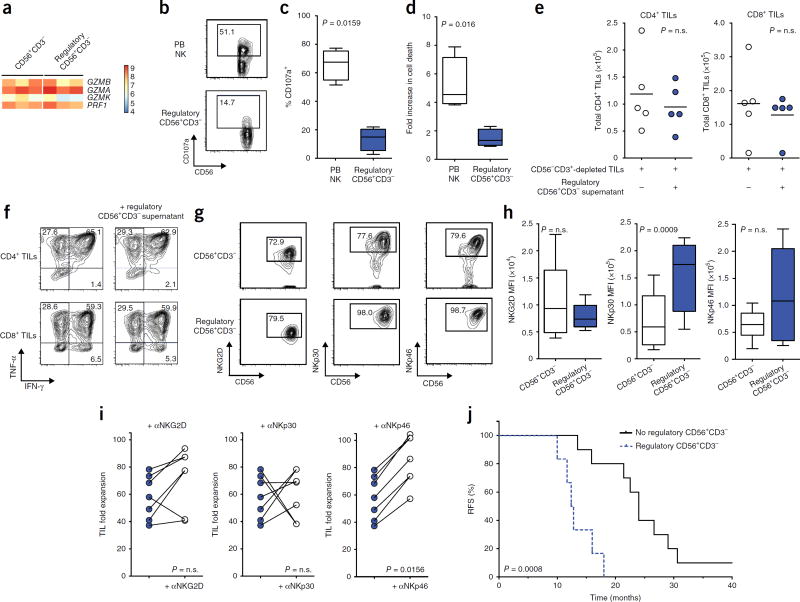
Antitumor T cells are subject to multiple mechanisms of negative regulation. Recent findings that innate lymphoid cells (ILCs) regulate adaptive T cell responses led us to examine the regulatory potential of ILCs in the context of cancer. We identified a unique ILC population that inhibits tumor-infiltrating lymphocytes (TILs) from high-grade serous tumors, defined their suppressive capacity in vitro, and performed a comprehensive analysis of their phenotype. Notably, the presence of this CD56+CD3- population in TIL cultures was associated with reduced T cell numbers, and further functional studies demonstrated that this population suppressed TIL expansion and altered TIL cytokine production. Transcriptome analysis and phenotypic characterization determined that regulatory CD56+CD3- cells exhibit low cytotoxic activity, produce IL-22, and have an expression profile that overlaps with those of natural killer (NK) cells and other ILCs. NKp46 was highly expressed by these cells, and addition of anti-NKp46 antibodies to TIL cultures abrogated the ability of these regulatory ILCs to suppress T cell expansion. Notably, the presence of these regulatory ILCs in TIL cultures corresponded with a striking reduction in the time to disease recurrence. These studies demonstrate that a previously uncharacterized ILC population regulates the activity and expansion of tumor-associated T cells.


Conflict of interest statement

COMPETING FINANCIAL INTERESTS

The authors declare no competing financial interests.

Figures

Figure 1
Figure 1
Innate lymphoid cells can suppress the expansion of tumor-infiltrating lymphocytes. (a) Multiple TIL cultures from individual HGSC specimens were expanded in medium with IL-2. “Fast” expansion rates refers to TIL cultures that yielded >30 × 106 cells on or before 4 weeks in culture, “slow” refers to TIL cultures that yielded 2–29 × 106 cells by 4 weeks, and “no” refers to cultures that had cell yields <2 × 10⁶ cells at 4 weeks. For cultures that were harvested before or after 4 weeks, the cell counts at the time of harvest were used to estimate whether the culture would have been categorized as “fast”, “slow”, or “no” at the 4-week mark. (b–e) Percentages of cells positive for the indicated lineage markers in cultures with fast or slow/no expansion were analyzed. The percentages of cells in TIL cultures are shown for CD56+CD3 cells and CD56CD3+ cells (fast, n = 51; slow/no, n = 49) (b), CD56+CD3 cells (fast, n = 51; slow/no, n = 49) (c), CD14+ cells (fast, n = 40; slow/no, n = 29) and CD19+ cells (fast, n = 40; slow/no, n = 37) (d), and CD4+ T cells and CD8+ T cells (fast, n = 37; slow/no, n = 36) (e). In c–e, each circle represents an independent TIL culture. (f,g) TILs from cultures exhibiting slow/no expansion were stimulated with anti-CD3 antibody, feeder cells, and IL-2 with and without depletion of CD56+CD3 cells. Expansion yields were calculated by combining cell counts with flow cytometry analysis of the types of cells present following stimulation. Each circle represents a different patient evaluated (n = 7). (f) Fold expansion of total CD3+ TILs. (g) Fold expansion of CD4+ and CD8+ TILs. (h) Flow cytometry–sorted CD8+ and CD4+ TILs from cultures exhibiting slow/no expansion were labeled with cell proliferation dye and activated with anti-CD3 and anti-CD28 antibodies. Expansion in the presence or absence of sorted autologous CD56+CD3 cells from TIL cultures experiencing slow/no expansion was assessed at 72 h. Each circle represents a different patient evaluated (n = 8). Bars in c–e and h represent the means. Significance was determined by Mann–Whitney test for c–e and Wilcoxon matched-pairs signed-rank test for f–h. n.s., not significant.
Figure 2
Figure 2
T cell cytokine production is altered in cultures containing regulatory innate lymphoid cells. (a) Cytokine production by TIL cultures with slow/no expansion and high proportions of CD56+CD3 cells and by rapidly expanding TIL cultures with low proportions of CD56+CD3 cells was assessed by cytometric bead assay. Each circle represents an individual TIL culture from a different patient and bars indicate the mean for each group (n = 16). (b–d) CD8+ and CD4+ TILs from cultures with slow/no expansion sorted by flow cytometry were labeled with cell proliferation dye and activated with anti-CD3 and anti-CD28 antibodies in the presence or absence of sorted autologous CD56+CD3 cells. Intracellular cytokine production was assessed at 72 h. Representative (b) and average CD4+ (c) and CD8+ (d) TIL expression of IFN-γ and TNF-α in the presence or absence of CD56+CD3 cells (n = 7 patients). For box-and-whisker plots in c and d, the middle line indicates the median, the box extends from the 25th to 75th percentile, and whiskers indicate minimum to maximum values. Statistical significance was determined by Mann–Whitney test for a and by Wilcoxon matched-pairs signed-rank test for c and d. n.s., not significant.
Figure 3
Figure 3
Regulatory innate lymphoid cells have unique properties. RNA-seq was performed on flow cytometry-sorted CD56+CD3 cells in TIL cultures with slow/no expansion that suppressed TILs (regulatory CD56+CD3 cells) or CD56+CD3 cells from TIL cultures with fast expansion that did not suppress TILs (CD56+CD3 cells). (a) Heat map representation of statistically significant differences in gene expression between CD56+CD3 cells and regulatory CD56+CD3 cells. The color scale represents the per-gene Z score, which is the number of s.d. away from the mean gene expression value across all samples. Genes were selected on the basis of multiple-testing-adjusted P < 0.05 and log2 (fold change) > 1. (b-d) Heat map representations of expression of NK cell- and ILC-related molecules (b), KIRs (c), and transcription factors (d) by regulatory CD56+CD3 cells and CD56+CD3 cells. The color scale represents log-transformed transcript abundance normalized by the upper quartile measured in transcripts per million (TPM). (e) Regulatory CD56+CD3 cells sorted by flow cytometry were stimulated with IL-2, and supernatants were collected after 24 h. Cytokine expression was measured by cytometric bead assay (n = 6 patients). Data are presented as means ± s.e.m. (f-i) Intracellular cytokine production by regulatory CD56+CD3 cells and CD56+CD3 cells sorted by flow cytometry was assessed after 16 h of stimulation with IL-2 and restimulation with PMA and ionomycin. Representative (f) and average (g) production of TNF-αand IFN-γby regulatory CD56+CD3 cells (n = 4 patients) and CD56+CD3 cells (n = 4 patients). Representative expression of IL-22, IL-9, and IL-17A (h) and average mean fluorescence intensity (MFI) of IL-22 (i) by regulatory CD56+CD3 cells (n = 5 patients) and CD56+CD3 cells (n = 4 patients). For box-and-whisker plots in g and i, the middle line indicates median, the box extends from the 25th to 75th percentile, and whiskers indicate minimum to maximum values. Statistical significance in g and i was determined by Mann-Whitney test.
Figure 4
Figure 4
Regulatory innate lymphoid cells limit T cell expansion via natural cytotoxicity receptors, and their presence is associated with a faster time to recurrence. (a) Heat map representation of expression of granzymes and perforin on flow cytometry–sorted CD56+CD3 cells from TIL cultures with slow/no expansion that suppressed TILs (regulatory CD56+CD3 cells) and CD56+CD3 cells from TIL cultures with fast expansion that did not suppress TILs (CD56+CD3 cells). The color scale represents log-transformed transcript abundance normalized to the upper quartile measured in TPM. (b–d) Regulatory CD56+CD3 cells and PB NK cells from healthy donors (PB NK) were isolated by flow cytometry–based sorting and co-cultured with K562 cells in the presence of IL-2. CD107a expression by CD56+CD3 cells and cell death of K562 cells were analyzed after 6 h. Representative (b) and average (c) CD107a expression by regulatory CD56+CD3 cells (n = 5 patients) or PB NK cells (n = 4 healthy donors). (d) Average percentage of K562 cells positive for viability dye represented as the fold increase in cell death when K562 cells were co-cultured with regulatory CD56+CD3 cells (n = 5 patients) or PB NK cells (n = 4 healthy donors). (e,f) TIL expansion and cytokine production were analyzed in the presence of supernatants obtained from culturing regulatory CD56+CD3 cells sorted by flow cytometry. (e) The number of CD4+ and CD8+ TILs is shown after expansion with and without supernatants from regulatory CD56+CD3 cells. Each circle represents a TIL culture from a different patient and the bars represent the means. (n = 5). (f) Representative intracellular IFN-γ and TNF-α production in CD4+ and CD8+ TILs expanded in the presence or absence of supernatants from regulatory CD56+CD3 cells for 5 d (n = 4). (g,h) Representative expression (g) and mean fluorescence intensity (MFI) average (h) of NKG2D, NKp30, and NKp46 expression by regulatory CD56+CD3 cells and CD56+CD3 cells from independent TIL cultures (n = 16). (i) Expansion yields of TILs in the presence or absence of anti-NKG2D, anti-NKp30, or anti-NKp46 antibody were compared following stimulation with feeder cells, anti-CD3 antibody, and IL-2. Each circle represents expansion cultures from a different patient (n = 7). (j) RFS was analyzed in patients with HGSC whose TIL cultures contained (n = 6) or did not contain (n = 10) regulatory CD56+CD3 cells. Patients were chemotherapy naive at the time of TIL isolation, and surgery achieved optimal debulking. For box-and-whisker plots in c, d, and h, the middle line indicates the median, the box extends from 25th to 75th percentile, and the whiskers indicated minimum to maximum values. Statistical significance was determined by Mann–Whitney test for c, d, g and h, Wilcoxon matched-pairs signed-rank test for e and i, and log-rank (Mantel–Cox) test in j. n.s., not significant.

Similar articles

Cited by

References

    1. Smyth MJ, Ngiow SF, Ribas A, Teng MW. Combination cancer immunotherapies tailored to the tumour microenvironment. Nat. Rev. Clin. Oncol. 2016;13:143–158. - PubMed
    1. Callahan MK, Postow MA, Wolchok JD. Targeting T cell co-receptors for cancer therapy. Immunity. 2016;44:1069–1078. - PubMed
    1. Schildberg FA, Klein SR, Freeman GJ, Sharpe AH. Coinhibitory pathways in the B7–CD28 ligand–receptor family. Immunity. 2016;44:955–972. - PMC - PubMed
    1. Crome SQ, Lang PA, Lang KS, Ohashi PS. Natural killer cells regulate diverse T cell responses. Trends Immunol. 2013;34:342–349. - PubMed
    1. Gasteiger G, Rudensky AY. Interactions between innate and adaptive lymphocytes. Nat. Rev. Immunol. 2014;14:631–639. - PMC - PubMed

MeSH terms