. 2017 Mar;49(3):465-469.
doi: 10.1038/ng.3780. Epub 2017 Feb 6.

Divergent effects of intrinsically active MEK variants on developmental Ras signaling

Affiliations

Divergent effects of intrinsically active MEK variants on developmental Ras signaling

Yogesh Goyal et al. Nat Genet. 2017 Mar.

Abstract

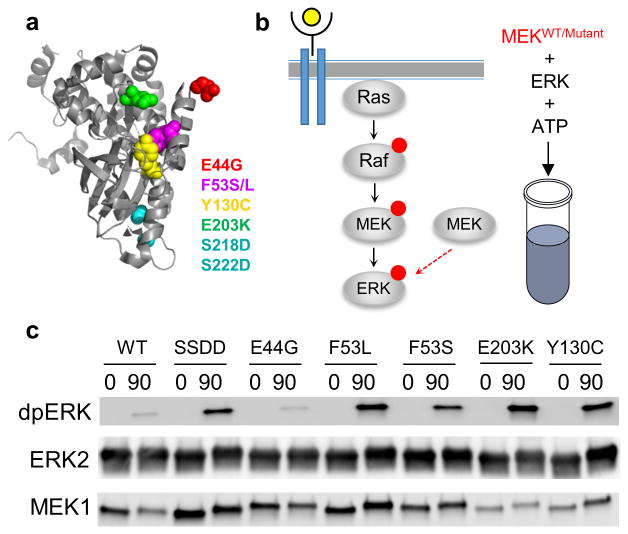
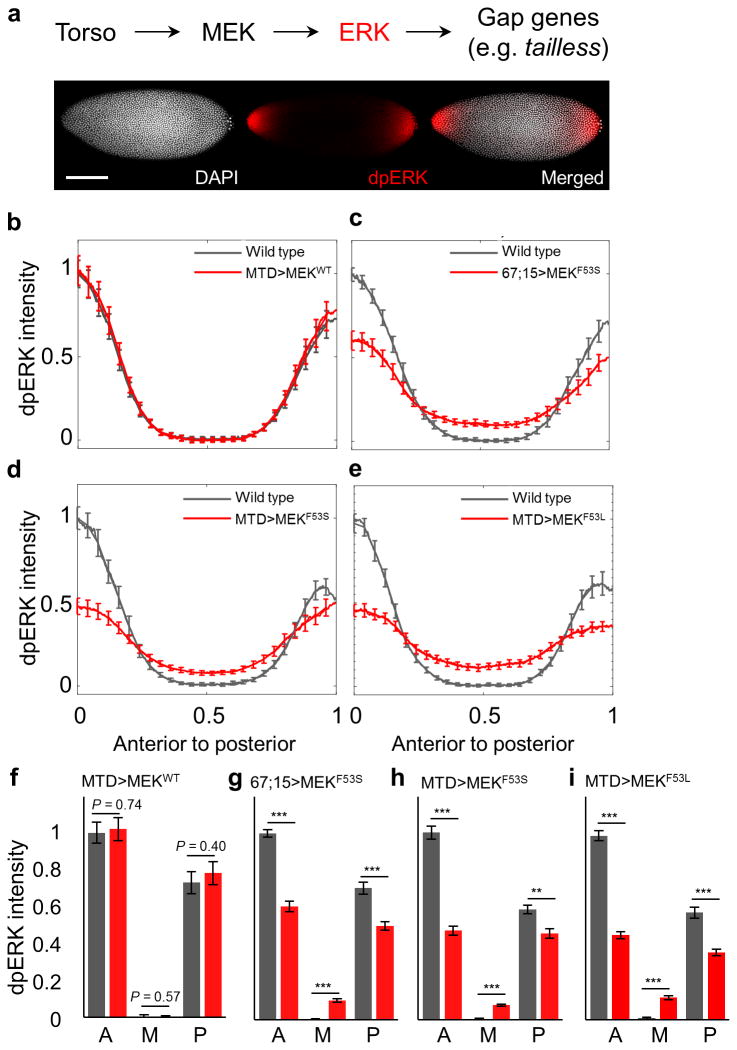
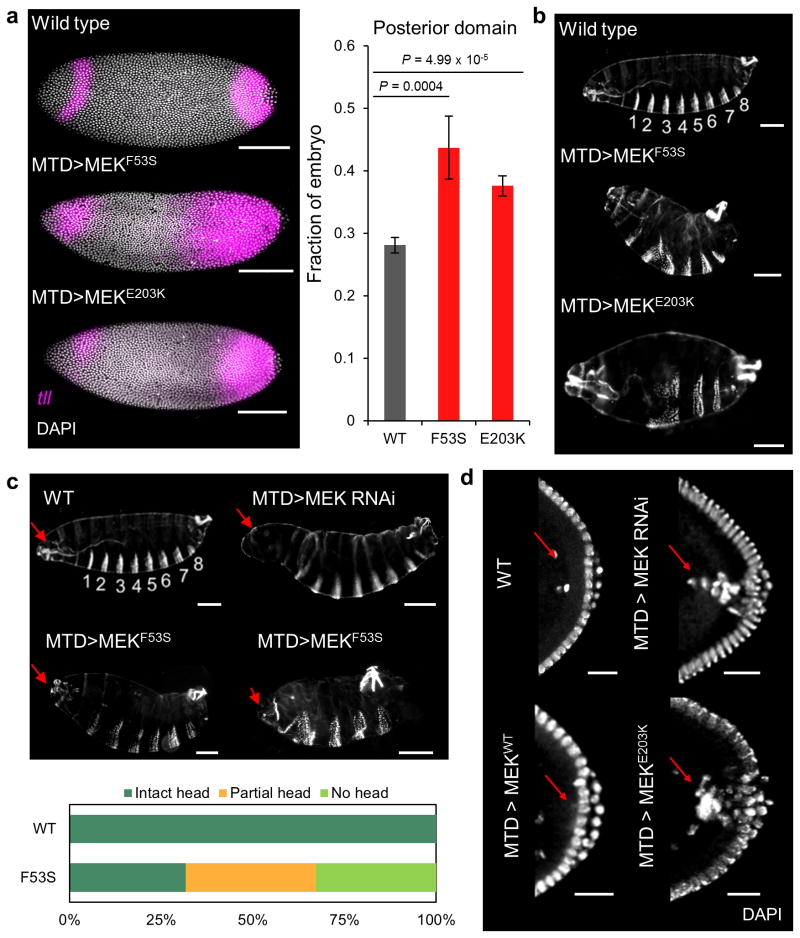
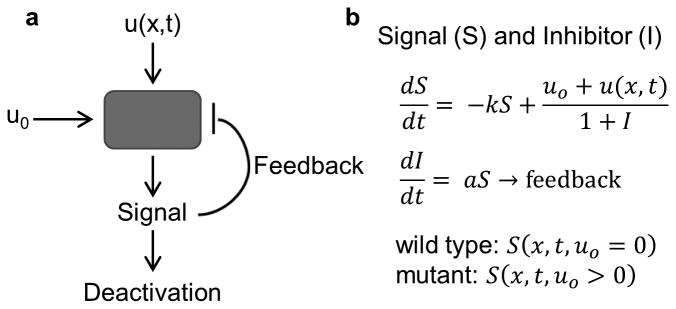
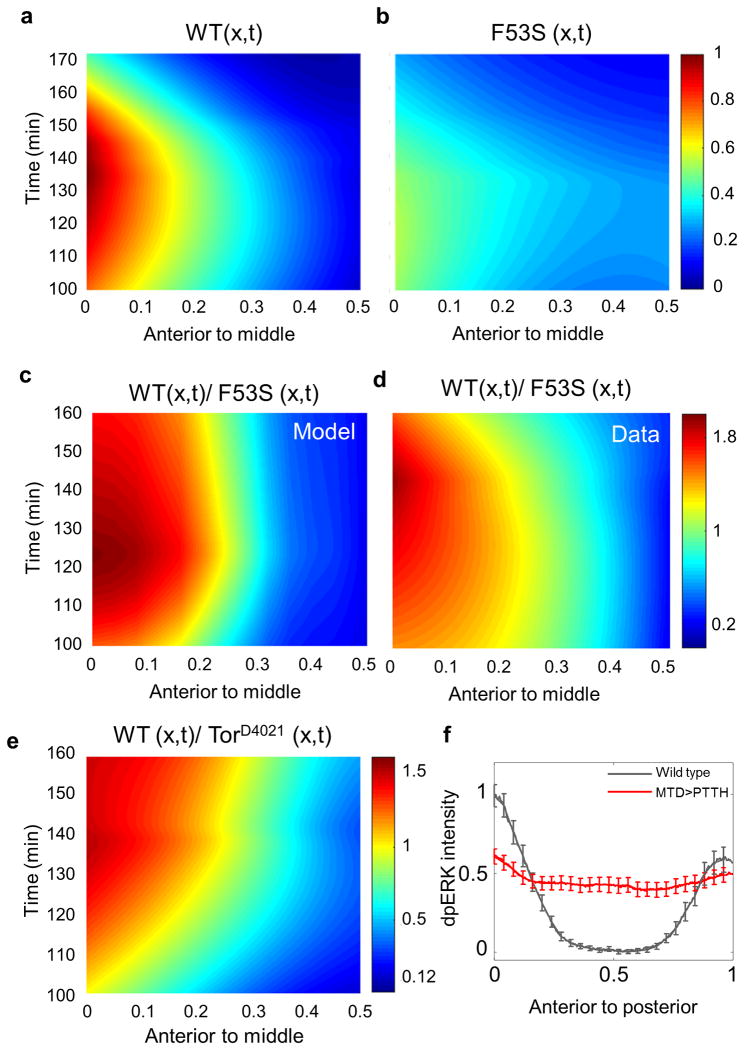
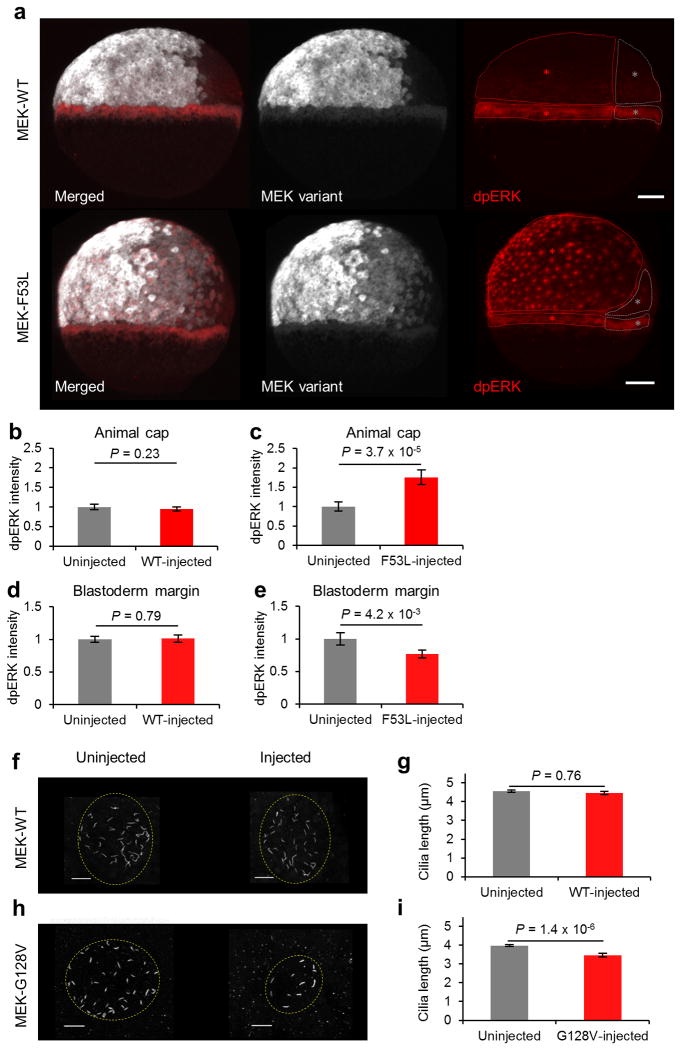
Germline mutations in Ras pathway components are associated with a large class of human developmental abnormalities, known as RASopathies, that are characterized by a range of structural and functional phenotypes, including cardiac defects and neurocognitive delays. Although it is generally believed that RASopathies are caused by altered levels of pathway activation, the signaling changes in developing tissues remain largely unknown. We used assays with spatiotemporal resolution in Drosophila melanogaster (fruit fly) and Danio rerio (zebrafish) to quantify signaling changes caused by mutations in MAP2K1 (encoding MEK), a core component of the Ras pathway that is mutated in both RASopathies and cancers in humans. Surprisingly, we discovered that intrinsically active MEK variants can both increase and reduce the levels of pathway activation in vivo. The sign of the effect depends on cellular context, implying that some of the emerging phenotypes in RASopathies may be caused by increased, as well as attenuated, levels of Ras signaling.


Figures

Figure 1
Figure 1
MEK mutations are constitutively active in vitro. (a) The location of a set of mutations (E44G, F53S, F53L, Y130C, E203K, S218D/222D) (accession NM_002755.3) is shown in the structure of MEK1 (PDB file 3w8q). (b) (left) Schematic of the Ras pathway depicting MEK-mediated ERK activation by ligands (black, solid arrows) or by ligand-independent constitutively active MEK (red, dashed arrow). (right) Schematic of the in vitro system. (c) ERK2 activation by the wild type (WT) MEK1 and the MEK1 variants as detected by a western blot of samples of the reconstituted system with purified proteins. With the exception of E44G, MEK1 variants associated with diseases result in ligand-independent ERK activation, which was higher than WT MEK1. MEK1 S218D/S222D, a phosphomimetic variant, was used as a positive control. Four experimental replicates were performed for MEK:ERK ratio of 1:5. Blot images in (c) were cropped for bands corresponding to MEK1, ERK2, and dpERK. Additional quantifications of dpERK levels are presented in the Supplementary Tables 1 and 2.
Figure 2
Figure 2
MEK mutations cause divergent effects on ERK activation in vivo. (a) Torso RTK signaling in the Drosophila embryo. A nuclear cycle 14 WT embryo stained for DAPI and dpERK (See Supplementary Figs. 3,4 for details of embryo staging). Scale bar, 100 μm. (b) Overexpression of WT MEK does not alter the dpERK profile. (c-e) Overexpression of MEK mutations F53S (c,d) and F53L (e) result in opposing effects in the middle and pole regions of the embryo. Pairwise comparisons of the dpERK profiles for (b) WT (n = 15) and MTD>MEKWT (n = 17); (c) WT (n = 10) and 67;15>MEKF53S (n = 19); (d) WT (n = 8) and MTD>MEKF53S (n = 20); (e) WT (n = 19) and MTD>MEKF53L (n = 24). Error bars denote standard error of the mean (s.e.m.). (f-i) Comparative analysis of the dpERK levels at the anterior (A), middle (M), and posterior (P) regions of the embryo. Overexpression of MEK variants using maternal drivers does not affect total ERK levels (Supplementary Fig. 5). P values, Student's t-test (two-sided, homoscedastic): ***P < 0.00001, **P = 0.0036. Error bars denote standard error of the mean (s.e.m.).
Figure 3
Figure 3
Opposing effects of activating mutations on the ERK-dependent morphological phenotypes. (a) (left) Expression of tailless (magenta) is expanded, more prominently at the posterior, in MEK mutants (data shown for F53S and E203K). Scale bar, 100 μm. (right) Quantification of the posterior tailless domain yields significant differences (nWT = 15, nF53S = 3, nE203K = 19). Expression patterns of some other gap genes are not affected (Supplementary Figs. 8,9). P values, Student's t-test (two-sided, homoscedastic). Error bars denote standard error of the mean (s.e.m.). (b) Larval cuticles for the WT and MEK mutants F53S and E203K are shown. F53S (less than eight segments: 51/52 of the dead embryos); E203K (less than eight segments: 63/68 dead embryos). (c) (top) Constitutively active MEK mutation F53S results in loss of anterior head structures (red arrows), a partially penetrant phenotype also observed in embryos lacking maternal MEK. (bottom) Quantification of anterior head structures for WT (n = 35) and F53S MEK mutant (n = 79). Scale bar, 100 μm. (d) WT (top left) and overexpressed MEK (bottom left, 17 out of 18 embryos are normal) embryos do not display pole-hole phenotype (red arrows), whereas both loss of MEK (top right, 4 out of 8 embryos display pole-hole phenotype) and overexpression of activating MEK mutant E203K (bottom right, 27 out of 39 embryos display pole-hole phenotype) result in a pole-hole phenotype. Scale bar, 25 μm.
Figure 4
Figure 4
A two-input mathematical model for feedback-induced effects on ERK signaling. (a) Schematic of the mathematical model of signal-induced feedback. (b) Differential equations governing the model; here u0 and u(x,t) are ligand-independent and ligand-dependent inputs respectively. S: signal; I: Inhibitor; k: rate constant of signal degradation; a: strength of feedback. Additional modeling details and parameter values are provided in the Supplementary Table 3.
Figure 5
Figure 5
A feedback-based mathematical model. (a,b) Heatmaps of the reconstruction of the spatiotemporal profile of ERK activation, from anterior (0) to the middle (0.5) in WT (n = 51) and MEK mutant F53S (n = 57) from snapshots of fixed Drosophila embryos (See Methods for details of reconstruction) (c,d) A heatmap of the ratio of dpERK intensity in WT embryos to that of embryos expressing MEK-F53S, generated by the model (c) and obtained from data (d). In both cases, the ratio changes from >1 (at the pole) to <1 (in the middle of the embryo). (e) A heatmap of the ratio of dpERK intensity in WT embryos to that of embryos carrying a constitutively active mutation TorD4021 (nWT = 55, nD4021 = 51). Individual heatmaps for WT and TorD4021 are shown in Supplementary Fig. 13. (f) Pairwise comparison of dpERK levels in the WT embryos (n = 16) and embryos expressing PTTH (n=28, see text for details). Error bars denote standard error of the mean (s.e.m.).
Figure 6
Figure 6
MEK mutations cause divergent effects on ERK signaling in zebrafish. (a) Embryos injected with MEK constructs (gray) in one cell of the 2-cell stage embryo reveal divergent effects on ERK signaling (red) during epiboly. The domains affected by the injected constructs (red) are compared to signaling levels in areas that do not express the injected construct (gray) in (b-e). (b,c) In the animal cap, WT MEK1 does not affect dpERK levels (n = 13) (b), whereas the MEK1 variants F53L (n = 10) (c) and G128V (n = 8) (Supplementary Fig. 14a) result in increased dpERK levels. (d,e) In the blastoderm margin, WT MEK1 does not affect dpERK levels (n = 15) (d), whereas the MEK1 variants F53L (n = 11) (e) and G128V (n = 8) (Supplementary Fig. 14) result in decreased dpERK levels. (b-e) P values, Student's t-test (two-sided, paired). Scale bar, 100 μm. (f,g) WT MEK1 does not affect cilia length in KV, which was measured at the 14-somite stage (16 hpf) (Uninjected: n = 6 embryos, 211 cilia; WT-injected: n = 4 embryos, 144 cilia). Scale bar, 10 μm. (h,i) However, the MEK1 G128V variant causes shorter cilia length in KV, which was measured at the 10-somite stage (14 hpf) (Uninjected: n = 6 embryos, 295 cilia; G128V-injected: n = 3 embryos, 67 cilia). In agreement with a previous study, we found a reduced number of cilia. (g,i) P values, Student's t-test (two-sided, homoscedastic). Error bars denote standard error of the mean (s.e.m.).

Similar articles

Cited by

References

    1. Rauen KA. The RASopathies. Annu Rev Genomics Hum Genet. 2013;14:355–69. - PMC - PubMed
    1. Tartaglia M, et al. Mutations in PTPN11, encoding the protein tyrosine phosphatase SHP-2, cause Noonan syndrome. Nat Genet. 2001;29:465–468. - PubMed
    1. Chen X, et al. Endogenous expression of Hras(G12V) induces developmental defects and neoplasms with copy number imbalances of the oncogene. Proc Natl Acad Sci U S A. 2009;106:7979–84. - PMC - PubMed
    1. Jindal GA, Goyal Y, Burdine RD, Rauen KA, Shvartsman SY. RASopathies : unraveling mechanisms with animal models. Dis Model Mech. 2015;8:769–782. - PMC - PubMed
    1. Rodriguez-Viciana P, et al. Germline mutations in genes within the MAPK pathway cause cardio-facio-cutaneous syndrome. Science. 2006;311:1287–90. - PubMed

Substances