. 2017 Mar;20(3):484-496.
doi: 10.1038/nn.4495. Epub 2017 Feb 6.

A molecular census of arcuate hypothalamus and median eminence cell types

Affiliations

A molecular census of arcuate hypothalamus and median eminence cell types

John N Campbell et al. Nat Neurosci. 2017 Mar.

Abstract

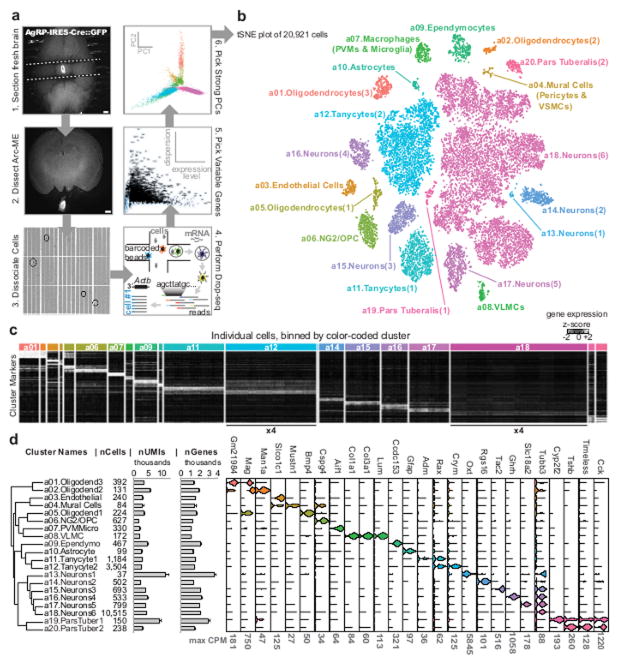
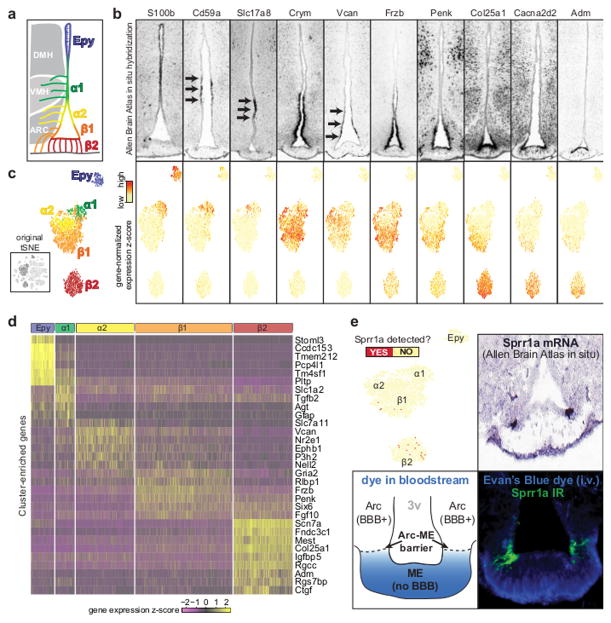
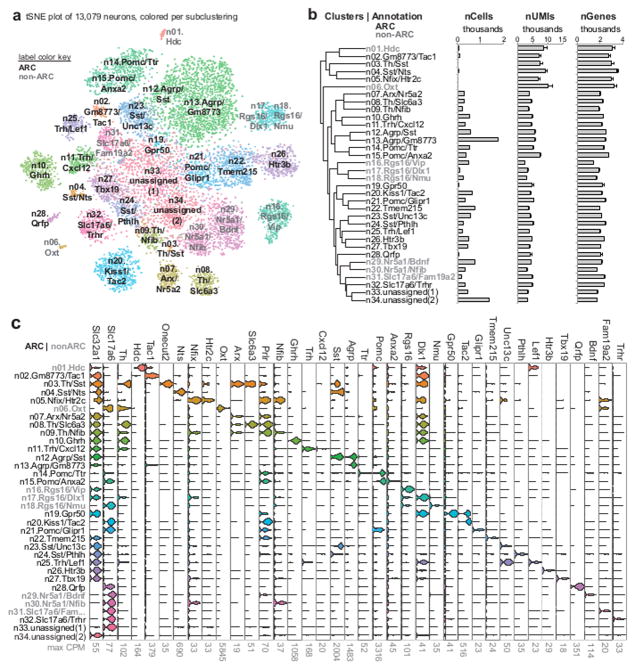
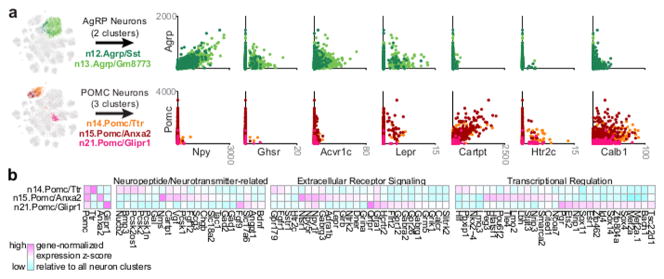
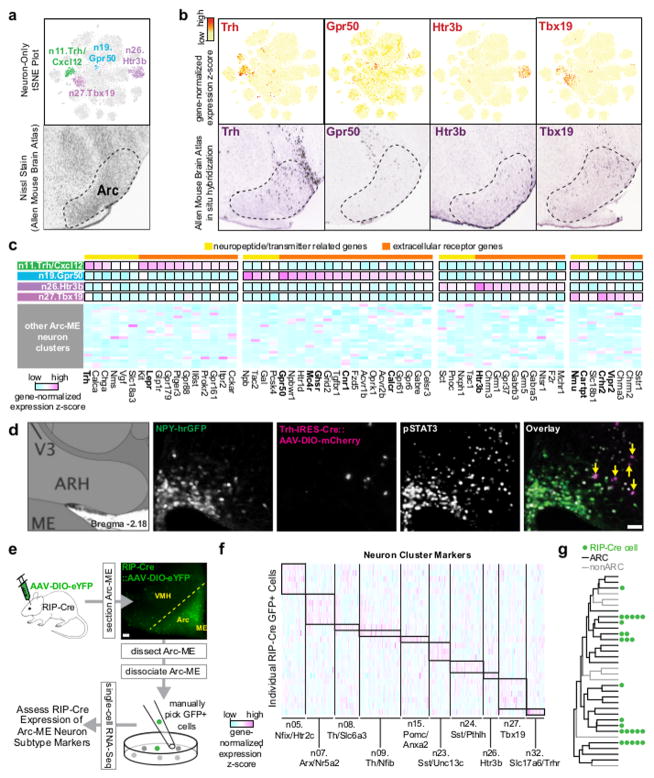
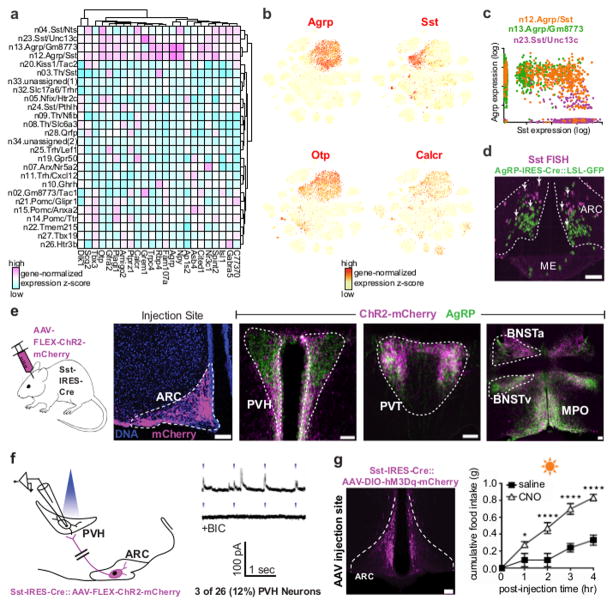
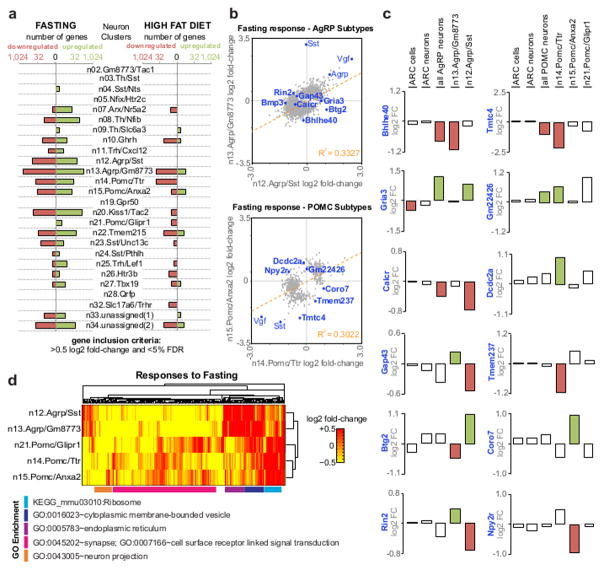
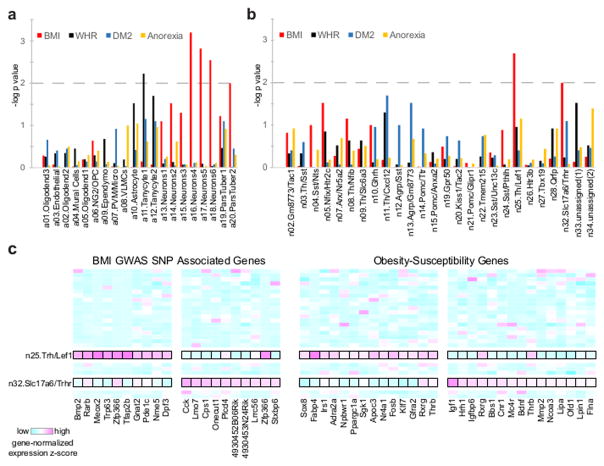
The hypothalamic arcuate-median eminence complex (Arc-ME) controls energy balance, fertility and growth through molecularly distinct cell types, many of which remain unknown. To catalog cell types in an unbiased way, we profiled gene expression in 20,921 individual cells in and around the adult mouse Arc-ME using Drop-seq. We identify 50 transcriptionally distinct Arc-ME cell populations, including a rare tanycyte population at the Arc-ME diffusion barrier, a new leptin-sensing neuron population, multiple agouti-related peptide (AgRP) and pro-opiomelanocortin (POMC) subtypes, and an orexigenic somatostatin neuron population. We extended Drop-seq to detect dynamic expression changes across relevant physiological perturbations, revealing cell type-specific responses to energy status, including distinct responses in AgRP and POMC neuron subtypes. Finally, integrating our data with human genome-wide association study data implicates two previously unknown neuron populations in the genetic control of obesity. This resource will accelerate biological discovery by providing insights into molecular and cell type diversity from which function can be inferred.


Conflict of interest statement

COMPETING FINANCIAL INTERESTS STATEMENT

The authors declare no competing financial interests.

Figures

Figure 1
Figure 1. Overview of all cell types
(A) Schematic of Arc-ME single-cell transcriptomics. (B) Spectral tSNE plot of 20,921 cells, colored per density clustering and annotated according to known cell types. (C) Heatmap of top marker genes for each cluster. The two largest clusters, a12 and a18, were reduced to ¼ size to better visualize the smaller clusters (D) Dendrogram showing relatedness of cell clusters, followed by (from left to right): cluster identification numbers; cells per cluster; mean ± S.E.M. unique molecular identifiers (UMIs) per cluster; mean ± S.E.M. genes detected per cluster; and violin plots showing expression of cell type marker genes.
Figure 2
Figure 2. Ependymal cell types
(A) Illustration of known subtypes of hypothalamic ependymal cells, their approximate anatomical locations, and the orientation of their processes - ependymocyte have cilia in the ventricle and tanycytes have basal processes in the brain parenchyma and median eminence (B) Marker gene expression shown by ependymal cell feature plot (top) and in situ hybridization of coronal brain sections (Allen Mouse Brain Atlas; bottom). Ependymal cell feature plot derived from tSNE plot shown in Figure 1B. Genes were selected from those differentially expressed among ependymal cell clusters. (C) Annotation of ependymal cell clusters based on anatomical localization of marker genes. Figure was derived from tSNE plot shown in Figure 1B (thumbnail). (D) Heatmap of single-cell expression of cluster-enriched transcripts. (E) Top left, ependymal cell feature plot re-colored to indicate cells with any amount of Sprr1a transcript. Top right, Sprr1a in situ hybridization in a coronal brain section (Allen Mouse Brain Atlas). Bottom left, schematic of an experiment to define the diffusion barrier between Arc and ME. Bottom right, confocal micrograph comparing SPRR1A immunoreactivity to the location of the Arc/ME diffusion barrier, visualized by extravasation of intravascular Evan’s Blue; micrograph is representative of 2 mice.
Figure 3
Figure 3. Neuronal cell types
(A) Spectral tSNE plot of 13,079 neurons, colored according to the results of iterative subclustering, and labeled according to expression of either a specific marker gene or a specific combination of marker genes. Clusters with gray labels most likely originated from regions surrounding the Arc-ME (see Supplemental Figure 5A–D). (B) Dendrogram showing relatedness of neuronal clusters, followed by (from left to right): cluster identification numbers; histograms of neurons per cluster; mean ± S.E.M. unique molecular identifiers (UMIs) per cluster; mean ± S.E.M. unique genes detected per cluster. (C) Violin plots of known and novel markers of neuron subtypes in and around the Arc-ME, with maximum counts per million (CPM) below.
Figure 4
Figure 4. AgRP Neurons and POMC Neurons
(A) Left, selection of AgRP neurons and POMC neurons for analysis of gene co-expression. Right, co-expression of Agrp or Pomc with genes known to be enriched in AgRP neurons and/or POMC neurons. Values are in counts per million (CPM). (B) Differentially expressed genes related to neuropeptide/transmitter signaling and transcriptional regulation in three subtypes of POMC neurons.
Figure 5
Figure 5. Novel subtypes of Arc-ME neurons
(A) Top, neuron-only tSNE plot re-colored to indicate four novel neuron subtypes selected for further analysis: n11.Trh/Cxcl12 neurons, n19.Gpr50 neurons, n26.Htr3b neurons, and n27.Tbx19 neurons; bottom, Nissl stain of sagittal Arc-ME (Allen Mouse Brain Atlas). (B) Expression of marker genes shown by re-coloring of neuron-only tSNE plot (top) and by in situ hybridization of sagittal brain sections (Allen Mouse Brain Atlas; bottom). (C) Heatmap of neuropeptide and receptor genes enriched in four novel neuron subtypes. Other Arc-ME neuron subtypes included for comparison are not labeled but are in numerical order (by n#). (D) Leptin-induced pSTAT3 immunofluorescence in the caudal Arc-ME of a fasted Trh-IRES-Cre mouse in which cells were labeled by Cre-dependent AAV-mCherry (micrograph representative of 4 mice). Yellow arrows indicate pSTAT3+/mCherry+ cells. Scale bar, 50μm. (E) Single-cell RNA-Seq of eYFP labeled RIP-Cre+ neurons that were acutely dissociated and manually isolated from Arc-ME of 2 adult male mice. Micrograph representative of 2 mice. Scale bar, 50μm. (F) RIP-Cre neuron expression of Arc-ME neuronal subtype markers. (G) Dendrogram of Arc-ME neuron subtypes with green dots indicating the subtypes most similar to RIP-Cre neurons based on marker expression.
Figure 6
Figure 6. Similarities between AgRP neurons and SST neurons
(A) Heatmap of genes co-enriched in AgRP neurons and SST neurons. (B) Expression of two co-enriched genes, Otp and Calcr, as well as Agrp and Sst shown by re-coloring of neuron-only tSNE plots. (C) Co-expression of Agrp and Sst by individual cells in three neuron clusters: n12.Agrp/Sst, n13.Agrp/Gm8773, and n23.Sst/Unc13c. (D) Representative micrograph comparing Agrp-IRES-Cre::loxSTOPlox-GFP immunofluorescence to Sst mRNA in situ hybridization. White arrows indicate co-labeled cells. (E) Axon projection patterns of AgRP neurons and Arc-ME SST neurons. From left to right, micrographs of mCherry immunofluorescence where Cre-dependent AAV-Channelrhodopsin2(ChR2)-mCherry was injected in the Arc-ME of a Sst-IRES-Cre mouse, and comparison of mCherry and AgRP immunofluorescence in paraventricular hypothalamus (PVH); paraventricular thalamus (PVT); bed nucleus of the stria terminalis, anterior (aBNST) and ventral (vBNST) parts; and medial preoptic nucleus (MPO). Micrographs are representative of 3 mice. Scale bar, 100μm. (F) Left, schematic of channelrhodopsin-assisted circuit mapping (CRACM) from ChR2+ Arc-ME SST (ARCSST) to unidentified PVH neurons (n=2 mice). Right, representative patch-clamp recordings of PVH neurons during photostimulation of ARCSST neuron axons in PVH, in the absence (top) or presence (bottom) of the bath-applied GABA A receptor antagonist bicuculline (BIC); blue dash indicates light pulse. (G) Effect of chemogenetic stimulation of Arc-ME ARCSST neurons on daytime food intake. Left, micrograph of mCherry immunofluorescence where Cre-dependent AAV-hM3Dq-mCherry was injected bilaterally in the Arc-ME of a Sst-IRES-Cre mouse; representative of 5 mice; scale bar, 100μm. Right, cumulative food intake in 4hr period after i.p. injection of either the hM3Dq ligand, clozapine N-oxide (CNO), or vehicle (saline). N=5 mice; data shown as mean ± SEM. *p < 0.05, ****p < 0.0001; two-way ANOVA followed by Sidak’s multiple comparisons test
Figure 7
Figure 7. Transcriptional responses to energy imbalance
(A) Histograms showing the number of genes significantly up- or down-regulated in response to fasting and high fat diet in each Arc-ME neuron subtype. (B) Comparison of fasting responses of AgRP neuron subtypes (top) and POMC neuron subtypes (bottom). Genes plotted were significantly affected by fasting (false-discovery rate (FDR), <0.25) in at least one AgRP neuron subtype (top) or POMC neuron subtype (bottom). While subtypes generally show significant correlation (R2 = 0.33 for AgRP neuron subtypes and R2 = 0.30 for POMC neuron subtypes), there are many individual genes that are differentially affected by fasting (e.g., within top-left and bottom-right quadrants). (C) Examples of genes affected by fasting only in one subtype of AgRP neurons and POMC neurons, or affected oppositely between subtypes. For comparison, average fold-change values are also shown for all Arc-ME cells, all Arc-ME neurons, and all AgRP or POMC neurons. Bars are shaded to indicate the gene was differentially expressed at FDR<0.25 (D) Heatmap of gene expression fold-change values for genes significantly affected in at least one AgRP or POMC subtype. Genes are clustered by gene expression similarities across AgRP and POMC subtypes. GO terms with highest significance for each cluster are shown.
Figure 8
Figure 8. DEPICT predicts specific neuronal subtypes affecting BMI
(A) DEPICT predicts transcripts from BMI-associated loci (p < 3×10⁻³), but not WHR, DM2, or anorexia-linked loci, are enriched in neurons. The dotted line shows statistically significant enrichment. (B) DEPICT predicts transcripts from BMI-associated loci (P < 1×10⁻²) are enriched in n25.Trh/Lef1 and n32.Slc17a6/Trhr neuron clusters. (C) Heatmap of n25.Trh/Lef1 and n32.Slc17a6/Trhr neuron cluster expression of genes near BMI-linked loci or related to obesity susceptibility.

Comment in

References

    1. Rodriguez EM, Blazquez JL, Guerra M. The design of barriers in the hypothalamus allows the median eminence and the arcuate nucleus to enjoy private milieus: the former opens to the portal blood and the latter to the cerebrospinal fluid. Peptides. 2010;31:757–776. - PubMed
    1. Langlet F, et al. Tanycytic VEGF-A boosts blood-hypothalamus barrier plasticity and access of metabolic signals to the arcuate nucleus in response to fasting. Cell Metab. 2013;17:607–617. - PMC - PubMed
    1. Aponte Y, Atasoy D, Sternson SM. AGRP neurons are sufficient to orchestrate feeding behavior rapidly and without training. Nat Neurosci. 2011;14:351–355. - PMC - PubMed
    1. Krashes MJ, et al. Rapid, reversible activation of AgRP neurons drives feeding behavior in mice. J Clin Invest. 2011;121:1424–1428. - PMC - PubMed
    1. Han SY, McLennan T, Czieselsky K, Herbison AE. Selective optogenetic activation of arcuate kisspeptin neurons generates pulsatile luteinizing hormone secretion. Proc Natl Acad Sci U S A. 2015;112:13109–13114. - PMC - PubMed

MeSH terms