. 2017 Feb 6;12(2):e0171312.
doi: 10.1371/journal.pone.0171312. eCollection 2017.

The role of myosin II in glioma invasion: A mathematical model

Affiliations

The role of myosin II in glioma invasion: A mathematical model

Wanho Lee et al. PLoS One. .

Abstract

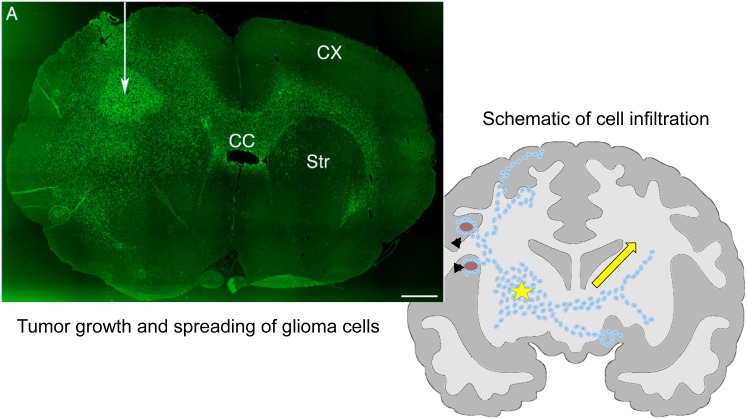
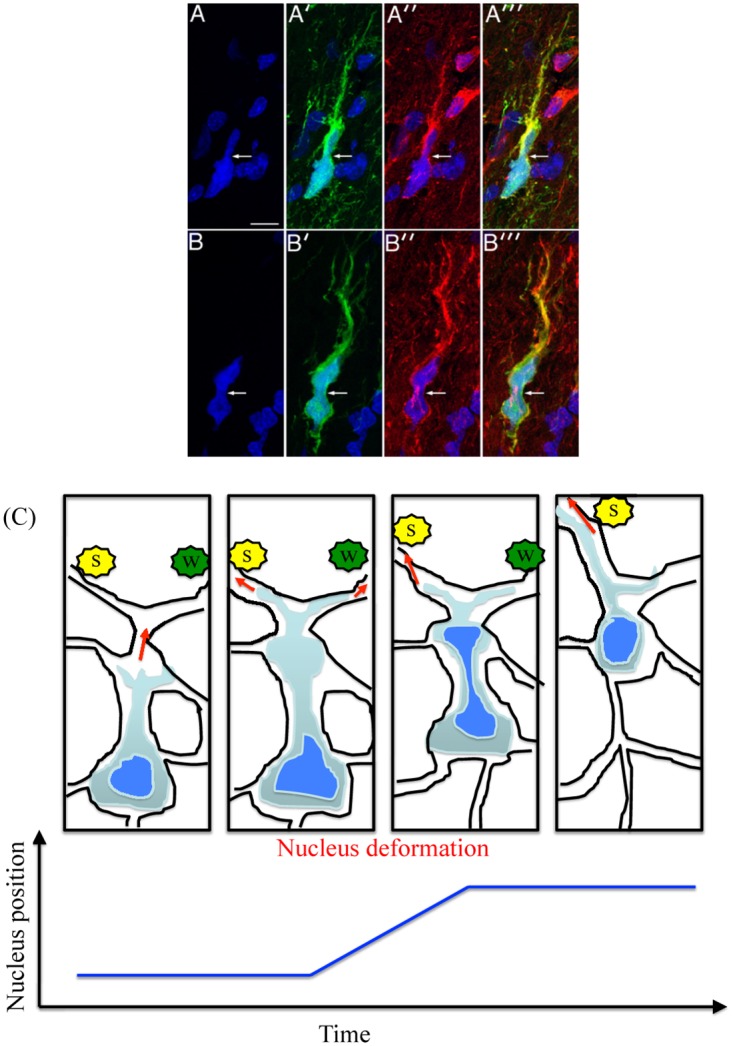
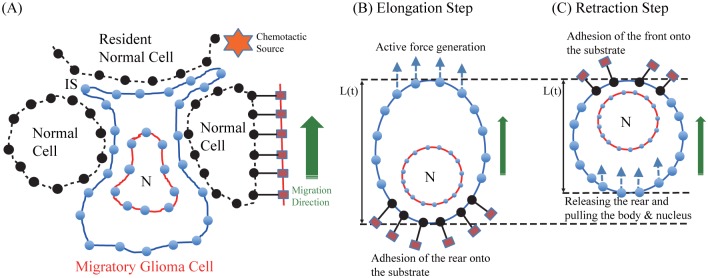
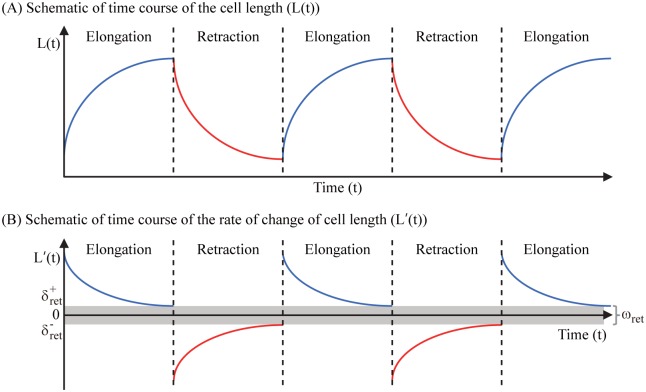
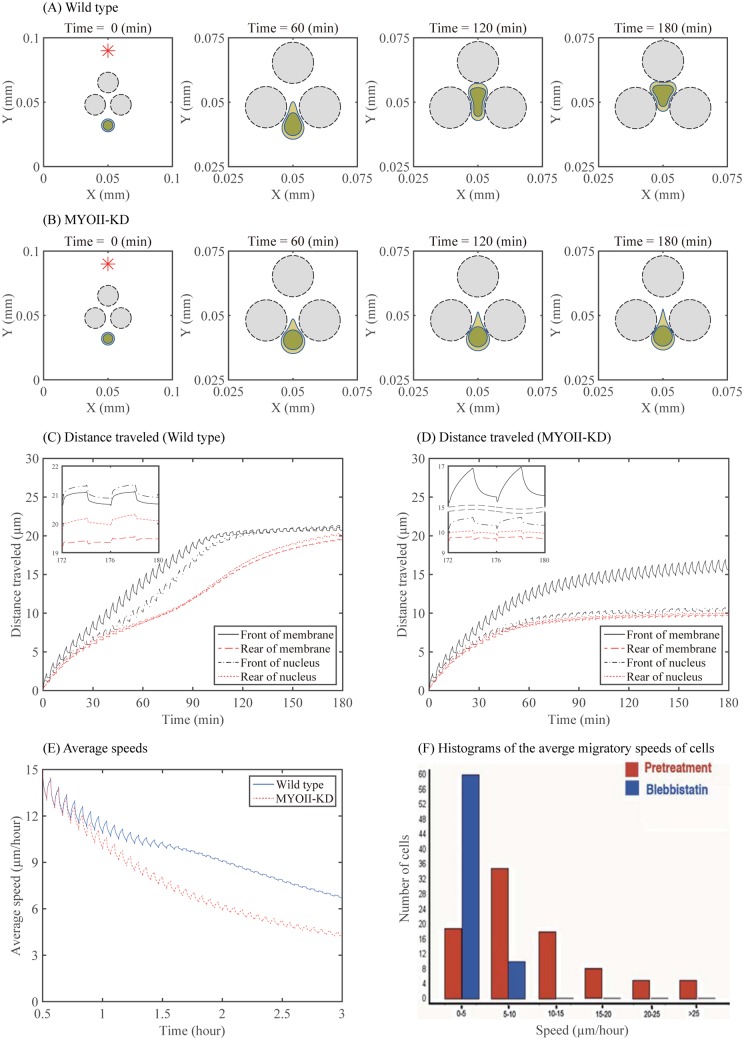
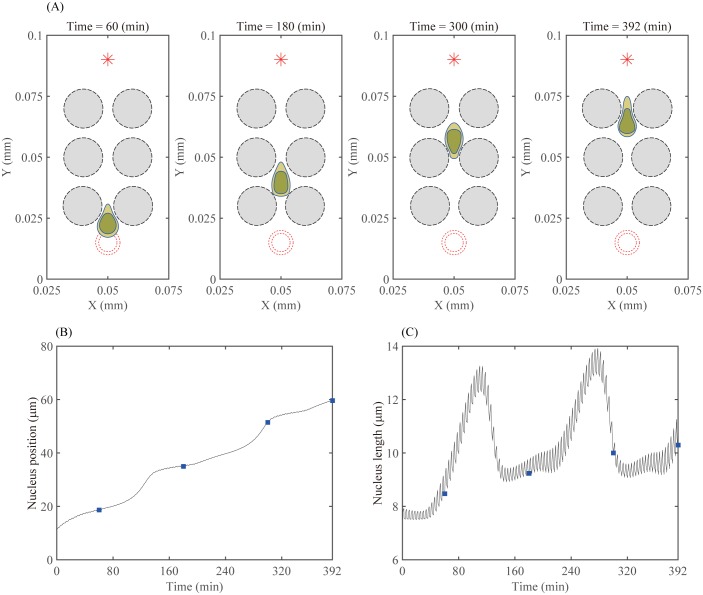
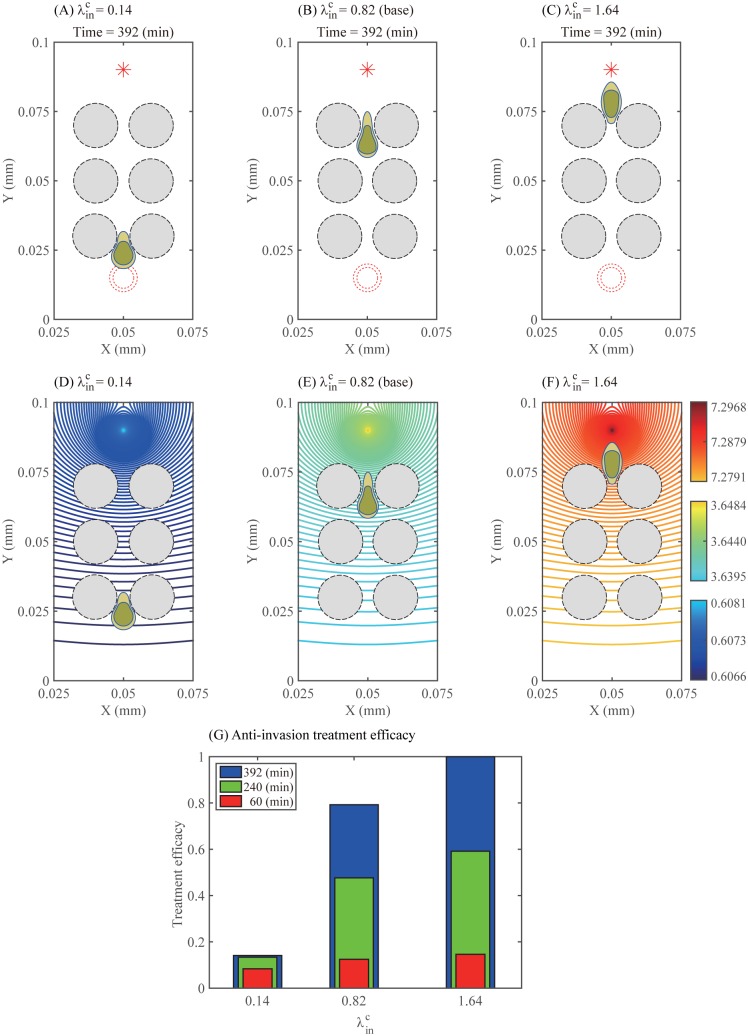
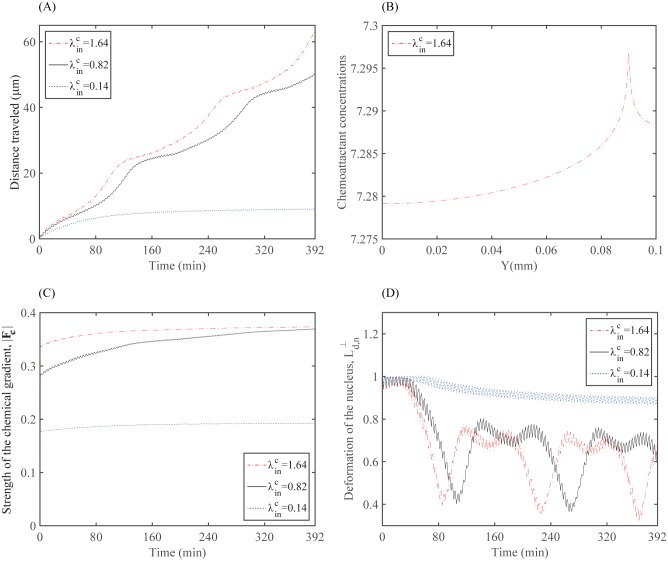
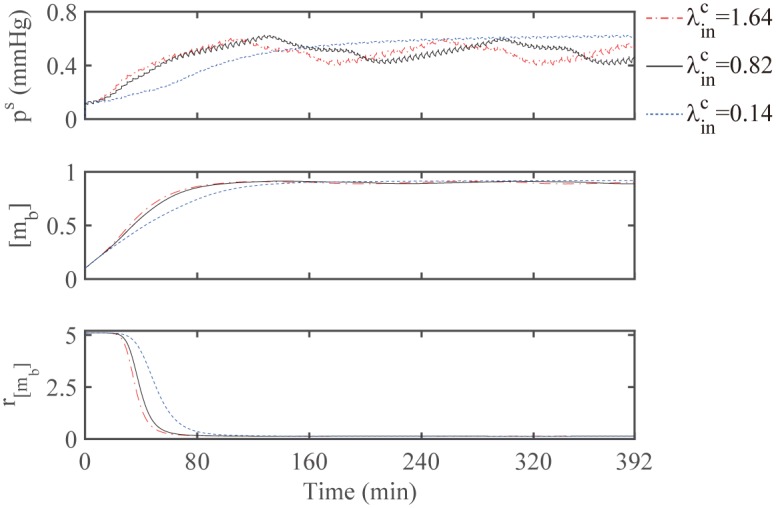
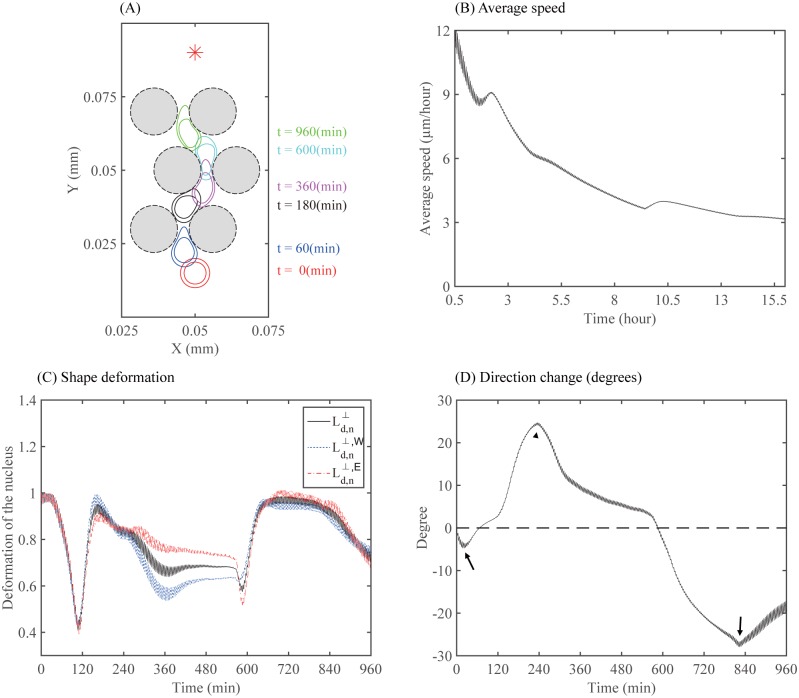
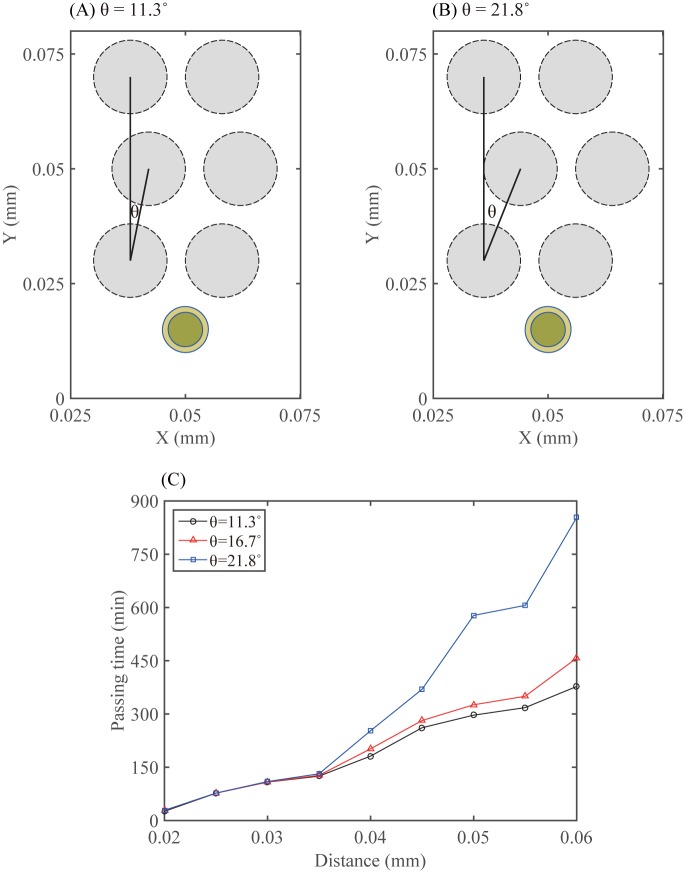
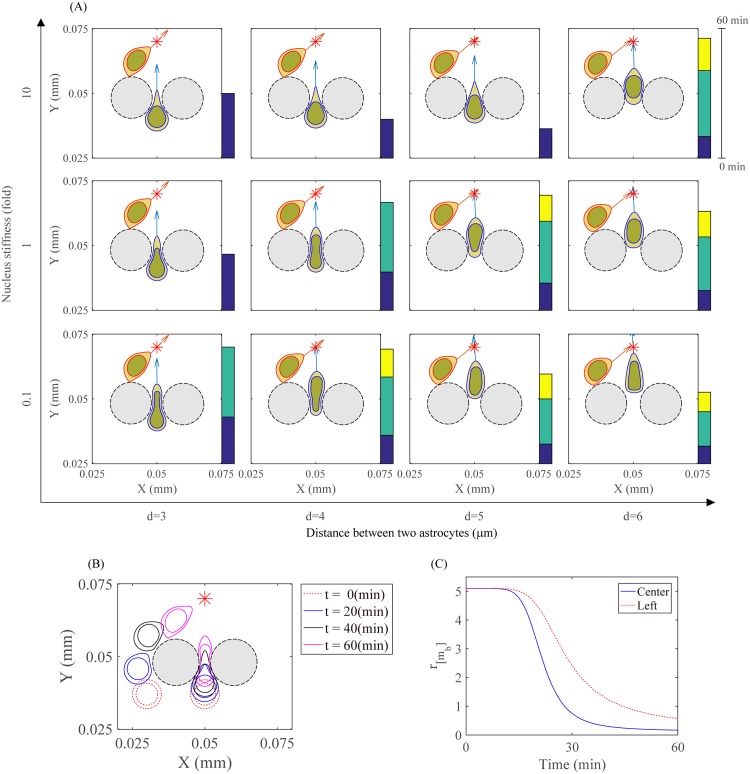
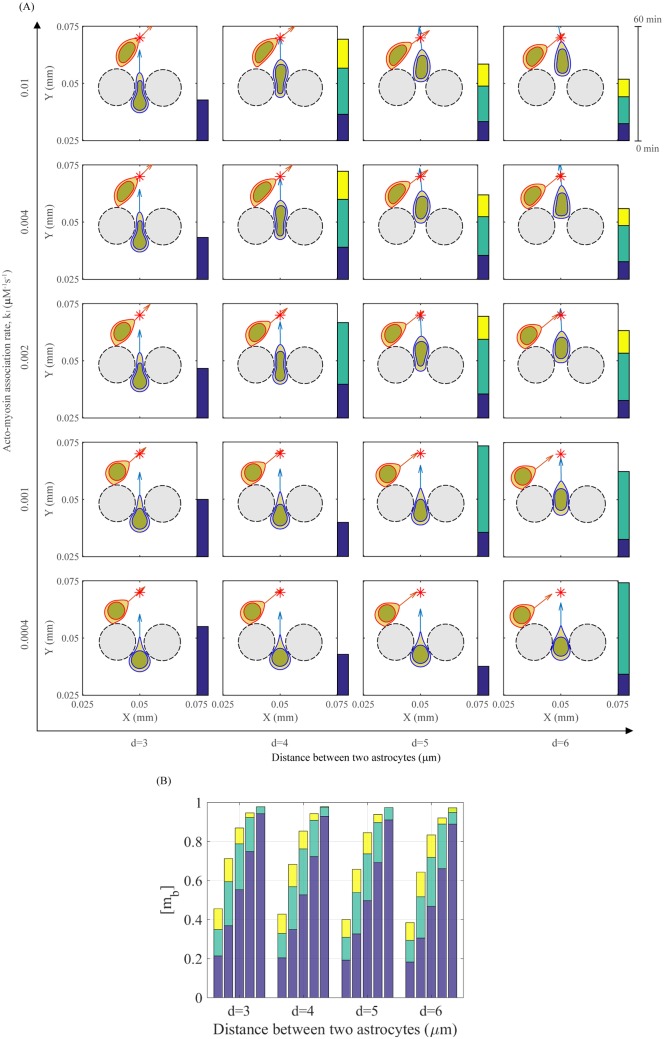
Gliomas are malignant tumors that are commonly observed in primary brain cancer. Glioma cells migrate through a dense network of normal cells in microenvironment and spread long distances within brain. In this paper we present a two-dimensional multiscale model in which a glioma cell is surrounded by normal cells and its migration is controlled by cell-mechanical components in the microenvironment via the regulation of myosin II in response to chemoattractants. Our simulation results show that the myosin II plays a key role in the deformation of the cell nucleus as the glioma cell passes through the narrow intercellular space smaller than its nuclear diameter. We also demonstrate that the coordination of biochemical and mechanical components within the cell enables a glioma cell to take the mode of amoeboid migration. This study sheds lights on the understanding of glioma infiltration through the narrow intercellular spaces and may provide a potential approach for the development of anti-invasion strategies via the injection of chemoattractants for localization.


Conflict of interest statement

The authors have declared that no competing interests exist.

Figures

Fig 1
Fig 1. Experimental observation on cell infiltration in glioma models.
(Left) Invasive Human glioma xenografts. Tumor has spread across the corpus callosum (CC) to the contralateral white matter located between straiatum (Str) and cortex (CX). Green = staining for human nuclear antigen to illustrate the location of human tumor cells in the rat background. White arrow = the location of the site of tumor inoculation. Reprinted from Beadle C, Assanah M, Monzo P, Vallee R, Rosenfield S, et al. (2008) The role of myosin II in glioma invasion of the brain. Mol Biol Cell 19: 3357-3368 [11] under a CC BY license, with permission from American Society for Cell Biology, original copyright 2008. (See S1 File) (Right) A schematic representation of diffuse infiltration of glioma cells. Arrowhead = blood vessels, asterisk = active tumor growth, arrow = tumor cells migrating along white matter tracks.
Fig 2
Fig 2. Nucleus deformation during cell migration in the glioma tissue.
(A–A′′′, B–B′′′) Experimental observation of simultaneous cell body and nuclear deformation during migration through normal brain cells in a PDGF-driven glioma model [11]. (A, A′) A GFP-expressing human glioma cell (green) with staining of nuclear DAPI in (A) and GFP in (A′). (A′′) = strong red immunostaining for myosin IIA. (A′′′) = a merged image from (A), (A′), (A′′). (B, B′) Another infiltrating human glioma cell with DAPI and GFP staining. Strong red staining for myosin IIB was shown in (B′′). White arrows = focal deformation of the cell body, bar in (A) = 10 μm. Reprinted from Beadle C, Assanah M, Monzo P, Vallee R, Rosenfield S, et al. (2008) The role of myosin II in glioma invasion of the brain. Mol Biol Cell 19: 3357-3368 [11] under a CC BY license, with permission from American Society for Cell Biology, original copyright 2008. See the main text for the detailed experimental setting. (C) A schematic of glioma cell migration through normal cells in the brain in response to biochemical signals [11]. Yellow star = a strong biochemical signal (s), green star = a weak biochemical signal (w). The bottom figure illustrates the nucleus position over time.
Fig 3
Fig 3. Discretized schematics of a mathematical model.
(A) A schematic of glioma cell infiltration through narrow intercellular space (IS) between normal resident glial cells in the direction (green arrow) of a chemotactic source (red star; *). A glioma cell is described by two elastic closed curves, representing the outer cell boundary (blue solid lines) and the boundary of the nucleus (red solid lines; ‘N’). The boundaries consist of elastic springs connected by nodes. Resident normal cells (black dashed lines) are treated in a similar fashion but without the nucleus. Normal cells are assumed to be relaxed and passively respond to biochemical and biomechanical stimuli, in other words, cells are tethered in the tissue (red lines and box). (B) During the elongation step, active force is generated at the front of the cell body and adhesion onto the substrate is formed at the rear of the cell. (C) In the retraction step, the glioma cell pulls both cell body and nucleus forward by forming attachment at the front and releasing the attachment of the rear edge.
Fig 4
Fig 4. Schematics of the deformation of cell body during elongation and retraction steps.
Schematic of changes in the cell body length (L(t) in (A)) and the rate of change of cell length (L′(t) in (B)).
Fig 5
Fig 5. Schematics of the deformation of nucleus in wild type and MYOII-KD.
Schematic of changes in the nucleus length (N(t) in (A)) and nucleus position (B) for the wild type and MYOII-KD case. IFS stands for the intermediate free space.
Fig 6
Fig 6. Dynamics of the acto-myosin module in response to fluctuating sensing pressure in the microenvironment.
(A) Periodic sensing pressure averaged over the cell membrane. (B) Time courses of myosin II concentrations ([mb]; upper panel) and stiffening rates of the nucleus (r[mb]; lower panel) for various ratios of K (K = k1/k−1 = 4, 10, 20) in response to the fluctuating sensing pressure ps(t) in (A). (C) Time courses of stiffening rates of the nucleus for various Hill coefficient (n = 1, 5, 10) in response to the fluctuating sensing pressure ps(t) in (A). (D) Time courses of 1/[mb] (upper panel) and stiffening rates of the nucleus (r[mb]; lower panel) for various values of Kmb (Kmb = 0.9, 1.8, 3.6) in response to the fluctuating sensing pressure ps(t) in (A).
Fig 7
Fig 7. Experiments and simulation results using a mathematical model.
(A-C) Experimental results of a GFP-expressing rat glioma cell. Time courses of the profiles of a moving glioma cell in (A) show the deformation of the cell body during cell translocation. Micrographs taken at 3-min intervals (t = 0, 3, 6, 9, 12, 15, 18, 21 min). Red arrowhead = a focal point between the cell body and the swelling in the leading edge. Micrographs of a section stained for GFP (green; moving glioma cell) and DAPI (blue; resident brain cells) show GFP-expressing glioma cells at distinct two phases of the migration in (B,C). While the nucleus (white arrow) is separated from a prominent dilatation at the front (yellow arrowhead) in the first step (BB′′), a focal deformation of the nucleus (red arrow) and cell body is observed in the next step (CC′′). Bars, 10μm. Reprinted from Beadle C, Assanah M, Monzo P, Vallee R, Rosenfield S, et al. (2008) The role of myosin II in glioma invasion of the brain. Mol Biol Cell 19: 3357-3368 [11] under a CC BY license, with permission from American Society for Cell Biology, original copyright 2008. (D) Time courses of cell morphology as a glioma cell migrates through a narrow gap between two glial cells in the brain. Bars, 10μm. Profiles of a glioma cell with deforming nucleus (dark green) at t = 0, 3, 6, 9, 12, 15, 18, 21 min are shown in the presence of two normal cells (gray region with dotted line cell boundaries).
Fig 8
Fig 8. Dynamics of elongation and retraction of a infiltrating glioma cell in a narrow intercellular gap (IS) between normal glial cells.
(A) Cell deformation and velocity field (red arrows) near a moving glioma cell (double blue solid curves) and normal glial cells (dashed circles) during the elongation steps at t = 21, 81 min and retraction steps at t = 23, 83 min. (B) Spatial distribution of pressure along the cell membrane at t = 30, 60, 90, 120 min as it pushes through a narrow gap.
Fig 9
Fig 9. Dynamics of cell infiltration in wild type and MYOII-KD case.
(A,B) Time evolution of profiles of migratory glioma cells (blue circles) in the presence (wild type in (A)) and absence (MYOII-KD in (B)) of myosin II at t = 0, 60, 120, 180 min. Black circle = the normal glial cells, blue outer circle = the membrane of a glioma cell, blue inner circle = nucleus of a glioma cell. (C,D) Time courses of the distance traveled (the front and rear of the cell membrane and nucleus) in wild type (C) and MYOII-KD (D). (E) Average speed of the glioma cell for the wild type and MYOII-KD. (F) Histograms of the average migratory speeds of rat glioma cells in the absence (red) and presence of (blue) 50 μM blebbistatin, a biochemical inhibitor of myosin II. The average cell speed is decreased in the presence of the inhibitor, blebbistatin. Reprinted from Beadle C, Assanah M, Monzo P, Vallee R, Rosenfield S, et al. (2008) The role of myosin II in glioma invasion of the brain. Mol Biol Cell 19: 3357-3368 [11] under a CC BY license, with permission from American Society for Cell Biology, original copyright 2008.
Fig 10
Fig 10. Spatial dynamics of chemoattractant.
(A,B) Profiles of chemoattractants at t = 180 min when the source of the chemoattractant was located (A) in the middle of top, where (x, y) = (0.05, 0.09) and (B) near the top right of the domain, where (x, y) = (0.07, 0.09).
Fig 11
Fig 11. Bio-mechanical responses in wild type and MYOII-KD case.
(A,B) Time courses of the cell length L (A) and the rate change L′(t) of the cell length (B) in wild type and MYOII-KD. (C) Time courses of deformation Ld,n of the nucleus in wild type and MYOII-KD. (D) Time courses of the average sensing pressure (ps; top panel), myosin II level ([mb]; middle panel), and the stiffening rate (r[mb]; bottom panel) in wild type and MYOII-KD.
Fig 12
Fig 12. Cell infiltration in response to the chemoattractant.
(A) Time evolution of profiles of a migratory glioma cell (blue circles) at t = 0, 80, 160, 320 min in response to the gradient of a chemoattractant on the top-right corner of the domain (red star). Black circle = the normal glial cells, blue outer circle = the membrane of a glioma cell, blue inner circle = nucleus of the glioma cell. (B) Time courses of the deformation of the nucleus to the left (Ld,n,W) and to the right (Ld,n,E(t)).
Fig 13
Fig 13. Dynamics of cell infiltration in multiple layers of normal cells.
(A) Time evolution of profiles of a migratory glioma cell (blue circle) through a network of normal cells (black circles) at times t = 60, 180, 300, 392 min. Red star (*) = a chemotactic source, red circles = initial configuration of the glioma cell. (B,C) Time courses of the nucleus position and the longitudinal length of the nucleus of the glioma cell, respectively. Filled squares indicate the times given in (A). The nucleus position is obtained from keeping track of the y-component of the bottom point of the nucleus and the longitudinal nucleus length is measured by the distance between the top and bottom points of the nucleus.
Fig 14
Fig 14. Therapeutic strategies (Localization of the glioma cells).
(A-C) Effect of the different strength λinC of the chemotactic source on migration patterns of a glioma cell (wild type; blue curves) at the final time t = 392 min: λinC = 0.14 (A), 0.82 (B), 1.64 (C). Red star (*) = a chemotactic source, red circles = the initial configuration of a glioma cell. (D-F) Profiles of the chemoattractant at the final time for the corresponding three cases in (A-C). (G) Anti-invasion treatment efficacy for those three cases in (A-C).
Fig 15
Fig 15. Dynamics for various strengths of chemotactic sources.
(A) Migration distance for various strengths of chemotactic sources (λinC = 0.14, 0.82, 1.64). (B) Concentration level of the chemoattractant along the vertical center line at t = 392 min when λinC = 1.64. (C) Time courses of chemotaxis-driven active force strength (|FC|). (D) Time courses of deformation Ld,n of the nucleus.
Fig 16
Fig 16. Internal acth-myosin dynamics for various strengths of chemotactic sources.
Time courses of the average sensing pressure (ps; top panel), the concentration of bound myosin II ([mb]; middle panel), and the stiffening rate (r[mb]; bottom panel) during the cell migration for three cases in Fig 14.
Fig 17
Fig 17. Cell migration through complex microenvironment.
Migration of a tumor cell through a dense network of normal cells in the brain. The normal cells were placed in a zig-zag fashion and the chemotactic source was located at the top of the computational domain. (A) A profile of the migratory glioma cell through normal cells (black dashed circles) at t = 0 (red solid), 60 (blue solid), 180 (black solid), 360 (cyan solid), 600 (light blue solid), 960 (green solid) min. (B) Time courses of the averaged speed. (C) Time courses of shape deformations (Ld,n,Ld,n,W,Ld,n,E) of the nucleus. (D) Direction change (angle from the vertical axis) of the cell shown in panel (A) over the time course of 960 min. Positive values indicate that the cell moves in the north-east direction and negative values indicate that the cell moves in the north-west direction. The black arrows and arrowheads in (D) mark the corresponding times at which the cell changes its moving direction.
Fig 18
Fig 18. Analysis of passing time in response to microenvironmental complexity.
(A,B) Initial configurations of six normal glial cells (dotted circle) and a migratory glioma cell (double circles) when the turning angles are given as θ = 11.3° (A) and θ = 21.8° (B), respectively. Here, θ = angle between two vectors connecting centers of two static normal glial cells: one for cells in the first and third rows, and another for cells in the first and second rows. The distance between two cells in each row is fixed. (C) Time at which a migratory glioma cell travels given distances (x-axis) under various degrees of complexities of normal cells (θ = 11.3° (empty circle), 16.7° (triangle), 21.8° (square)).
Fig 19
Fig 19. Patterns of glioma infiltration in different intra- and extra-cellular microenvironment.
(A) Different patterns of two migratory glioma cells at final time t = 60 min for various distances between two astrocytes (d = 3, 4, 5, 6 μm) and different nuclear stiffness (fold) of a glioma cell located in the center. The default parameter value of the elastic stiffness of nucleus is ceGn,b=3.8×10⁻⁵g·cm/s2. (B,C) A migration profile and stiffening rate (r[mb]) of two migratory glioma cells at time t = 0, 20, 40, 60 mins when d = 4μm and nuclear stiffness is a fold-change of 1 for the migratory glioma cell in the center. The default parameter value was used for the glioma cell on the left.
Fig 20
Fig 20. Patterns of glioma infiltration under perturbation of actin-myosin reactions and different microenvironment.
(A) Different patterns of two migratory glioma cells at final time t = 60 min for various distances between two astrocytes (d = 3, 4, 5, 6 μm) and acto-myosin association rates (k1 = 0.0004, 0.001, 0.002, 0.004, 0.01 μM−1 s−1). (B) Distribution of the bound myosin II level ([mb]) of the glioma cell for different k1 and various distances d = 3, 4, 5, 6 μm simulated in (A). Each color indicates the change in concentration of the bound myosin II for 20 minutes.
Fig 21
Fig 21. Therapeutic strategies: inhibition of tumor infiltration using blebbistatin.
(A) Time courses of blebbistatin level, concentrations of bound myosin II ([mb]), and stiffening rate of nucleus (r[mb]) in response to blebbistatin injection with two different doses (τB = 2, IB = 1 and τB = 2, IB = 5). (B) Profile of a glioma cell in the presence of blebbistatin injection with τB = 2, IB = 1 (blue solid curve) and τB = 2, IB = 5 (red dotted curve). The relatively low dose of blebbistatin (IB = 1) cannot sufficiently decrease the bound myosin II level and hence the stiffening rate of the nucleus is lowered, resulting in invasion of the glioma cell through the narrow gap. When the injection strength is increased (IB = 5), the glioma cell cannot infiltrate the narrow intercellular space between two normal cells.
Fig 22
Fig 22. Optimal anti-invasion strategies of blebbistatin injection.
Passing time of the glioma cell through the intercellular space between two glial cells for various dose schedules (τB = 1, 2, 3, 4, 5 hours) and injection strength (IB = 1, 5, 10, 20, 30). *Blue = non-invasive glioma cell, red = the glioma cell in the process of infiltration through the gap, yellow = complete infiltration of the cell.
Fig 23
Fig 23. Therapeutic strategies: Inhibition of the activity of actin-myosin reactions.
(A) Time courses of drug concentration, bound myosin II level ([mb]), and stiffening rate of nucleus (r[mb]) in response to inhibitor injection with two different schedules (τD = 3, ID = 5 and τD = 4, ID = 5). (B) Profile of a glioma cell in response to inhibitor injection with τD = 3, ID = 5 (blue solid curve) and τD = 4, ID = 5 (red dotted curve). The frequent dose of inhibitor (τD = 3) can keep the bound myosin II level low and maintain the stiff nucleus, resulting in inhibition of cell infiltration (blue). When this dose schedule is relaxed to τD = 4, the inhibitor drug is unable to suppress the accumulation of the bound myosin II, leading to flexible nucleus and glioma cell infiltration.
Fig 24
Fig 24. Optimal anti-invasion strategies for drugs that inhibit the activity of actin-myosin reactions.
Passing time of the glioma cell through the intercellular space between two glial cells for various dose schedules (τD = 1, 2, 3, 4, 5 hours) and injection strength (ID = 1, 5, 10, 20, 30). *Blue = non-invasive glioma cell, red = the glioma cell in the process of infiltration through the gap, yellow = complete infiltration of the cell.

References

    1. Charles NA, Holland EC, Gilbertson R, Glass R, Kettenmann H. The brain tumor microenvironment. Glia. 2011;59:1169–1180. 10.1002/glia.21136 - DOI - PubMed
    1. Chintala SK, Tonn JC, Rao JS. Matrix metalloproteinases and their biological function in human gliomas. Int J Dev Neurosci. 1999;17(5-6):495–502. 10.1016/S0736-5748(99)00010-6 - DOI - PubMed
    1. Lund-Johansen M, Bjerkvig R, Humphrey PA, Bigner SH, Bigner DD, Laerum OD. Effect of epidermal growth factor on glioma cell growth, migration, and invasion in vitro. Cancer Res. 1990;50(18):6039–44. - PubMed
    1. Kim Y, Lawler S, Nowicki MO, Chiocca EA, Friedman A. A mathematical model of brain tumor: pattern formation of glioma cells outside the tumor spheroid core. J Theo Biol. 2009;260:359–371. 10.1016/j.jtbi.2009.06.025 - DOI - PubMed
    1. Watters JJ, Schartner JM, Badie B. Microglia function in brain tumors. J Neurosci Res. 2005;81(3):447–55. 10.1002/jnr.20485 - DOI - PubMed