

Insights from NMR Spectroscopy into the Conformational Properties of Man-9 and Its Recognition by Two HIV Binding Proteins
- PMID: 28166380
- PMCID: PMC5557091
- DOI: 10.1002/cbic.201600665
Insights from NMR Spectroscopy into the Conformational Properties of Man-9 and Its Recognition by Two HIV Binding Proteins
Abstract
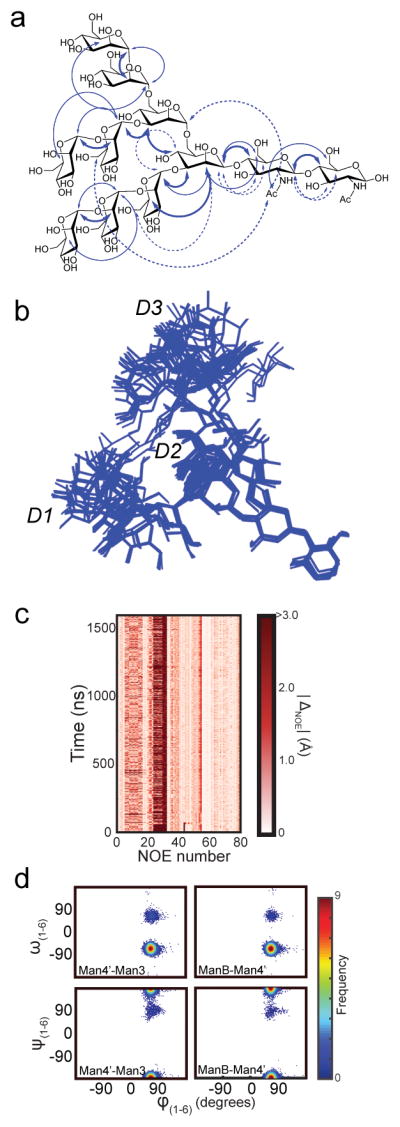
Man9 GlcNAc2 (Man-9) present at the surface of HIV makes up the binding sites of several HIV-neutralizing agents and the mammalian lectin DC-SIGN, which is involved in cellular immunity and trans-infections. We describe the conformational properties of Man-9 in its free state and when bound by the HIV entry-inhibitor protein microvirin (MVN), and define the minimum epitopes of both MVN and DC-SIGN by using NMR spectroscopy. To facilitate the implementation of 3D 13 C-edited spectra to deconvolute spectral overlap and to determine the solution structure of Man-9, we developed a robust expression system for the production of 13 C,15 N-labeled glycans in mammalian cells. The studies reveal that Man-9 interacts with HIV-binding proteins through distinct epitopes and adopts diverse conformations in the bound state. In combination with molecular dynamics simulations we observed receptor-bound conformations to be sampled by Man-9 in the free state, thus suggesting a conformational selection mechanism for diverse recognition.
Keywords: NMR spectroscopy; carbohydrate recognition; glycan conformation; isotopic labeling; molecular dynamics.
© 2017 Wiley-VCH Verlag GmbH & Co. KGaA, Weinheim.
Figures


Similar articles
-
Solution structure of the monovalent lectin microvirin in complex with Man(alpha)(1-2)Man provides a basis for anti-HIV activity with low toxicity.J Biol Chem. 2011 Jun 10;286(23):20788-96. doi: 10.1074/jbc.M111.232678. Epub 2011 Apr 6. J Biol Chem. 2011. PMID: 21471192 Free PMC article.
-
Microvirin, a novel alpha(1,2)-mannose-specific lectin isolated from Microcystis aeruginosa, has anti-HIV-1 activity comparable with that of cyanovirin-N but a much higher safety profile.J Biol Chem. 2010 Aug 6;285(32):24845-54. doi: 10.1074/jbc.M110.128546. Epub 2010 May 27. J Biol Chem. 2010. PMID: 20507987 Free PMC article.
-
Solution NMR analyses of the C-type carbohydrate recognition domain of DC-SIGNR protein reveal different binding modes for HIV-derived oligosaccharides and smaller glycan fragments.J Biol Chem. 2013 Aug 2;288(31):22745-57. doi: 10.1074/jbc.M113.458299. Epub 2013 Jun 20. J Biol Chem. 2013. PMID: 23788638 Free PMC article.
-
Sugar and spice: viral envelope-DC-SIGN interactions in HIV pathogenesis.Curr HIV Res. 2003 Jan;1(1):87-99. doi: 10.2174/1570162033352129. Curr HIV Res. 2003. PMID: 15043214 Review.
-
Interaction of human immunodeficiency virus (HIV) glycans with lectins of the human immune system.Curr Protein Pept Sci. 2006 Aug;7(4):317-24. doi: 10.2174/138920306778017990. Curr Protein Pept Sci. 2006. PMID: 16918446 Review.
Cited by
-
Structural Characterization of N-Linked Glycans in the Receptor Binding Domain of the SARS-CoV-2 Spike Protein and their Interactions with Human Lectins.Angew Chem Int Ed Engl. 2020 Dec 21;59(52):23763-23771. doi: 10.1002/anie.202011015. Epub 2020 Oct 22. Angew Chem Int Ed Engl. 2020. PMID: 32915505 Free PMC article.
-
Metastable HIV-1 Surface Protein Env Sensitizes Cell Membranes to Transformation and Poration by Dual-Acting Virucidal Entry Inhibitors.Biochemistry. 2020 Feb 18;59(6):818-828. doi: 10.1021/acs.biochem.9b01008. Epub 2020 Jan 28. Biochemistry. 2020. PMID: 31942789 Free PMC article.
-
Glycosylator: a Python framework for the rapid modeling of glycans.BMC Bioinformatics. 2019 Oct 22;20(1):513. doi: 10.1186/s12859-019-3097-6. BMC Bioinformatics. 2019. PMID: 31640540 Free PMC article.
-
Catanionic Vesicles as a Facile Scaffold to Display Natural N-Glycan Ligands for Probing Multivalent Carbohydrate-Lectin Interactions.Bioconjug Chem. 2023 Feb 15;34(2):392-404. doi: 10.1021/acs.bioconjchem.2c00560. Epub 2023 Jan 15. Bioconjug Chem. 2023. PMID: 36642983 Free PMC article.
-
Chemical and Biophysical Approaches for Complete Characterization of Lectin-Carbohydrate Interactions.Methods Enzymol. 2018;598:3-35. doi: 10.1016/bs.mie.2017.06.010. Epub 2017 Jul 23. Methods Enzymol. 2018. PMID: 29306440 Free PMC article.
References
Publication types
MeSH terms
Substances
Grants and funding
LinkOut - more resources
Full Text Sources
Other Literature Sources
