. 2017 Feb 23;542(7642):484-488.
doi: 10.1038/nature21357. Epub 2017 Feb 6.

Synthetic essentiality of chromatin remodelling factor CHD1 in PTEN-deficient cancer

Affiliations

Synthetic essentiality of chromatin remodelling factor CHD1 in PTEN-deficient cancer

Di Zhao et al. Nature. .

Abstract

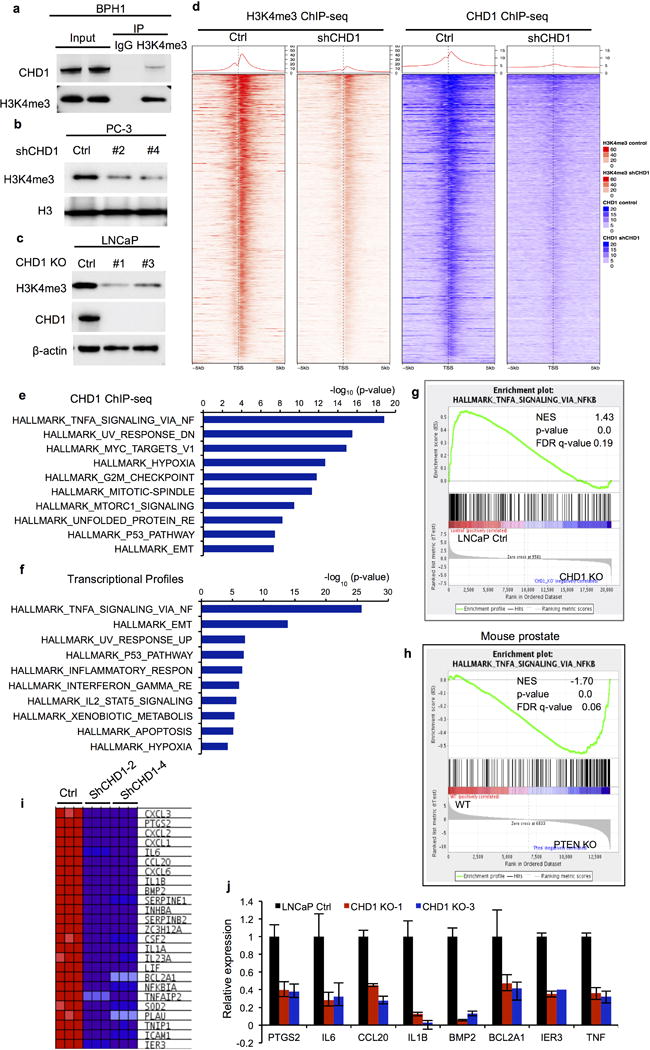
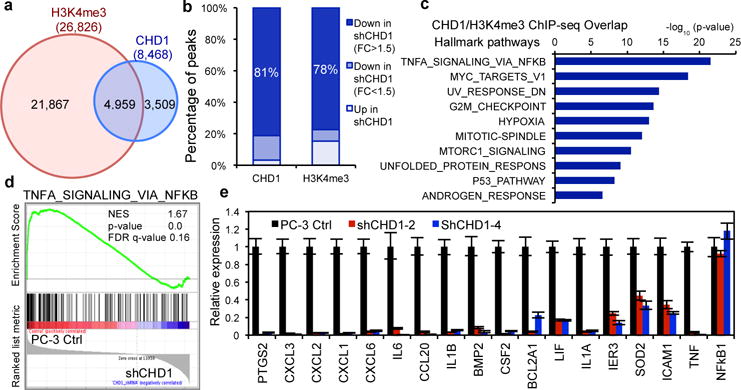
Synthetic lethality and collateral lethality are two well-validated conceptual strategies for identifying therapeutic targets in cancers with tumour-suppressor gene deletions. Here, we explore an approach to identify potential synthetic-lethal interactions by screening mutually exclusive deletion patterns in cancer genomes. We sought to identify 'synthetic-essential' genes: those that are occasionally deleted in some cancers but are almost always retained in the context of a specific tumour-suppressor deficiency. We also posited that such synthetic-essential genes would be therapeutic targets in cancers that harbour specific tumour-suppressor deficiencies. In addition to known synthetic-lethal interactions, this approach uncovered the chromatin helicase DNA-binding factor CHD1 as a putative synthetic-essential gene in PTEN-deficient cancers. In PTEN-deficient prostate and breast cancers, CHD1 depletion profoundly and specifically suppressed cell proliferation, cell survival and tumorigenic potential. Mechanistically, functional PTEN stimulates the GSK3β-mediated phosphorylation of CHD1 degron domains, which promotes CHD1 degradation via the β-TrCP-mediated ubiquitination-proteasome pathway. Conversely, PTEN deficiency results in stabilization of CHD1, which in turn engages the trimethyl lysine-4 histone H3 modification to activate transcription of the pro-tumorigenic TNF-NF-κB gene network. This study identifies a novel PTEN pathway in cancer and provides a framework for the discovery of 'trackable' targets in cancers that harbour specific tumour-suppressor deficiencies.


Conflict of interest statement

The authors declare no competing financial interests.

Figures

Extended Data Figure 1
Extended Data Figure 1. Mutually exclusive deletion patterns in prostate cancer genome
Genetic alterations of (a) BRCA1/PARP1, (b) PTEN/PARP1 and PTEN/PLK4, (c) CHD1/PTEN, and (d) PTEN/CHD homologues in PCa databases. The gene alteration percentages are shown.
Extended Data Figure 2
Extended Data Figure 2. Inhibiting CHD1 suppresses tumor growth of PTEN-null prostate cancer (PCa)
(a) Representative images of PTEN staining (Scores 0–2). Staining magnification: 40x. (b) The negative correlation between CHD1 and PTEN staining in human PCa samples was analyzed by two-tailed Pearson correlation coefficient. (c) The correlation between CHD1 staining and Gleason Grade in human PCa samples was analyzed by two-tailed Pearson correlation coefficient. (d-e) Representative CHD1 staining and immunoblots of lysates of prostate tissues of wild-type and prostate-specific Pten deletion mice (Ptenpc−/−). AP: Anterior prostate; DLP: Dorsal lateral prostate; VP: Ventral prostate. Scale bar: 50 μm. pAKT indicates phosphorylation of AKT at Ser473. (f) Immunoblots of lysates generated from CHD1 knockout and control LNCaP cells. Cell proliferation was determined by counting cell numbers in triplicate wells. (g) CHD1 knockout and control LNCaP cells were stained with Annexin V PE and DAPI, and cell apoptosis was detected by flow cytometry. (h-j) Immunoblots of lysates and colony formation assays generated from CHD1 knockdown and control LNCaP cells, PtenSmad4 3132 cells (a mouse prostate cancer cell line generated from the Pten/Smad4 co-deletion prostate cancer mouse model) or PtenCap8 cells (a mouse prostate cancer cell line generated from the Pten deletion prostate cancer mouse model). (k) Representative migration images of CHD1 knockdown and control PC-3 cells determined by transwell assay. (l) Measurement of subcutaneous tumor weight of CHD1 knockdown and control PC-3 cells. (N=10 for both control and shCHD1 #2 groups; N=8 for shCHD1 #4 group). (m) Measurement of subcutaneous tumor growth of CHD1 knockdown and control LNCaP cells. (N=10 for both control and shCHD1 #2 groups; N=8 for shCHD1 #4 group). (n) Representative images and quantification of CHD1 and Caspase-3 staining in subcutaneous tumor tissues generated by CHD1 knockdown and control PC-3 cells (N=4). Scale bar: 50 μm. (o) Patient-derived xenograft (PDX) model mice were treated by siRNA targeting CHD1 at 3 time points (40μg/tumor/time). Fold changes of tumor volume are shown (siCtrl group N=6; siCHD1 group N=7). (p) Representative images and quantification of CHD1 staining of xenograft tumor tissues generated from (o) (N=4). PTEN status of the PDX tumor was shown. Scale bar: 100 μm. Error bars in (f, l-m, p) indicate standard deviation (S.D.). P values were determined by two-tailed t-test.
Extended Data Figure 3
Extended Data Figure 3. Targeting CHD1 has minimal impact on tumor growth of PTEN-intact prostate cancer (PCa)
(a) Immunoblots of lysates and colony formation assays generated from CHD1 knockdown and control 22Rv1 cells, followed by measurement of subcutaneous tumor growth in vivo (Ctrl group N=8; shCHD1 group N=7). (b) Immunoblots of lysates and colony formation assays generated from CHD1 knockdown and control RWPE-2 cells. (c) Immunoblots of lysates and colony formation assays generated from CHD1 knockdown wild-type or PTEN-knockout DU145 cells. (d) Measurement of subcutaneous tumor weight of CHD1 knockdown DU145 cells (N=5 for PTEN KO shCHD1 group; other group N=6). (e) CHD1 mRNA levels were detected by qRT-PCR in PC-3 cells overexpressing PTEN. Error bars represent ± S.D. of triplicated experiments. (f) Immunoblot time courses of CHD1 protein in control PC-3 (GFP) and PTEN-overexpressing (HA-PTEN) cells treated with 50μg/ml cycloheximide (CHX). (C-Myc as positive control; LDH-A as negative control). (g) Immunoblot time courses of CHD1 protein in LNCaP and 22Rv1 cells treated with cycloheximide (CHX). (h) Immunoblot of CHD1 protein in PTEN-intact and -deficient cell lines. Error bars in (a, d) indicate standard deviation (S.D.). P values were determined by two-tailed t-test. N.S.: not significant.
Extended Data Figure 4
Extended Data Figure 4. PTEN-AKT-GSK3β pathway promotes CHD1 degradation through β-TrCP mediated ubiquitination-proteasome
(a) HA-tagged ubiquitin (HA-Ub) was transfected into 293T cells for 40h, followed by 8h MG132 treatment and immunoprecipitation (IP) of endogenous CHD1. CHD1 and HA were detected by immunoblot. (b) Conservation of two β-TrCP binding motifs in vertebrates. (c-d) Immunoblots of CHD1 in BPH1 cells overexpressing Flag-tagged β-TrCP or knockdown of β-TrCP (Yap as positive control). (e) HA-Ub and si β-TrCP were transfected into 293T cells for 48 h, followed by 8 h MG132 treatment (10μM) and detection of CHD1-ubiquitination by IP-immunoblot. (f) V5-tagged WT or two β-TrCP binding motif mutants (DSGXXS => DAGXXA) of CHD1 were introduced into BPH1 cells, followed by CHX treatment over a time course, and V5-tagged CHD1 was detected by immunoblot. (g-h) V5-tagged WT, the two β-TrCP binding motif mutants of CHD1 were introducted into BPH1 cells, followed by V5-IP and detection of ubiquitination and β-TrCP binding by immunoblot. (i) Schematic diagram of GSK3β substrates consensus sequences in β-TrCP binding motifs of CHD1. (j) Endogenous CHD1 was immunoprecipitated, followed by immunoblot using GSK3β antibody. (k) Overexpressing PTEN LNCaP cells were treated with 2μM CHIR for 24h, and CHD1 protein levels were detected by immunoblot. β-actin was used as loading control.
Extended Data Figure 5
Extended Data Figure 5. CHD1 collaborates with H3K4me3 to activate gene transcription
(a) Endogenous H3K4me3 was immunoprecipitated from BPH1 cells, and CHD1 binding was detected by immunoblot. (b-c) Immunoblots of H3K4me3 in CHD1 knockdown PC-3 cells or CHD1 knockout LNCaP cells. (d) Heat maps showing the CHD1 and H3K4me3 binding features across gene promoters in shCHD1 vs. Ctrl PC-3 cells (only CHD1/H3K4me3 overlap genes shown). Each panel represents 5 kb upstream and downstream of TSS. (e) Top 10 Hallmark pathways showing enrichment of CHD1 target genes identified by ChIP-seq. 50 MSigDB Hallmark pathways emerged following IPA “Core Analysis.” Graph displays category scores as –log10(p-value) from Fisher’s exact test. (f) Microarray analysis was performed in CHD1 knockdown and control PC-3 cells. Top 10 hallmark pathways showing enrichment of the down-regulated genes in shCHD1 PC-3 cells (Fold changes>1.5). (g-h) GSEA correlation of NF-κB signature with alternatively expressed genes in CHD1 knockout LNCaP cells (g), and wild-type and PTEN knockout mouse prostate tissues (h). Normalized Enrichment Score (NES), Nominal p-value and FDR q-value of correlation are shown. (i) A heat map representation of top 25 down-regulated NF-κB pathway genes in CHD1 knockdown PC-3 cells (from blue, low expression, to red, high expression). (j) Validation of CHD1 regulating genes in two individual CHD1 knockout LNCaP cells using qRT-PCR. Error bars represent ± S.D. of triplicated experiments.
Extended Data Figure 6
Extended Data Figure 6. CHD1 activates gene transcription in NF-κB pathway
(a) Heat maps showing expression of down-regulated TNFα/NF-κB pathway genes in 498 TCGA prostate samples, with all samples sorted by CHD1 expression level shown as top bar. Gene names, Pearson correlation coefficient between CHD1 and indicated genes, and two-tailed p value were shown. (b) Immunoblot of total and activated NF-κB p65 in control and CHD1 knockdown PC-3 cells. (c) CHD1/H3K4me3-enriched profiles at indicated genes in CHD1 knockdown and control PC-3 cells. (d) Colony formation assays of rescue CHD1 knockdown PC-3 cells by indicated CHD1 downstream genes of NF-κB pathway. PGE2: Prostaglandin E2, the metabolic product of PTGS2/Cox-2.
Extended Data Figure 7
Extended Data Figure 7. CHD1 shows synthetic essentiality in PTEN-deficient breast cancer
(a, b) Schematic representation of the role of CHD1 in PCa. (a) In PTEN-intact prostate cells, GSK3β is activated by PTEN through inhibition of AKT, and phosphorylates CHD1, which stimulates its degradation through β-TrCP mediated ubiquitination-proteasome pathway. (b) However, in PTEN-deficient prostate cancer cells, accumulated CHD1 interacts with and maintains H3K4me3, followed by transcriptional activation of NF-κB downstream genes leading to prostate cancer progression. (c) Mutual exclusiveness of PTEN and CHD1 deletions also occurs in breast cancer and colon cancer. (d-e) Immunoblots of lysates and colony formation assays generated from CHD1 knockdown and control BT549 and MDA-MB-468 cells. (f) Measurement of subcutaneous tumor growth of CHD1 knockdown MDA-MB-468 cells (Ctrl group N=10; shCHD1 group N=8). Error bars in indicate standard deviation (S.D.). P values were determined by two-tailed t-test. (g-h) Immunoblots of lysates and colony formation assays generated from CHD1 knockdown and control MDA-MB-231 and T47D cells.
Figure 1
Figure 1. Knockdown of CHD1 inhibits tumor growth of PTEN-null prostate cancer (PCa)
(a) Genomic alterations of CHD1 and the PTEN-AKT pathway in TCGA PCa database (N=333). (b) Representative images of CHD1 expression, and the negative correlation between CHD1 and PTEN expression in human prostatic hyperplasia and cancer samples (N=127). Staining magnification: 40x. (c) Distribution of CHD1 expression in human PCa samples with different Gleason Grades (N=90). Pearson correlation coefficient and two-tailed p value are shown. (d) Immunoblots of lysates and colony formation assays generated from CHD1 knockdown and control PC-3 cells. (e) Measurement of subcutaneous tumor growth of CHD1 knockdown and control PC-3 cells. Control N=10; shCHD1#2 N=10; shCHD1#4 N=8. (f) Representative images of Ki67 staining of subcutaneous tumor tissues generated from (e). Scale bar: 50 μm. (g) Measurement of subcutaneous tumor growth of CHD1 knockdown PTEN-intact or -deficient DU145 cells. PTEN KO shCHD1 N=5; other groups N=6 for each. Error bars in (e, g) indicate standard deviation (S.D.). P values were determined by two-tailed t-test. N.S.: not significant.
Figure 2
Figure 2. PTEN inhibits CHD1 by decreasing its protein stability
(a) Immunoblots of lysates generated from human PC-3 and LNCaP cells overexpressing PTEN. (b) Co-staining of CHD1 and PTEN by immunofluorescence in PC-3 cells overexpressing GFP-PTEN. The yellow arrows indicate GFP-PTEN negative cells. Scale bar: 100 μm. (c) Immunoblot of CHD1 protein in LNCaP cells treated with 2μM AKT inhibitor (MK2206). pAKT: phosphorylation of AKT at Ser473.
Figure 3
Figure 3. PTEN promotes CHD1 degradation through SCFβ-TrCP mediated ubiquitination-proteasome pathway
(a) Detection of CHD1 in BPH1 cells treated with 10μM MG132 (HIF-1α as positive control). (b) PTEN and HA-Ub were transfected, followed by 8h MG132 treatment and immunoprecipitation (IP) of endogenous CHD1. CHD1 and HA were detected by immunoblot. (c) Schematic diagram of two β-TrCP binding motifs (DSGXXS) in CHD1. (d) Co-IP using CHD1 antibody, followed by detection of β-TrCP via immunoblot. (e) Immunoblot of CHD1 in 293T cells overexpressing Flag-tagged β-TrCP (Yap and IKBα as positive control). (f) Flag-tagged β-TrCP and HA-Ub were transfected; endogenous CHD1 was immunoprecipitated and CHD1 ubiquitination was detected. (g) HA-tagged WT and constitutively active mutant (S9A) GSK3β were transfected into LNCaP cells, and phospho- and unphospho-CHD1 proteins were separated using Phos-tag gel by immunoblot. Total CHD1 protein as loading control; C-Myc as positive control. (h) Immunoblot of CHD1 in LNCaP cells transfected with HA-tagged GSK3β. β-actin as loading control. (i) HA-Ub was transfected, followed by 2μM CHIR (24h) and 10μM MG132 (8h) treatment and detection of CHD1-ubiquitination by IP-immunoblot.
Figure 4
Figure 4. CHD1 collaborates with H3K4me3 to activate gene transcription in the NF-κB pathway in PTEN-deficient PCa
(a) Venn diagrams showing the overlap of peak sets identified from the duplicate-merged CHD1 and H3K4me3 ChIP-seq in PC-3 cells. Blue cycle: CHD1 peaks; Red cycle: H3K4me3 peaks. (b) Percentage of decreased CHD1 or H3K4me3 ChIP-seq peaks in CHD1 knockdown PC-3 cells. (c) Top 10 Hallmark pathways showing enrichment of CHD1 and H3K4me3 ChIP-seq overlap genes. 50 MSigDB Hallmark pathways emerged following IPA “Core Analysis”. Graph displays category scores as –log10 (p-value) from Fisher’s exact test. (d) GSEA correlation of NF-κB signature with alternatively expressed genes in CHD1 knockdown PC-3 cells. Normalized Enrichment Score (NES), Nominal p-value and FDR q-value of correlation are shown. (e) Validation of CHD1 regulating genes in CHD1 knockdown PC-3 cells using qRT-PCR. Error bars represent ± S.D. of triplicated experiments.

Comment in

References

    1. Hartwell LH, Szankasi P, Roberts CJ, Murray AW, Friend SH. Integrating genetic approaches into the discovery of anticancer drugs. Science. 1997;278:1064–1068. - PubMed
    1. Farmer H, et al. Targeting the DNA repair defect in BRCA mutant cells as a therapeutic strategy. Nature. 2005;434:917–921. doi: 10.1038/nature03445. - DOI - PubMed
    1. Muller FL, et al. Passenger deletions generate therapeutic vulnerabilities in cancer. Nature. 2012;488:337–342. doi: 10.1038/nature11331. - DOI - PMC - PubMed
    1. Cairns P, et al. Frequent inactivation of PTEN/MMAC1 in primary prostate cancer. Cancer Res. 1997;57:4997–5000. - PubMed
    1. Wang S, et al. Prostate-specific deletion of the murine Pten tumor suppressor gene leads to metastatic prostate cancer. Cancer cell. 2003;4:209–221. doi:S1535610803002150 [pii] - PubMed

Publication types

MeSH terms