Comparative Study
. 2017 Feb 6;17(1):42.
doi: 10.1186/s12862-017-0890-6.

bModelTest: Bayesian phylogenetic site model averaging and model comparison

Affiliations
Comparative Study

bModelTest: Bayesian phylogenetic site model averaging and model comparison

Remco R Bouckaert et al. BMC Evol Biol. .

Abstract

Background: Reconstructing phylogenies through Bayesian methods has many benefits, which include providing a mathematically sound framework, providing realistic estimates of uncertainty and being able to incorporate different sources of information based on formal principles. Bayesian phylogenetic analyses are popular for interpreting nucleotide sequence data, however for such studies one needs to specify a site model and associated substitution model. Often, the parameters of the site model is of no interest and an ad-hoc or additional likelihood based analysis is used to select a single site model.

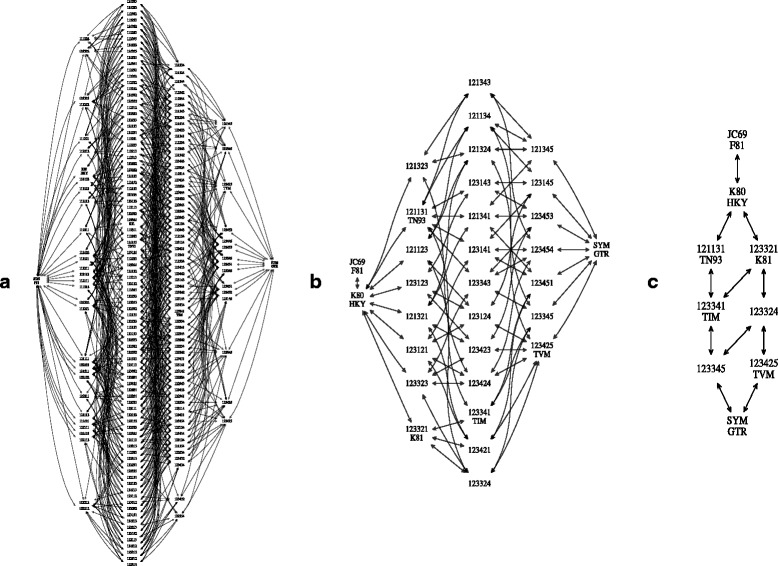
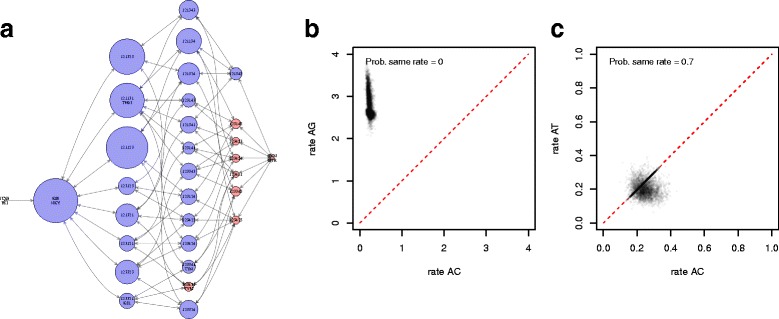
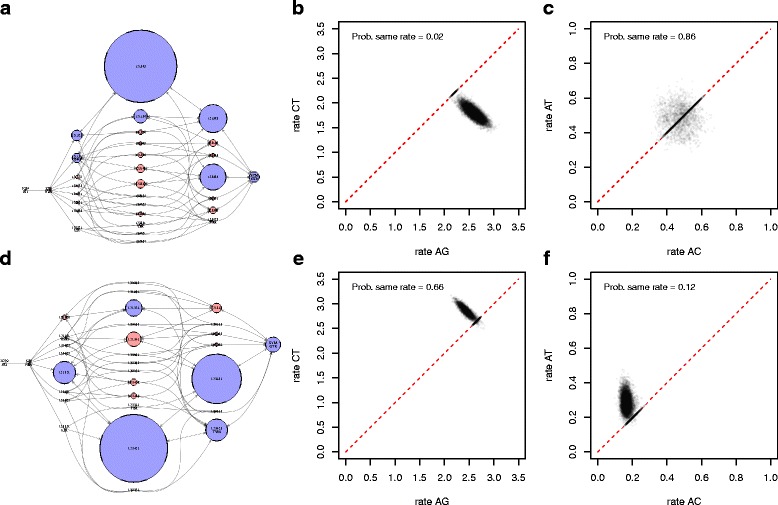
Results: bModelTest allows for a Bayesian approach to inferring and marginalizing site models in a phylogenetic analysis. It is based on trans-dimensional Markov chain Monte Carlo (MCMC) proposals that allow switching between substitution models as well as estimating the posterior probability for gamma-distributed rate heterogeneity, a proportion of invariable sites and unequal base frequencies. The model can be used with the full set of time-reversible models on nucleotides, but we also introduce and demonstrate the use of two subsets of time-reversible substitution models.

Conclusion: With the new method the site model can be inferred (and marginalized) during the MCMC analysis and does not need to be pre-determined, as is now often the case in practice, by likelihood-based methods. The method is implemented in the bModelTest package of the popular BEAST 2 software, which is open source, licensed under the GNU Lesser General Public License and allows joint site model and tree inference under a wide range of models.

Keywords: Model averaging; Model comparison; Model selection; ModelTest; Phylogenetic model averaging; Phylogenetic model comparison; Site model; Statistical phylogenetics; Substitution model.


Figures

Fig. 1
Fig. 1
Model spaces. The model spaces supported by bModelTest. a All reversible models, b transition/transversion split models, and c named models. Arrows indicate which models can be reached by splitting a model. Note all models with the same number of groupings are at the same height
Fig. 2
Fig. 2
Accuracy of estimated substitution rates. True rates (horizontal) against estimated rates (vertical) in simulated data for 3 taxa. In reading order, rate AC, AG, AT, CG, CT and GT. Diamonds are for estimates when no rate heterogeneity was used to simulate the data, circles are for estimates with rate heterogeneity. Error bars represent 95% HPD intervals for each estimate
Fig. 3
Fig. 3
Accuracy of inference of rate heterogeneity across sites. Posterior probability for inclusion of gamma rate heterogeneity when the data is generated without (left) and with (middle) rate heterogeneity for 5 taxa. Right, True gamma shape parameter (horizontal) against estimated shape parameter (vertical) when rate heterogeneity is used to generate the data
Fig. 4
Fig. 4
Accuracy of inference of proportion of invariant sites. Posterior probability for inclusion of a proportion of invariant sites when the data is generated without (left) and with (middle) invariant sites for 5 taxa. Right, empirical proportion invariant in alignment (horizontal) against estimated proportion of invariant sites (vertical) when a proportion invariable category is used to generate the data
Fig. 5
Fig. 5
Posterior inference on primate data. Model distribution for primate data using the transition/transversion split models (left). Numbers on x-axis correspond to models in Additional file 1: Appendix. The middle panel plots rates AC versus AG (middle) and the right panel plots AC versus AT
Fig. 6
Fig. 6
Posterior inference on HCV data. Like Fig. 5, but the data is split into two partitions, the first containing codon positions 1+2 (panel a, b and c) and second containing codon position 3 (panel d, e and f). The partitions support distinctly different site models. The left panels show the posterior distribution over models, the middle panel plots transition rates AG versus CT, and the right panel plots transversion rates AC versus AT

References

    1. Posada D, Crandall KA. Modeltest: testing the model of dna substitution. Bioinformatics. 1998;14(9):817–8. doi: 10.1093/bioinformatics/14.9.817. - DOI - PubMed
    1. Posada D. jModelTest: phylogenetic model averaging. Mol Biol Evol. 2008;25(7):1253–56. doi: 10.1093/molbev/msn083. - DOI - PubMed
    1. Darriba D, Taboada GL, Doallo R, Posada D. jModelTest 2: more models, new heuristics and parallel computing. Nat Methods. 2012;9(8):772–2. doi: 10.1038/nmeth.2109. - DOI - PMC - PubMed
    1. Yang Z. Maximum likelihood phylogenetic estimation from DNA sequences with variable rates over sites: approximate methods. J Mol Evol. 1994;39(3):306–14. doi: 10.1007/BF00160154. - DOI - PubMed
    1. Gu X, Fu YX, Li WH. Maximum likelihood estimation of the heterogeneity of substitution rate among nucleotide sites. Mol Biol Evol. 1995;12(4):546–7. - PubMed

Publication types

LinkOut - more resources