. 2017 Feb 6;14(1):9.
doi: 10.1186/s12977-017-0335-8.

Toll-like receptor 3 activation selectively reverses HIV latency in microglial cells

Affiliations

Toll-like receptor 3 activation selectively reverses HIV latency in microglial cells

David Alvarez-Carbonell et al. Retrovirology. .

Abstract

Background: Multiple toll-like receptors (TLRs) are expressed in cells of the monocytic lineage, including microglia, which constitute the major reservoir for human immunodeficiency virus (HIV) infection in the brain. We hypothesized that TLR receptor mediated responses to inflammatory conditions by microglial cells in the central nervous system (CNS) are able to induce latent HIV proviruses, and contribute to the etiology of HIV-associated neurocognitive disorders.

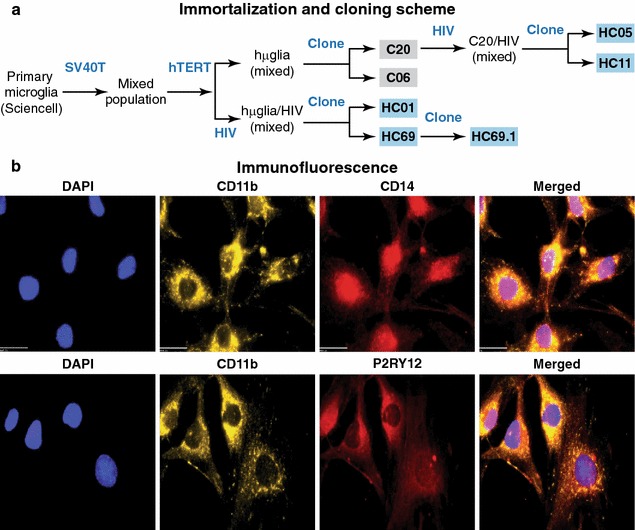
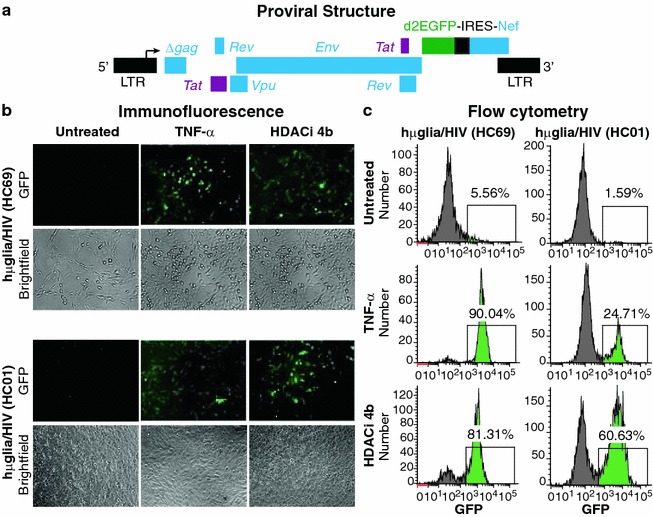
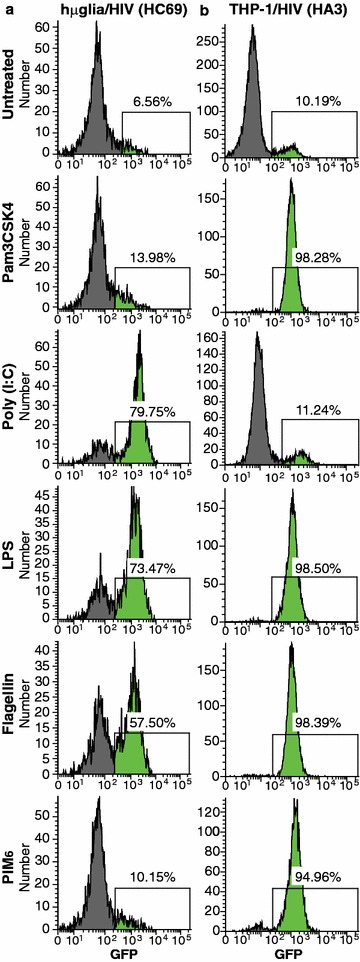
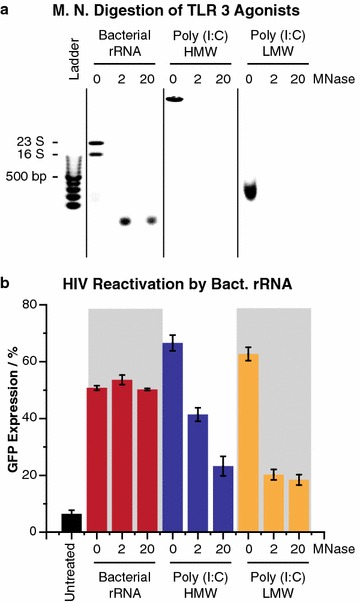
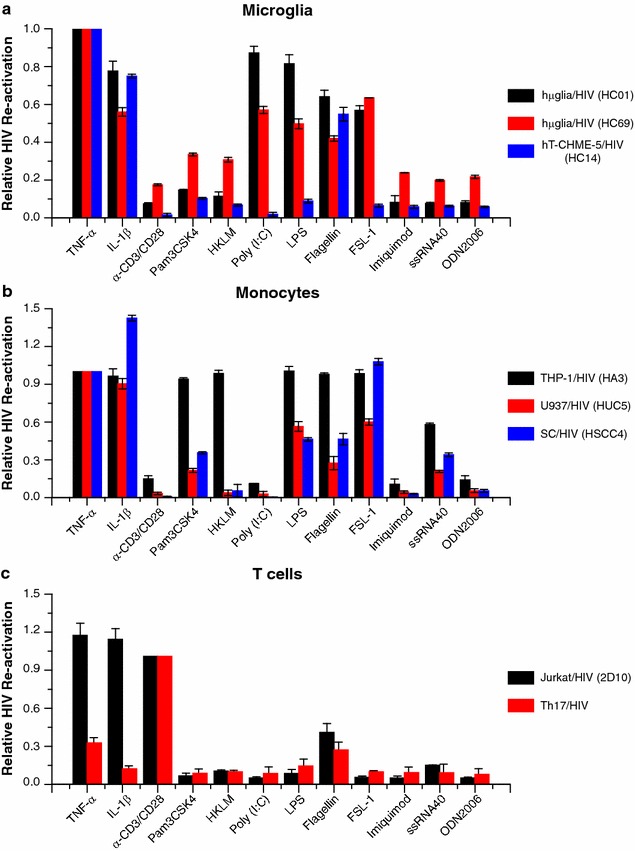
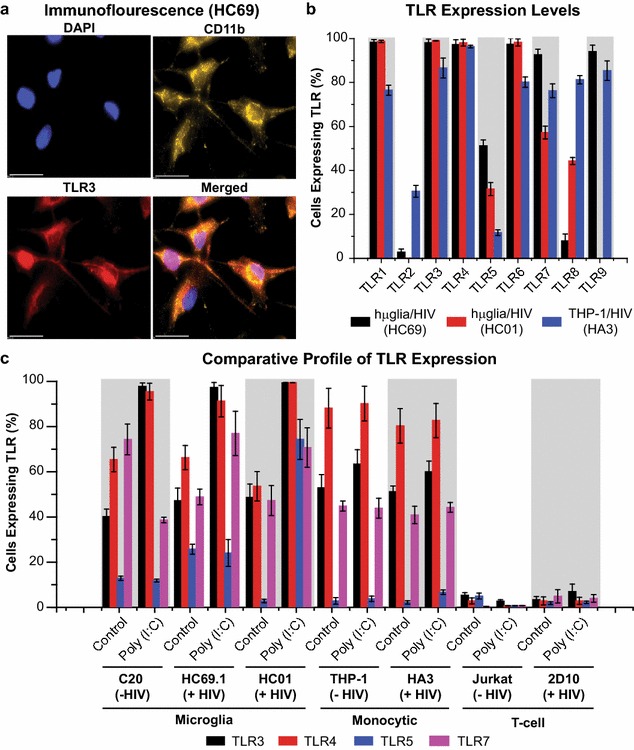
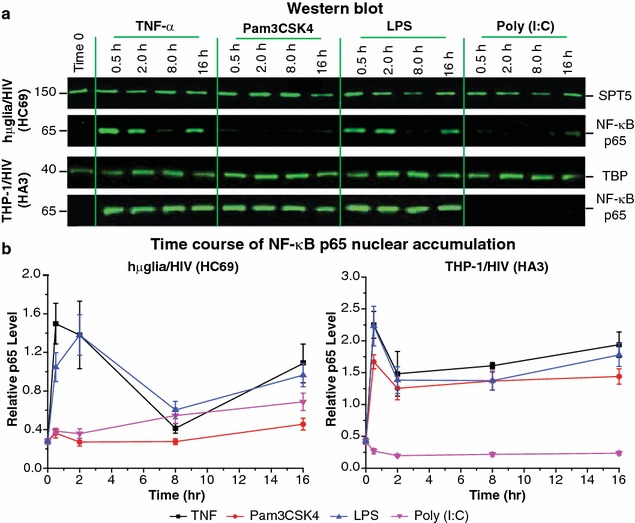
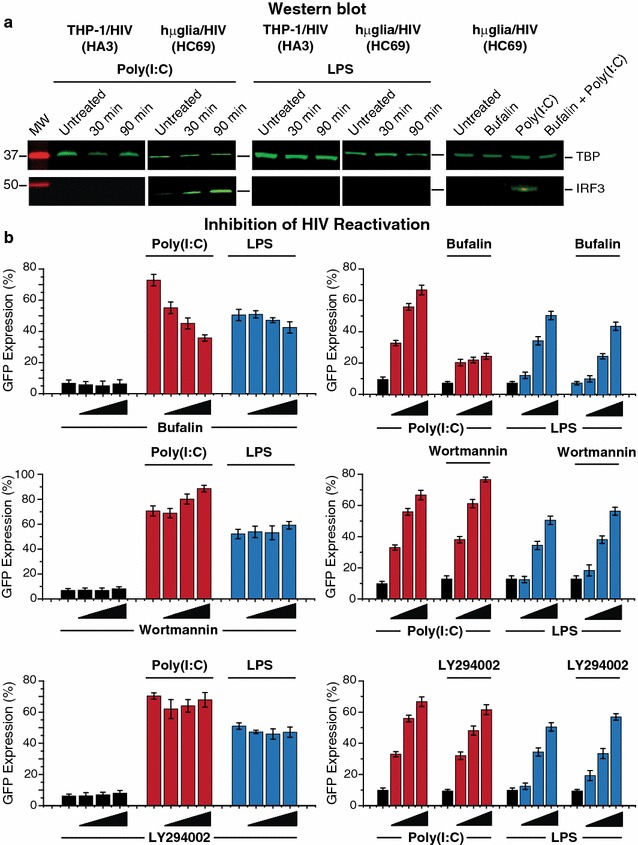
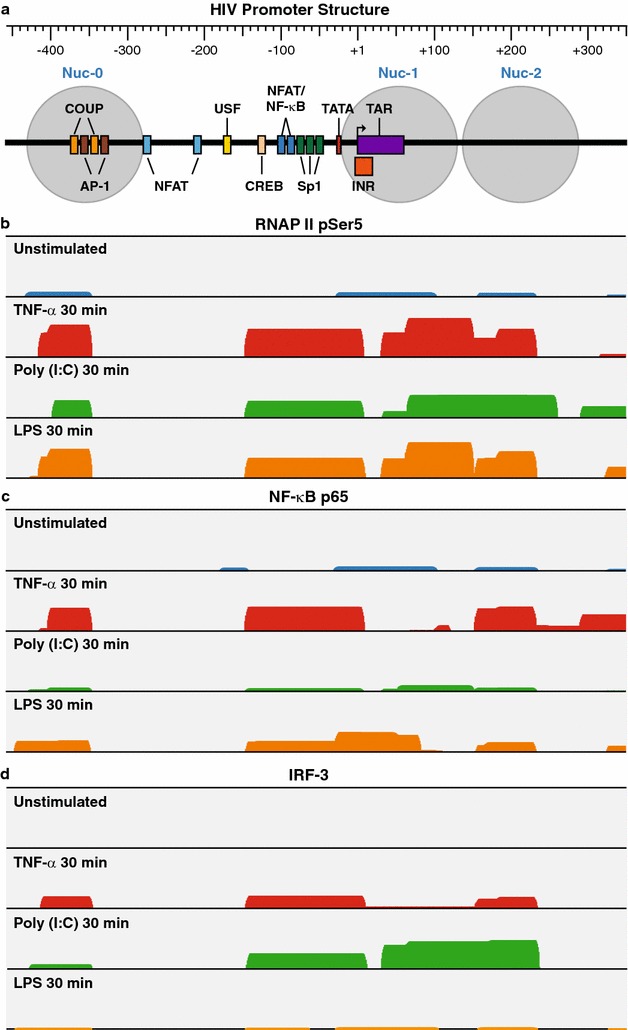
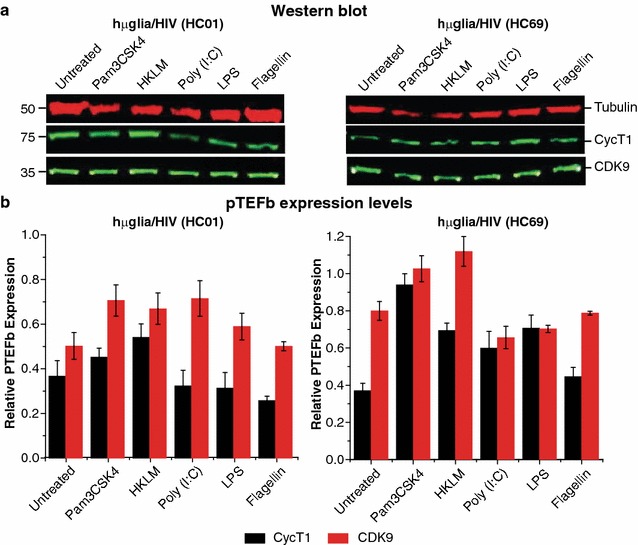
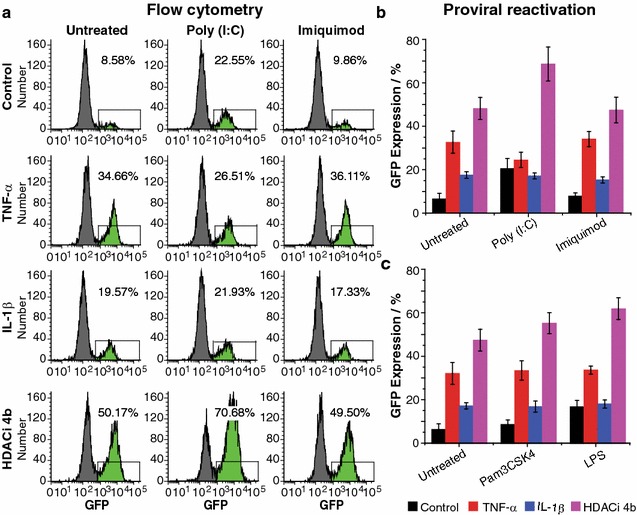
Results: Newly developed human microglial cell lines (hµglia), obtained by immortalizing human primary microglia with simian virus-40 (SV40) large T antigen and the human telomerase reverse transcriptase, were used to generate latently infected cells using a single-round HIV virus carrying a green fluorescence protein reporter (hµglia/HIV, clones HC01 and HC69). Treatment of these cells with a panel of TLR ligands showed surprisingly that two potent TLR3 agonists, poly (I:C) and bacterial ribosomal RNA potently reactivated HIV in hμglia/HIV cells. LPS (TLR4 agonist), flagellin (TLR5 agonist), and FSL-1 (TLR6 agonist) reactivated HIV to a lesser extent, while Pam3CSK4 (TLR2/1 agonist) and HKLM (TLR2 agonist) only weakly reversed HIV latency in these cells. While agonists for TLR2/1, 4, 5 and 6 reactivated HIV through transient NF-κB induction, poly (I:C), the TLR3 agonist, did not activate NF-κB, and instead induced the virus by a previously unreported mechanism mediated by IRF3. The selective induction of IRF3 by poly (I:C) was confirmed by chromatin immunoprecipitation (ChIP) analysis. In comparison, in latently infected rat-derived microglial cells (hT-CHME-5/HIV, clone HC14), poly (I:C), LPS and flagellin were only partially active. The TLR response profile in human microglial cells is also distinct from that shown by latently infected monocyte cell lines (THP-1/HIV, clone HA3, U937/HIV, clone HUC5, and SC/HIV, clone HSCC4), where TLR2/1, 4, 5, 6 or 8, but not for TLR3, 7 or 9, reactivated HIV.

Conclusions: TLR signaling, in particular TLR3 activation, can efficiently reactivate HIV transcription in infected microglia, but not in monocytes or T cells. The unique response profile of microglial cells to TLR3 is fundamental to understanding how the virus responds to continuous microbial exposure, especially during inflammatory episodes, that characterizes HIV infection in the CNS.

Keywords: HIV latency; HIV-associated neurocognitive disorders; Microglial cells; TLR3; Toll-like receptors.


Figures

Fig. 1
Fig. 1
Isolation and characterization of hµglia/HIV (HC69) cells. a Schematic representation of a typical procedure to develop a microglia/HIV clonal cell population such as hµglia/HIV (HC69) cells. Uninfected clonal populations are indicated in grey boxes, and latently-infected clonal populations are indicated in blue boxes. b Immunofluorescence analysis of the human microglial cells hµglia/HIV (HC01). Cells were cultured, fixed, and immunostained with either anti-CD11b (green), anti-CD14 (red) or anti-P2RY12 (red) conjugated antibodies. Nuclei were stained with DAPI (blue). Merged images of nuclei, CD11b and CD14, or nuclei, CD11b and P2RY12 are indicated
Fig. 2
Fig. 2
HIV emergence from latency in human microglial cell models. a Genome organization of the HIV lentiviral vector. A fragment of HIV-1pNL4-3, containing Tat, Rev, Env, Vpu and Nef with the reporting gene d2EGFP, is cloned into the pHR’ backbone. The resulted plasmid was used to produce the VSVG HIV particles, as described previously [112]. b Fluorescence microscopy analysis of TNF-α- and HDACi 4b-mediated reactivation of HIV in latently-infected microglial cells [hµglia/HIV (HC69) and (HC01)]. Cells treated with TNF-α (500 pg/mL) or HDACi 4b (30 µM). c FACS analysis 16 h post-treatment. In these, and subsequent FACS profiles, GFP+ cell populations are indicated in green, and the proportion of GFP-expressing cells is indicated in %
Fig. 3
Fig. 3
HIV reactivation by TLR agonists in latently-infected microglial cells. Treatment of the hµglia/HIV (HC69) clonal populations with TLR ligands. HC69 cells (a) were plated 8 h before no treatment or treatment with the TLR agonists Pam3CSK4 (1 µg/mL), poly (I:C) (10 µg/mL), LPS (5 µg/mL), flagellin (5 µg/mL) or PIM6 (5 µg/mL) for 16 h prior to measuring GFP expression by FACS analysis. THP-1/HIV (HA3) cells (b) were used as positive control
Fig. 4
Fig. 4
Effect of bacterial rRNA on HIV reactivation in microglia. a Microccocal nuclease (MNase) digestion of TLR3 agonists. Bacterial rRNA, poly (I:C) HWM, and poly (I:C) LMW were digested with 2 or 20 U of MNase. Undigested RNA and the digestion products were run on a 0.7% agarose gel. b HIV expression in HC69 cells by TLR3 agonist. Cells were incubated overnight with rRNA, poly (I:C) HMW, and poly (I:C) LMW undigested or digested with indicated doses of MNase. Error bars indicate the standard deviation for three or more experiments
Fig. 5
Fig. 5
Relative induction (Y-axis) of HIV transcription by TLR ligands (X-axis). a Microglial cells are represented by hµglia/HIV (HC01; black bars), hµglia/HIV (HC69; red bars), and hT-CHME-5/HIV (HC14; blue bars). To compare the different cell lines, the data was normalized to TNF-α induction (100%). b The monocytic cells are represented by THP-1/HIV (HA3; black bars), U937/HIV (HUC5; red bars), and SC/HIV (HSCC4; blue bars). To compare the different cell lines, the data was normalized to TNF-α induction (100%). c T cells are represented by Jurkat/HIV (2D10; black bars) and Th17/HIV (mixed population; red bars). The data was normalized to α-CD3/CD28 induction levels (100%). Error bars indicate the standard deviation for three or more experiments
Fig. 6
Fig. 6
TLR expression on hµglia/HIV (HC69) and (HC01) cells. a Expression of TLR3 on clone HC69 by immunofluorescence. Cells were cultured, fixed, and immunostained with either anti-CD11b (green) or anti-TLR3 (red) conjugated antibodies. Nuclei were stained with DAPI (blue). Merged images of nuclei, CD11b and TLR3 are indicated. b Flow cytometry analysis quantification of surface expression of TLR1–9 on hµglia/HIV (HC69; black bars) and (HC01; red bars) cells. Cells were incubated with antibodies against TLR1–9, or corresponding isotype control. THP-1/HIV (HA3) cells (blue bars) were used as control. c Surface expression of TLR3, 4, 5, and 7 on indicated cell lines. Serum-starved cells were untreated or treated with 100 ng/mL of poly (I:C) prior to incubation with antibodies against these TLRs, or corresponding isotype control. Error bars represent the standard deviation of three or more experiments
Fig. 7
Fig. 7
Induction of NF-κB nuclear recruitment by TLR ligands in hµglia/HIV (HC69) cells. a Representative Western blot analysis images of NF-κB p65 nuclear recruitment after stimulation. Cells [hµglia/HIV (HC69), and THP-1/HIV (HA3), as control] were untreated or treated with TNF-α (10 ng/mL), Pam3CSK4 (1 µg/mL), LPS (1 µg/mL) or poly (I:C) (1 µg/mL) for 30 min, 2, 8, or 16 h prior to nuclear extracts (NE) purification. Anti-SPT5 antibody for hµglia/HIV and anti-TBP antibody for THP-1/HIV were used as loading control. Molecular weights are indicated at the left of the blots. b Quantification of NF-κB p65 nuclear recruitment is depicted in the relative p65 band intensity (Y-axis) versus time (X-axis) graphs. TNF-α is shown in black squares, Pam3CSK4 in red circles, LPS in blue triangles, and poly (I:C) in purple triangles. Error bar represents the standard deviation of three or more experiments
Fig. 8
Fig. 8
Poly (I:C)-mediated HIV reactivation in hµglia/HIV (HC69) cells requires IRF3 nuclear recruitment. a Representative Western blot analysis images of IRF3 nuclear recruitment after poly (I:C) stimulation. Cells were untreated or treated with poly (I:C) (1 µg/mL), or LPS (1 µg/mL), as negative control, for 30 or 90 min prior to nuclear extracts purification. Far right Representative Western blot analysis images of IRF3 nuclear recruitment after poly (I:C) stimulation in the absence or presence of bufalin. Cells were untreated or treated with poly (I:C) (1 µg/mL), bufalin (25 nM), or a combination of both for 90 min prior to nuclear extracts purification. For all blots, anti-TBP antibody was used as loading control. Molecular weights of IRF3 and TBP are indicated at left. b Pharmacological inhibition of poly (I:C)-mediated HIV reactivation. Left hµglia/HIV (HC69) cells were untreated or pre-treated with either poly (I:C) (1 µg/mL) or LPS (500 pg/mL) for 30 min prior to addition of inhibitors [bufalin (0, 5, 10, and 25 nM); wortmannin (0, 0.5, 2, and 5 nM); LY294002 (0, 0.5, 2, and 5 µM)]. Right hµglia/HIV (HC69) cells were untreated or pre-treated with inhibitors [bufalin (25 nM); wortmannin (5 µM); LY294002 (5 µM)] for 30 min prior to no-addition or addition of either poly (I:C) (0, 0.1, 0.5, and 1 µg/mL) or LPS (0, 20, 100, and 500 pg/mL), as indicated
Fig. 9
Fig. 9
Chromatin immunoprecipitation assays showing the association of RNAP II (pSer5), NF-kB p65 and IRF3 with the HIV LTR. HC69 cells were untreated or treated with TNF-α (10 ng/mL), poly (I:C) (100 ng/mL) or LPS (10 ng/mL) for 30 min. DNA–protein complexes were extracted from formaldehyde-crosslinked cells. a Schematic representation of the HIV promoter region. b Histograms of sequence reads mapping to the HIV LTR representing the distribution and relative abundance of RNAP II pSer5, c p65, d IRF3
Fig. 10
Fig. 10
TLR-mediated activation and NF-κB nuclear translocation are not accompanied by significant P-TEFb production induction in hµglia/HIV cells. a Representative Western blot analysis blots of CycT1 and CDK9 expression in whole cell extracts (WCE) from hµglia/HIV (HC01) and (HC69) cells treated with TLR agonists. Cells were incubated with indicated TLR agonists (Pam3CSK4 at 1 µg/mL, HKLM at 108 cells/mL, poly (I:C) at 10 µg/mL, and LPS and flagellin at 5 µg/mL) for 16 prior to WCE preparation and SDS-PAGE/Western blot analysis with anti-CycT1 antibody, anti-CDK9 antibody, or anti-Tubulin antibody as loading control. b Bar graph depicts the relative level of CycT1 (black bars) and CDK9 (red bars) expression in each clone, with error bars representing the standard deviation of three experiments
Fig. 11
Fig. 11
Effect of TLR agonists in combination with pro-inflammatory stimuli in HIV reactivation in hµglia/HIV (HC01) cells. Flow cytometry analysis of the effect of poly (I:C) or imiquimod treatment in combination with TNF-α or IL-1β on HIV emergence from latency. a hµglia/HIV (HC01) cells were untreated or treated with TNF-α (500 pg/mL), IL-1β (100 pg/mL), or HDACi 4b (25 µM) alone or in combination with poly (I:C) (1 µg/mL) or imiquimod (1 µg/mL) for 16 h prior to measuring GFP-expressing cells by flow cytometry. Fraction of cells expressing HIV is indicated by %. b Quantification of three or more combinatorial experiments is shown. Control black bars, TNF-α red bars, IL-1β blue bars, and HDACi 4b purple bars. Pam3CSK4 at 1 µg/mL and LPS at 5 µg/mL. Error bars indicate standard deviation of three or more experiments

Similar articles

Cited by

References

    1. Finzi D, Hermankova M, Pierson T, Carruth LM, Buck C, Chaisson RE, Quinn TC, Chadwick K, Margolick J, Brookmeyer R, et al. Identification of a reservoir for HIV-1 in patients on highly active antiretroviral therapy. Science. 1997;278:1295–1300. doi: 10.1126/science.278.5341.1295. - DOI - PubMed
    1. Chun TW, Stuyver L, Mizell SB, Ehler LA, Mican JA, Baseler M, Lloyd AL, Nowak MA, Fauci AS. Presence of an inducible HIV-1 latent reservoir during highly active antiretroviral therapy. Proc Natl Acad Sci USA. 1997;94:13193–13197. doi: 10.1073/pnas.94.24.13193. - DOI - PMC - PubMed
    1. Lassen KG, Bailey JR, Siliciano RF. Analysis of human immunodeficiency virus type 1 transcriptional elongation in resting CD4 + T cells in vivo. J Virol. 2004;78:9105–9114. doi: 10.1128/JVI.78.17.9105-9114.2004. - DOI - PMC - PubMed
    1. Alexaki A, Liu Y, Wigdahl B. Cellular reservoirs of HIV-1 and their role in viral persistence. Curr HIV Res. 2008;6:388–400. doi: 10.2174/157016208785861195. - DOI - PMC - PubMed
    1. Alexaki A, Wigdahl B. HIV-1 infection of bone marrow hematopoietic progenitor cells and their role in trafficking and viral dissemination. PLoS Pathog. 2008;4:e1000215. doi: 10.1371/journal.ppat.1000215. - DOI - PMC - PubMed

Publication types

MeSH terms