

Frequency of Th17 cells correlates with the presence of lung lesions in pigs chronically infected with Actinobacillus pleuropneumoniae
- PMID: 28166835
- PMCID: PMC5294905
- DOI: 10.1186/s13567-017-0411-z
Frequency of Th17 cells correlates with the presence of lung lesions in pigs chronically infected with Actinobacillus pleuropneumoniae
Abstract
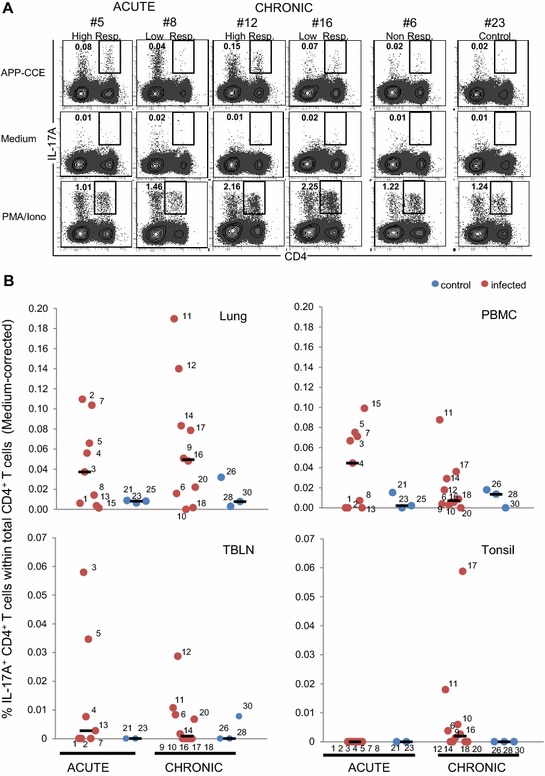
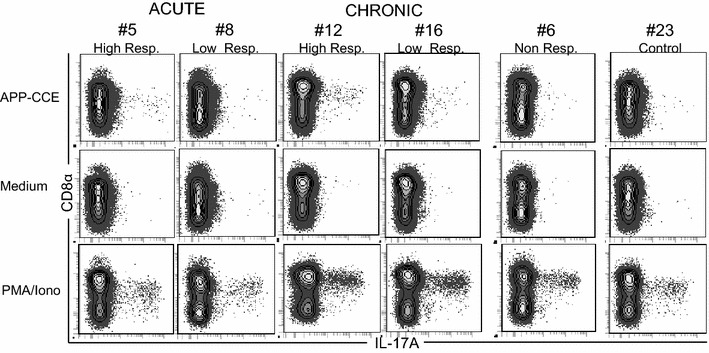
Porcine contagious pleuropneumonia caused by Actinobacillus pleuropneumoniae (APP) remains one of the major causes of poor growth performance and respiratory disease in pig herds. While the role of antibodies against APP has been intensely studied, the porcine T cell response remains poorly characterized. To address this, pigs were intranasally infected with APP serotype 2 and euthanized during the acute phase [6-10 days post-infection (dpi)] or the chronic phase of APP infection (27-31 dpi). Lymphocytes isolated from blood, tonsils, lung tissue and tracheobronchial lymph nodes were analyzed by intracellular cytokine staining (ICS) for IL-17A, IL-10 and TNF-α production after in vitro stimulation with crude capsular extract (CCE) of the APP inoculation strain. This was combined with cell surface staining for the expression of CD4, CD8α and TCR-γδ. Clinical records, microbiological investigations and pathological findings confirmed the induction of a subclinical APP infection. ICS-assays revealed the presence of APP-CCE specific CD4+CD8αdim IL-17A-producing T cells in blood and lung tissue in most infected animals during the acute and chronic phase of infection and a minor fraction of these cells co-produced TNF-α. APP-CCE specific IL-17A-producing γδ T cells could not be found and APP-CCE specific IL-10-producing CD4+ T cells were present in various organs but only in a few infected animals. The frequency of identified putative Th17 cells (CD4+CD8αdimIL-17A+) in lung and blood correlated positively with lung lesion scores and APP-specific antibody titers during the chronic phase. These results suggest a potential role of Th17 cells in the immune pathogenesis of APP infection.
Figures


Similar articles
-
Infection dynamics and acute phase response of an Actinobacillus pleuropneumoniae field isolate of moderate virulence in pigs.Vet Microbiol. 2014 Oct 10;173(3-4):332-9. doi: 10.1016/j.vetmic.2014.08.015. Epub 2014 Aug 26. Vet Microbiol. 2014. PMID: 25201629
-
Actinobacillus pleuropneumoniae infections in closed swine herds: infection patterns and serological profiles.Vet Microbiol. 2002 Apr 2;85(4):343-52. doi: 10.1016/s0378-1135(01)00518-1. Vet Microbiol. 2002. PMID: 11856584
-
Prevalence of granulomatous pleuropneumonia associated with Actinobacillus pleuropneumoniae serotype 2 in slaughter pigs.J Vet Med Sci. 2009 Aug;71(8):1089-92. doi: 10.1292/jvms.71.1089. J Vet Med Sci. 2009. PMID: 19721364
-
The challenge of detecting herds sub-clinically infected with Actinobacillus pleuropneumoniae.Vet J. 2015 Oct;206(1):30-8. doi: 10.1016/j.tvjl.2015.06.016. Epub 2015 Jul 2. Vet J. 2015. PMID: 26206322 Review.
-
Virulence factors of Actinobacillus pleuropneumoniae involved in colonization, persistence and induction of lesions in its porcine host.Vet Res. 2010 Sep-Oct;41(5):65. doi: 10.1051/vetres/2010037. Epub 2010 Jun 15. Vet Res. 2010. PMID: 20546697 Free PMC article. Review.
Cited by
-
Quantification and phenotypic characterisation of peripheral IFN-γ producing leucocytes in chickens vaccinated against Newcastle disease.Vet Immunol Immunopathol. 2017 Dec;193-194:18-28. doi: 10.1016/j.vetimm.2017.10.001. Epub 2017 Oct 10. Vet Immunol Immunopathol. 2017. PMID: 29129224 Free PMC article.
-
Intranasal Delivery of Inactivated Influenza Virus and Poly(I:C) Adsorbed Corn-Based Nanoparticle Vaccine Elicited Robust Antigen-Specific Cell-Mediated Immune Responses in Maternal Antibody Positive Nursery Pigs.Front Immunol. 2020 Dec 16;11:596964. doi: 10.3389/fimmu.2020.596964. eCollection 2020. Front Immunol. 2020. PMID: 33391267 Free PMC article.
-
Rapid Detection of Actinobacillus pleuropneumoniae From Clinical Samples Using Recombinase Polymerase Amplification.Front Vet Sci. 2022 Mar 25;9:805382. doi: 10.3389/fvets.2022.805382. eCollection 2022. Front Vet Sci. 2022. PMID: 35400111 Free PMC article.
-
Actinobacillus pleuropneumoniae Interaction With Swine Endothelial Cells.Front Vet Sci. 2020 Oct 29;7:569370. doi: 10.3389/fvets.2020.569370. eCollection 2020. Front Vet Sci. 2020. PMID: 33195549 Free PMC article.
-
Identifying effective surveillance measures for swine pathogens using contact networks and mathematical modeling.PLoS One. 2025 Aug 22;20(8):e0329714. doi: 10.1371/journal.pone.0329714. eCollection 2025. PLoS One. 2025. PMID: 40845130 Free PMC article.
References
-
- Gottschalk M. Actinobacillosis. In: Zimmerman JJ, Karriker LA, Ramirez A, Schwartz KJ, Stevenson GW, editors. Diseases of Swine. New York: Wiley; 2012.
-
- Krejci J, Nechvatalova K, Kudlackova H, Faldyna M, Kucerova Z, Toman M. Systemic and local antibody responses after experimental infection with Actinobacillus pleuropneumoniae in piglets with passive or active immunity. J Vet Med B Infect Dis Vet Public Health. 2005;52:190–196. doi: 10.1111/j.1439-0450.2005.00844.x. - DOI - PubMed
MeSH terms
LinkOut - more resources
Full Text Sources
Other Literature Sources
Molecular Biology Databases
Research Materials
