. 2017 Jan 15;31(2):141-153.
doi: 10.1101/gad.293910.116. Epub 2017 Feb 6.

Comprehensive characterization of neutrophil genome topology

Affiliations

Comprehensive characterization of neutrophil genome topology

Yina Zhu et al. Genes Dev. .

Abstract

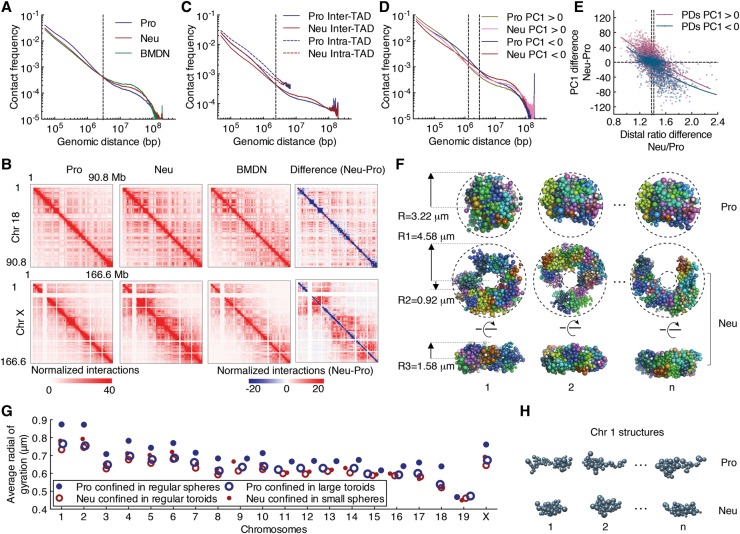
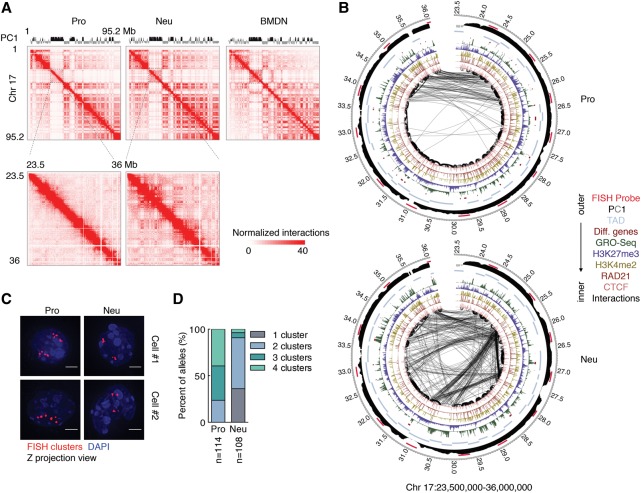
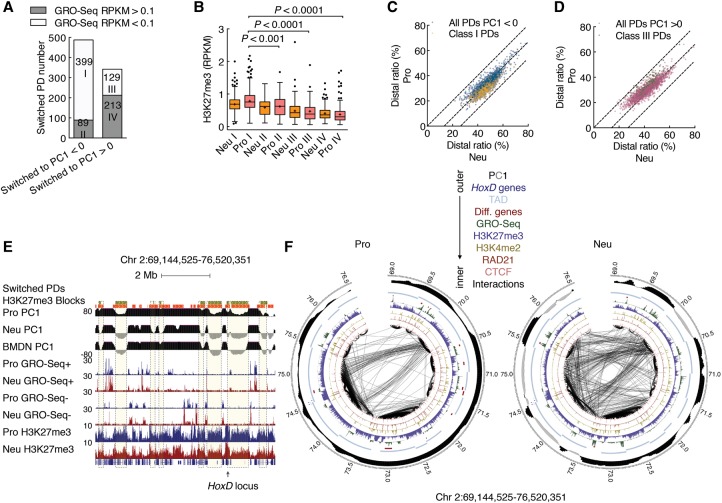
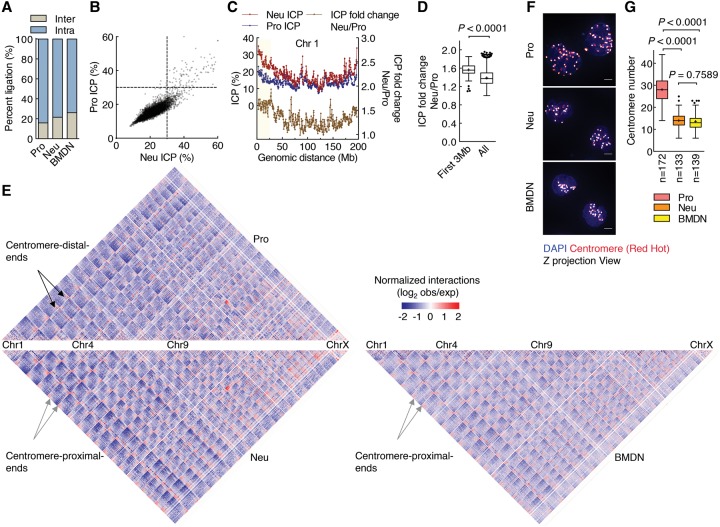
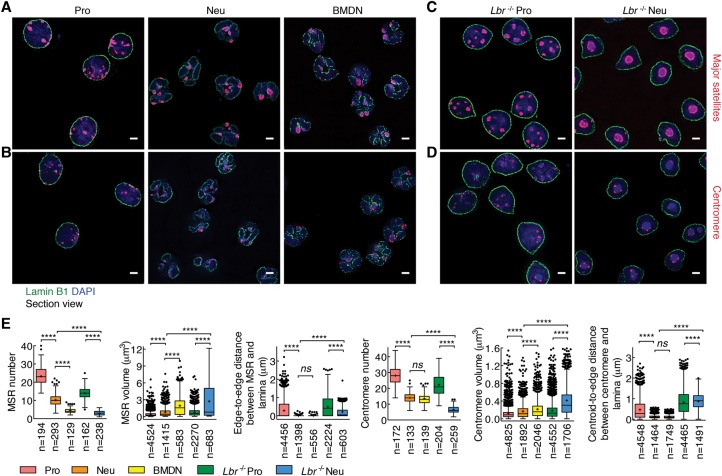
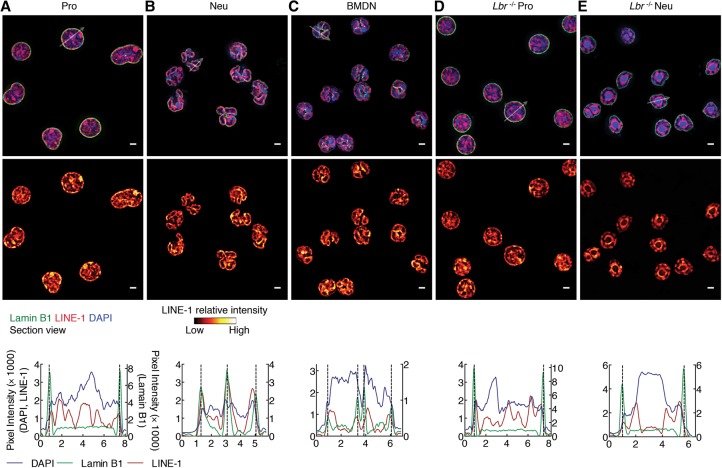
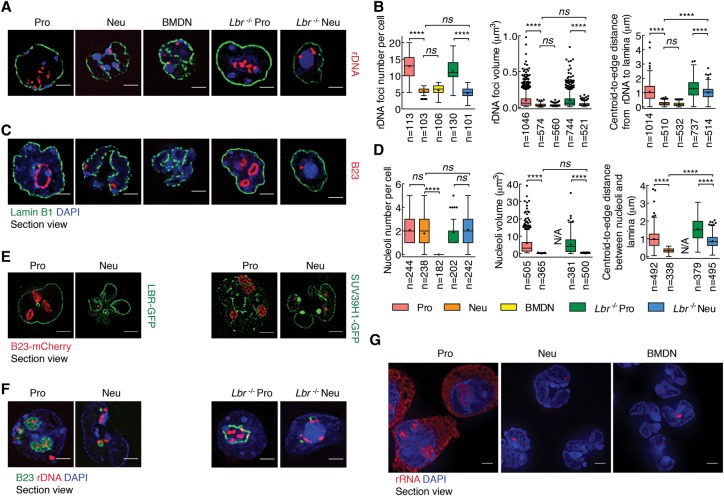
Neutrophils are responsible for the first line of defense against invading pathogens. Their nuclei are uniquely structured as multiple lobes that establish a highly constrained nuclear environment. Here we found that neutrophil differentiation was not associated with large-scale changes in the number and sizes of topologically associating domains (TADs). However, neutrophil genomes were enriched for long-range genomic interactions that spanned multiple TADs. Population-based simulation of spherical and toroid genomes revealed declining radii of gyration for neutrophil chromosomes. We found that neutrophil genomes were highly enriched for heterochromatic genomic interactions across vast genomic distances, a process named supercontraction. Supercontraction involved genomic regions located in the heterochromatic compartment in both progenitors and neutrophils or genomic regions that switched from the euchromatic to the heterochromatic compartment during neutrophil differentiation. Supercontraction was accompanied by the repositioning of centromeres, pericentromeres, and long interspersed nuclear elements (LINEs) to the neutrophil nuclear lamina. We found that Lamin B receptor expression was required to attach centromeric and pericentromeric repeats but not LINE-1 elements to the lamina. Differentiating neutrophils also repositioned ribosomal DNA and mininucleoli to the lamina-a process that was closely associated with sharply reduced ribosomal RNA expression. We propose that large-scale chromatin reorganization involving supercontraction and recruitment of heterochromatin and nucleoli to the nuclear lamina facilitates the folding of the neutrophil genome into a confined geometry imposed by a multilobed nuclear architecture.

Keywords: Lamin B receptor; genome topology; neutrophils; nucleoli; rDNA.


Figures

Figure 1.
Figure 1.
The differentiation of neutrophils is closely associated with large-scale changes in intradomain and interdomain interactions. (A) Average contact probabilities as a function of genomic distance for genomic interactions within individual chromosomes at 50-kb resolution for progenitors (Pro), neutrophils (Neu), and BMDN genomes are shown. The dashed line indicates the crossover for contact frequencies at 3 Mb of gneomic separation. (B) Hi-C contact heat maps for chromosome 18 (Chr 18) (top) and the X chromosome (Chr X) (bottom) at 500-kb resolution for progenitors, neutrophils, and BMDNs are shown. The intensity of each pixel represents the normalized number of contacts between a pair of loci. The right panels indicate differential contact heat maps for chromosome 18 and the X chromosome. Subtraction of the progenitor from neutrophil contact matrices shows changes in the normalized number of contacts between the Hi-C samples. Red represents enrichment, whereas blue represents depletion for normalized contact frequencies in neutrophils. (C) Intrachromosomal contact frequency decay curves for intra-TAD and inter-TAD interactions at 50-kb resolution for progenitors and neutrophils. (D) Intrachromosome contact frequency decay curves for the A and B compartments at 25-kb resolution for progenitor and neutrophil genomes are shown. Interactions were classified based on whether both end points are located within the A or B compartment. The crossover in contact frequencies between progenitor and neutrophil genomes is at 1.3 and 3 Mb for the A and B compartments, respectively (dashed lines). (E) Differences in distal ratio (fold change, Neu/Pro) versus the differences in PC1 values for neutrophil and progenitor genomes for each continuous PD is indicated. Color intensity corresponds to the density of the data points. Solid lines indicate nonlinear fit curves. Genome-wide, the distal ratio was significantly higher in neutrophils when compared with progenitors: a median distal ratio fold change of 1.38 for the A compartment versus 1.42 for the B compartment (dashed lines). (F) Three representative structures for progenitor and neutrophil genomes were derived from the structure populations. Modeling was performed for genomes confined as either spherical or toroid nuclear volumes. Shown are top (middle panel) and side (bottom panel) views of modeled neutrophil nuclear structures. The dimensions and shape of the nuclear volumes are indicated and were based on experimental measurements (Supplemental Fig. S2F). (G) The average radius of gyration for each chromosome in neutrophil and progenitor genomes was computed for two different settings. The progenitor and neutrophil genomic structures were modeled using Hi-C reads derived from progenitor and neutrophil genomes folded into spherical or toroid nuclear structures. (H) Representative structures for chromosome 1 are shown for progenitors and neutrophils with a radius of gyration similar to the average value, as indicated in resulting models.
Figure 2.
Figure 2.
Genomes of differentiating neutrophils undergo large-scale spatial contraction. (A) A Hi-C contact heat map for chromosome 17 at 500-kb resolution (top) and a subgenomic region for chromosome 17 at 50-kb resolution (bottom) for the indicated cell types is shown. The intensity of each pixel represents the normalized number of contacts between a pair of loci. (B) Circos plots show genomic interactions across chromosome 17 derived from progenitor and neutrophil genomes. RAD21, CTCF, H3K4me2, H3K27me3, GRO-seq (global run-on combined with sequencing), cell type-specific gene positions, and PC1 values are shown. Probes used for 3D-FISH are indicated in red. Only significant interactions are shown. P < 0.001, binomial test. The thickness of the connecting lines reflects the significance of genomic interactions (−log P). Bin size, 50 kb. Numbers around the margins indicate genomic positions (in megabases). (C) 3D-FISH in progenitors and neutrophils using BAC probes spanning a 13-Mb region on chromosome 17 (shown in A, bottom). Representative maximum intensity Z-projected images are shown. Original magnification, 100×. (Red) BAC probes; (blue) DAPI staining. Bars, 2 µm. (D) Fractions of the number of clusters per allele were visualized using BAC probes for neutrophils and progenitors. (n) Number of alleles quantified for each sample.
Figure 3.
Figure 3.
Differentiating neutrophils establish a network of genomic interactions involving transcriptionally silent regions. (A) Bar plot showing the numbers of four classes of PDs that switched compartments during neutrophil differentiation. The switched PDs were classified into two subcategories according to GRO-seq transcript abundance: transcriptionally active (reads per kilobase per million mapped read [RPKM] > 0.1) in either progenitors or neutrophils or transcriptionally silent (RPKM < 0.1) in both progenitors and neutrophils. Numbers in bars indicate totals of PDs. Note that 82% of PDs that switched from the A to the B compartment in neutrophils (class I) were transcriptionally silent in progenitors. (B) Box and whisker plot showing the abundance of H3K27me3 in four classes of PDs that switched compartments in progenitors and neutrophils. P-value, Kruskal-Wallis test. (C) Scatter plot comparing the distal ratio of class I PDs and inactive PDs for neutrophil genomes. Color intensity corresponds to the density of the data points. (D) Scatter plot comparing the distal ratio of class III PDs and active PDs for neutrophil genomes. Color intensity corresponds to the density of the data points. (E) Genome browser snapshot of the Hoxd locus and flanking genomic regions. The deposition of H3K27me3-marked regions is shown for progenitors and neutrophils. Green filled boxes represent class I PDs. Orange filled boxes represent H3K27me3-marked regions. PC1 values as well as read densities for nascent RNA (GRO-seq) and H3K27me3 are shown. (F) Circos plot showing genomic interactions within the same genomic region as in E for progenitor and neutrophil genomes as indicated. RAD21, CTCF, deposition of H3K4me2 and H3K27me3, nascent transcript abundance (GRO-seq), cell type-specific gene positions, and PC1 values are shown. Only significant interactions are shown. P < 0.001, binomial test. The thickness of the connecting lines reflects the significance of the interaction (−log P). Bin size, 50 kb. Numbers at the margins indicate genomic position (in megabases). Colors indicate CTCF, RAD21, H3K4me2, H3K27me3, GRO-seq, cell type-specific genes, TADs, HoxD family, PC1 tracks, and FISH probes (color key above).
Figure 4.
Figure 4.
Differentiating neutrophils are enriched for interchromosomal interactions. (A) Neutrophil and BMDN genomes exhibit higher percentages of interchromosomal interactions than progenitor genomes. The fractions of intrachromosomal and interchromosomal contacts from progenitors, neutrophils, and BMDNs are indicated. (B) Scatter plot comparing ICP values derived from neutrophil and progenitor genomes. ICP values were calculated as the ratio of interchromosomal interaction frequency versus the frequencies of all genomic interactions for each 500-kb interval. Color intensity corresponds to the density of data points. (C) Plots showing ICP values derived from progenitors and neutrophils (red and blue lines, left Y-axis) and ICP differences (Neu/Pro) between the two cell types (yellow line, right Y-axis) for chromosome 1 at 500-kb resolution. (D) Box and whisker plot showing ICP fold change (Neu/Pro) comparison for centromeric-proximal regions (<3 Mb) with genome-wide average fold change values. P-value, Mann-Whitney test. (E) Hi-C contact heat map comparison between neutrophils (bottom left), BMDN (bottom right), and progenitors (top) at 500-kb resolution. Colors indicate the log ratio of the observed interaction frequency to expected interaction frequency (obs/exp). (Blue) Lower than expected; (red) higher than expected; (black arrows) centromere-distal end zone; (gray arrows) centromere-proximal end zone. (F) 3D-FISH analysis of progenitors and neutrophils using a fluorescently labeled centromeric probe. Representative maximum intensity Z-projections of image stacks are shown. Original magnification, 100×. (Red hot) Intensity of centromere staining; (blue) DAPI staining. Bars, 2 µm. (G) Box and whisker plot showing centromere numbers revealed using Volocity software. (n) Number of cells quantified for each sample. P-value, one-way ANOVA test.
Figure 5.
Figure 5.
Pericentormeric and centromeric heterochromatin repositions to the lamina in differentiating neutrophils. (A) Pericentromeric heterochromatin in progenitors and neutrophils as well as BMDNs was visualized using immuno-3D-FISH. The lamina was stained using an antibody directed against Lamin B1. Pericentromeric DNA was identified using fluorescently labeled major satellite repeats (MSRs) as a probe. Representative image sections are presented as digitally magnified images. Original magnification, 100×. (Red) FISH foci; (green) Lamin B1; (blue) DAPI staining. Bars, 2 µm. (B) Centromeres in progenitors and neutrophils as well as BMDNs were visualized as described in A but using a centromeric repeat element as a probe. (C) MSR elements in Lbr−/− progenitors and Lbr−/− neutrophils were visualized using immuno-3D-FISH as described in A. (D) Centromeres in Lbr−/− progenitors and Lbr−/− neutrophils were visualized using immuno-3D-FISH as described in A. (E) Box and whisker plot showing the quantification of the number, volume, and distance to the lamina of MSRs and centromeres for progenitors, neutrophils, BMDNs, Lbr−/− progenitors, and Lbr−/− neutrophils using Volocity software. The distance of the MSR to the lamina that separates the edge of the MSR from the edge of the lamina was measured. The distance of the centromere to the lamina was measured using the centroid of centromere dots and the edge of the lamina. (n) Number of cells or FISH foci quantified for each sample. P-value, one-way ANOVA test for numbers, Kruskal-Wallis test for volume or distance. (****) P < 0.0001; (ns) not significant.
Figure 6.
Figure 6.
LINE-1 elements reposition during neutrophil differentiation. (AE) The repositioning of LINE-1 elements to the nuclear lamina during neutrophil differentiation is independent of LBR expression. (Top and middle panels) Immuno-FISH using an antibody directed against Lamin B1 and a LINE-1 probe for progenitors (A), neutrophils (B), BMDNs (C), Lbr−/− progenitors (D), and Lbr−/− neutrophils (E). Representative image sections are presented as digitally magnified images. Original magnification, 100×. (Top) (Red) LINE-1; (green) Lamin B1; (blue) DAPI staining. (Middle) (Red hot) The intensity of FISH signal. Bars, 2 µm. White arrows indicate the diameter across the nucleus. (Bottom) Radial distribution of the fluorescence intensity signal for Lamin B1 (green line, right Y-axis), LINE-1 (red line, left Y-axis), and DAPI (blue line, left Y-axis).
Figure 7.
Figure 7.
Spatial distribution of rDNA and nucleoli in differentiating neutrophils. (A) rDNA repositions during neutrophil differentiation. Immuno-FISH using an antibody directed against Lamin B1 and a fluorescently labeled rDNA probe in progenitors, neutrophils, BMDNs, Lbr−/− progenitors, and Lbr−/− neutrophils. Representative image sections are presented as digitally magnified images. Original magnification, 100×. (Red) rDNA; (green) Lamin B1; (blue) DAPI staining. Bars, 2 µm. (B) Box and whisker plot showing the quantification of the numbers, volumes, and distances to the lamina of rDNA foci using Volocity software. The distance of rDNA foci to the lamina was measured between the centroid of dots and the edge of the lamina. (n) Number of cells or fluorescently labeled foci quantified for each sample. P-value, one-way ANOVA test for numbers, Kruskal-Wallis test for volumes or distances. (****) P < 0.0001; (ns) not significant. (C) Nucleoli reorganize during neutrophil differentiation. Immunofluorescence staining using an antibody directed against Lamin B1 and Nucleophosmin (B23) in progenitors, neutrophils, BMDNs, Lbr−/− progenitors, and Lbr−/− neutrophils. Representative image sections are presented as digitally magnified images. Original magnification, 100×. (Red) B23; (green) Lamin B1; (blue) DAPI staining. Bars, 2 µm. (D) Box and whisker plot showing the quantification of the numbers, volumes, and distances to the lamina of nucleoli using Volocity software. The distance of nucleoli to the lamina was measured between the centroid of foci and the edge of the lamina. (n) Number of cells or nucleoli quantified for each sample. P-value, one-way ANOVA test for number, Kruskal-Wallis test for volume or distance. (****) P < 0.0001; (ns) not significant. (E) Live-cell imaging in progenitors and neutrophils. To visualize changes in nucleolar structure in live cells, nucleoli were marked by B23-mCherry, and the nuclear lamina was labeled using an LBR-GFP fusion protein; SUV39H1-GFP was generated to visualize the heterochromatin. ECOMG cells were transduced with vectors expressing LBR-GFP or SUV39H1-GFP and B23-mCherry. The transduced cells were differentiated into neutrophils. Representative image section shows the relative position of nucleoli to lamina and major satellites. Original magnification, 100×. (Red) B23; (green) LBR-GFP or SUV39H1-GFP; (blue) DAPI staining. Bars, 2 µm. Note that, in progenitors, nucleoli were readily detectable using B23-mCherry as large distinct regions located in the interior of the nucleus. Marked variations in size and shape, occasionally with very large and irregular shapes, were observed. Usually, no more than three nucleoli per cell were detected. (F) Immuno-FISH using an antibody directed against B23 and a fluorescently labeled rDNA probe in progenitors, neutrophils, Lbr−/− progenitors, and Lbr−/− neutrophils. Representative image section shows that rDNA is bridging the mininucleolar structure to major satellites. Original magnification, 100×. (Red) rDNA; (green) B23; (blue) DAPI staining. Bars, 2 µm. (G) RNA-FISH using fluorescently labeled rDNA as a probe in progenitors, neutrophils, and BMDNs. Representative image sections are presented as digitally magnified images. Original magnification, 100×. (Red) rRNA; (blue) DAPI staining. Bars, 2 µm. Note that the decrease in the nucleolar size in neutrophils is associated with a marked decline in nucleolar as well as cytoplasmic rRNA. The neutrophil mininucleolus body still maintains trace amounts of rRNA.

Comment in

References

    1. Apostolou E, Thanos D. 2008. Virus infection induces NF-κB-dependent interchromosomal associations mediating monoallelic IFN-γ gene expression. Cell 134: 85–96. - PubMed
    1. Bickmore WA, Van Steensel B. 2013. Genome architecture: domain organization of interphase chromosomes. Cell 152: 1270–1284. - PubMed
    1. Chow JC, Ciaudo C, Fazzari MJ, Mise N, Servant N, Glass JL, Attreed M, Avner P, Wutz A, Barillot E, et al. 2010. LINE-1 activity in facultative heterochromatin formation during X chromosome inactivation. Cell 141: 956–969. - PubMed
    1. Cong L, Ran FA, Cox D, Lin S, Barretto R, Habib N, Hsu PD, Wu X, Jiang W, Marraffini LA, et al. 2013. Multiplex genome engineering using CRISPR/Cas system. Science 339: 819–824. - PMC - PubMed
    1. Corbel C, Diabangouaya P, Gendrel A-V, Chow JC, Heard E. 2013. Unusual chromatin status and organization of the inactive X chromosome in murine trophoblast giant cells. Development 140: 861–872. - PubMed

Publication types

MeSH terms

Substances