. 2017 Mar 28;199(8):e00776-16.
doi: 10.1128/JB.00776-16. Print 2017 Apr 15.

Regulation of Polyhydroxybutyrate Accumulation in Sinorhizobium meliloti by the Trans-Encoded Small RNA MmgR

Affiliations

Regulation of Polyhydroxybutyrate Accumulation in Sinorhizobium meliloti by the Trans-Encoded Small RNA MmgR

Antonio Lagares Jr et al. J Bacteriol. .

Abstract

Riboregulation has a major role in the fine-tuning of multiple bacterial processes. Among the RNA players, trans-encoded untranslated small RNAs (sRNAs) regulate complex metabolic networks by tuning expression from multiple target genes in response to numerous signals. In Sinorhizobium meliloti, over 400 sRNAs are expressed under different stimuli. The sRNA MmgR (standing for Makes more granules Regulator) has been of particular interest to us since its sequence and structure are highly conserved among the alphaproteobacteria and its expression is regulated by the amount and quality of the bacterium's available nitrogen source. In this work, we explored the biological role of MmgR in S. meliloti 2011 by characterizing the effect of a deletion of the internal conserved core of mmgR (mmgRΔ33-51). This mutation resulted in larger amounts of polyhydroxybutyrate (PHB) distributed into more intracellular granules than are found in the wild-type strain. This phenotype was expressed upon cessation of balanced growth owing to nitrogen depletion in the presence of surplus carbon (i.e., at a carbon/nitrogen molar ratio greater than 10). The normal PHB accumulation was complemented with a wild-type mmgR copy but not with unrelated sRNA genes. Furthermore, the expression of mmgR limited PHB accumulation in the wild type, regardless of the magnitude of the C surplus. Quantitative proteomic profiling and quantitative reverse transcription-PCR (qRT-PCR) revealed that the absence of MmgR results in a posttranscriptional overexpression of both PHB phasin proteins (PhaP1 and PhaP2). Together, our results indicate that the widely conserved alphaproteobacterial MmgR sRNA fine-tunes the regulation of PHB storage in S. melilotiIMPORTANCE High-throughput RNA sequencing has recently uncovered an overwhelming number of trans-encoded small RNAs (sRNAs) in diverse prokaryotes. In the nitrogen-fixing alphaproteobacterial symbiont of alfalfa root nodules Sinorhizobium meliloti, only four out of hundreds of identified sRNA genes have been functionally characterized. Thus, uncovering the biological role of sRNAs currently represents a major issue and one that is particularly challenging because of the usually subtle quantitative regulation contributed by most characterized sRNAs. Here, we have characterized the function of the broadly conserved alphaproteobacterial sRNA gene mmgR in S. meliloti Our results strongly suggest that mmgR encodes a negative regulator of the accumulation of polyhydroxybutyrate, the major carbon and reducing power storage polymer in S. meliloti cells growing under conditions of C/N overbalance.

Keywords: MmgR; PHB; Sinorhizobium meliloti; riboregulation; small RNA.


Figures

FIG 1
FIG 1
Partial sequence exchange at the internal conserved core of mmgR and the predicted impact on the secondary structure of MmgR. (a) The mmgR locus and scheme of the mutational approach that was followed to construct the mmgRΔ33–51 allele. The asterisks indicate the fully conserved positions revealed by multiple-sequence alignment of homologous alphaproteobacterial sequences performed previously (33). (b and c) Secondary structure predicted with the Mfold server (70) for the MmgR (b) and MmgRΔ33–51 (c) sRNAs. The sequence replaced in the wild-type sRNA and the sequence introduced in the mutant MmgRΔ33–51 sRNA are highlighted in gray. The asterisk indicates that the corresponding mutant stem-loop (SL) structure is predicted to be shorter than that of the wild type.
FIG 2
FIG 2
Differential growth yield (OD600) between S. meliloti 2011 wild-type and mmgRΔ33–51 mutant strains at the stationary phase of growth in RDM. (a) ○, S. meliloti 2011 wild-type strain; △, S. meliloti 2011 mmgRΔ33–51 strain. Curves with solid or dashed lines represent the culture optical density at 600 nm (OD600) or viable cell count kinetics, respectively. Each curve represents the average from three independent cultures ± SD. The experiment was repeated three times with essentially the same results. (b) OD600 kinetics of cultures in which IPTG was added at an OD600 of 1.6 (right panel) and of noninduced cultures (left panel). The arrow indicates the time point at which IPTG was added to the cultures. 2011, wild-type strain. Each curve represents the average from three independent cultures ± SD. The error bars corresponding to SD values lower than 0.1 OD600 unit might not be visible in the plot. The experiment was repeated twice with essentially the same results.
FIG 3
FIG 3
Accumulation of higher PHB levels in the mmgRΔ33–51 strain than in the wild-type strain during the stationary phase of growth under C/N overbalance in RDM. (a) Cellular dry weight and cellular protein, glycogen, and PHB contents of wild-type and mmgRΔ33–51 cells at the stationary phase of growth. The results are the average of the data from three independent cultures ± SD. The asterisk indicates that the average value for the mmgRΔ33–51 strain differs significantly from that for the wild-type strain at a P value of <0.05. (b) Cellular PHB contents (arbitrary fluorescence units [AFU]) of the wild-type, mmgRΔ33–51, and mmgRΔ33–51 p-sRNA complemented strains at the stationary phase of growth, as determined by flow cytometric analysis with Nile red as a PHB fluorescent stain. Induction with IPTG of the complemented strains was carried out with cultures having an OD600 of 1.6. The results are the average of the data from three independent cultures ± SD. The values were analyzed statistically by Tukey's multiple-comparison test. Different letters over the bars indicate that the average values differ significantly at a P value of <0.05. The experiment was repeated twice with essentially the same results. (c) Northern blot analysis confirming that the MmgR level in the mmgRΔ33–51 p-MmgR strain is restored to nearly wild-type levels in the stationary growth phase (after 90 h of growth) after IPTG addition at an OD600 of 1.6 (after ca. 30 h of growth). The relative abundance of MmgR (normalized to the signal for the 5S rRNA) in the mmgRΔ33–51 p-MmgR strain relative to that in the wild-type strain is indicated over the image. (d) Frequency distribution of the intracellular PHB contents of S. meliloti 2011 (solid line) and mmgRΔ33–51 (dashed line) cells at the stationary growth phase in RDM (C/N ratio, 30:1). Stationary S. meliloti 2011 cells in RDM with a balanced C/N ratio (10:1) were used as a negative control for PHB accumulation (shaded histogram). The effect of induction of plasmid-borne MmgR, MmgRΔ33–51, asRNA812, and Sm84 over the frequency of intracellular PHB content in an mmgRΔ33–51 background is shown in Fig. S2 in the supplemental material.
FIG 4
FIG 4
Limitation of PHB accumulation under conditions of N starvation and surplus C set by the expression of MmgR in S. meliloti. (a) ○, S. meliloti 2011 wild-type strain; △, S. meliloti 2011 mmgRΔ33–51 strain. Curves with solid lines or dashed lines represent the OD600 kinetics of cultures performed in RDM with a 6× (C/N ratio, 60:1) or a 3× (C/N ratio, 30:1) overbalanced C/N ratio, respectively. Each curve represents the average from three independent cultures ± SD. (b) Cellular PHB content (arbitrary fluorescence units [AFU]) of bacteria in the exponential and stationary growth phases under balanced (10:1) or 3× (30:1) and 6× (60:1) overbalanced C/N ratios. PHB was determined by flow cytometry with Nile red as the PHB fluorescent stain. The results are the average of the data from three independent cultures ± SD. The values were analyzed statistically by Tukey's multiple-comparison test. Different letters over the bars indicate that the average values differ significantly at a P value of <0.05. The experiments shown for panels a and b were repeated twice with essentially the same results.
FIG 5
FIG 5
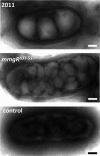
Morphological changes accompanying differential intracellular PHB accumulation. Transmission electron microscopy of wild-type and mmgRΔ33–51 bacteria demonstrated that under conditions of C/N overbalance, stationary-phase mmgRΔ33–51 cells are longer and accumulate a higher number of irregularly shaped PHB granules than the wild-type cells do. The control image corresponds to wild-type bacteria during the exponential phase of growth in RDM, when almost no PHB would be expected to be synthesized. The scale bars indicate a length of 0.25 μm.
FIG 6
FIG 6
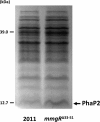
Altered PhaP2 expression in mmgRΔ33–51 mutant cells. SDS-PAGE-based comparative proteomic profiling of the S. meliloti 2011 wild-type and mmgRΔ33–51 strains during the stationary phase of growth in RDM is shown. PhaP2 was identified by mass spectrometry (Orbitrap) (see Materials and Methods) as the major protein component of the material extracted from the band indicated with an arrow. The image shows one representative electrophoretic profile among three repetitions with comparable results. The molecular masses of the reference bands are given on the left side of the image.
FIG 7
FIG 7
Evidence of posttranscriptional regulation of phasins PhaP1 and PhaP2. The comparative abundances of phasins PhaP1 and PhaP2 and their corresponding mRNAs between the S. meliloti 2011 wild-type and mmgRΔ33–51 strains during the stationary phase of growth in RDM are shown. The results are expressed as the average for three biological replicates ± SD. The dashed line indicates the threshold of the M value that was set to consider a certain protein or mRNA as overexpressed in the mutant strain.

Similar articles

Cited by

References

    1. Sawada H, Kuykendall LD, Young JM. 2003. Changing concepts in the systematics of bacterial nitrogen-fixing legume symbionts. J Gen Appl Microbiol 49:155–179. doi:10.2323/jgam.49.155. - DOI - PubMed
    1. Masson-Boivin C, Giraud E, Perret X, Batut J. 2009. Establishing nitrogen-fixing symbiosis with legumes: how many rhizobium recipes? Trends Microbiol 17:458–466. doi:10.1016/j.tim.2009.07.004. - DOI - PubMed
    1. Roumiantseva ML, Andronov EE, Sharypova LA, Dammann-Kalinowski T, Keller M, Young JP, Simarov BV. 2002. Diversity of Sinorhizobium meliloti from the Central Asian Alfalfa Gene Center. Appl Environ Microbiol 68:4694–4697. doi:10.1128/AEM.68.9.4694-4697.2002. - DOI - PMC - PubMed
    1. Horvath B, Kondorosi E, John M, Schmidt J, Torok I, Gyorgypal Z, Barabas I, Wieneke U, Schell J, Kondorosi A. 1986. Organization, structure and symbiotic function of Rhizobium meliloti nodulation genes determining host specificity for alfalfa. Cell 46:335–343. doi:10.1016/0092-8674(86)90654-9. - DOI - PubMed
    1. Jones KM, Kobayashi H, Davies BW, Taga ME, Walker GC. 2007. How rhizobial symbionts invade plants: the Sinorhizobium-Medicago model. Nat Rev Microbiol 5:619–633. doi:10.1038/nrmicro1705. - DOI - PMC - PubMed

MeSH terms

LinkOut - more resources