. 2017 Apr 28;120(9):1426-1439.
doi: 10.1161/CIRCRESAHA.116.309548. Epub 2017 Feb 6.

ORAI1 Activates Proliferation of Lymphatic Endothelial Cells in Response to Laminar Flow Through Krüppel-Like Factors 2 and 4

Affiliations

ORAI1 Activates Proliferation of Lymphatic Endothelial Cells in Response to Laminar Flow Through Krüppel-Like Factors 2 and 4

Dongwon Choi et al. Circ Res. .

Erratum in

Abstract

Rationale: Lymphatic vessels function to drain interstitial fluid from a variety of tissues. Although shear stress generated by fluid flow is known to trigger lymphatic expansion and remodeling, the molecular basis underlying flow-induced lymphatic growth is unknown.

Objective: We aimed to gain a better understanding of the mechanism by which laminar shear stress activates lymphatic proliferation.

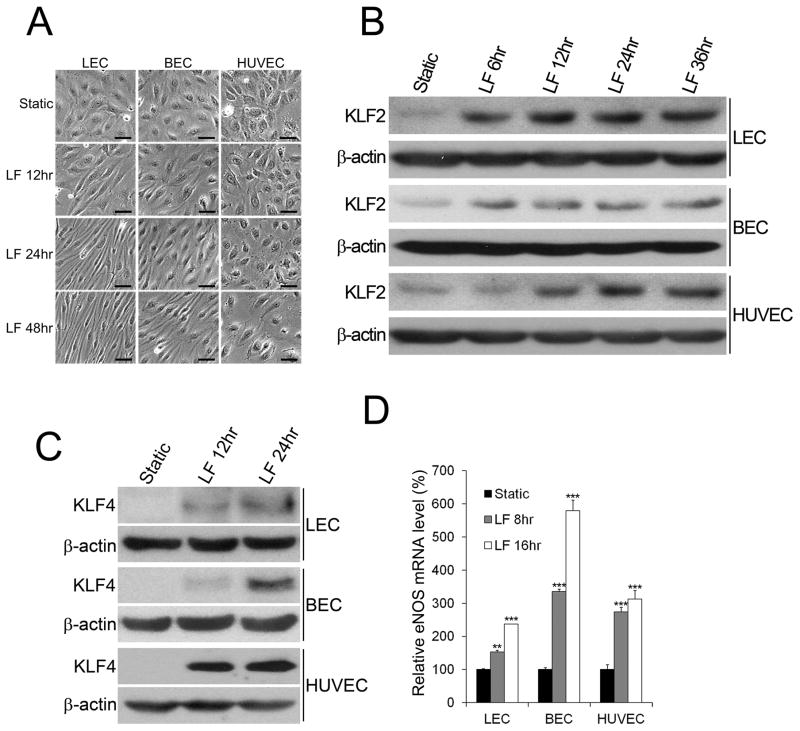
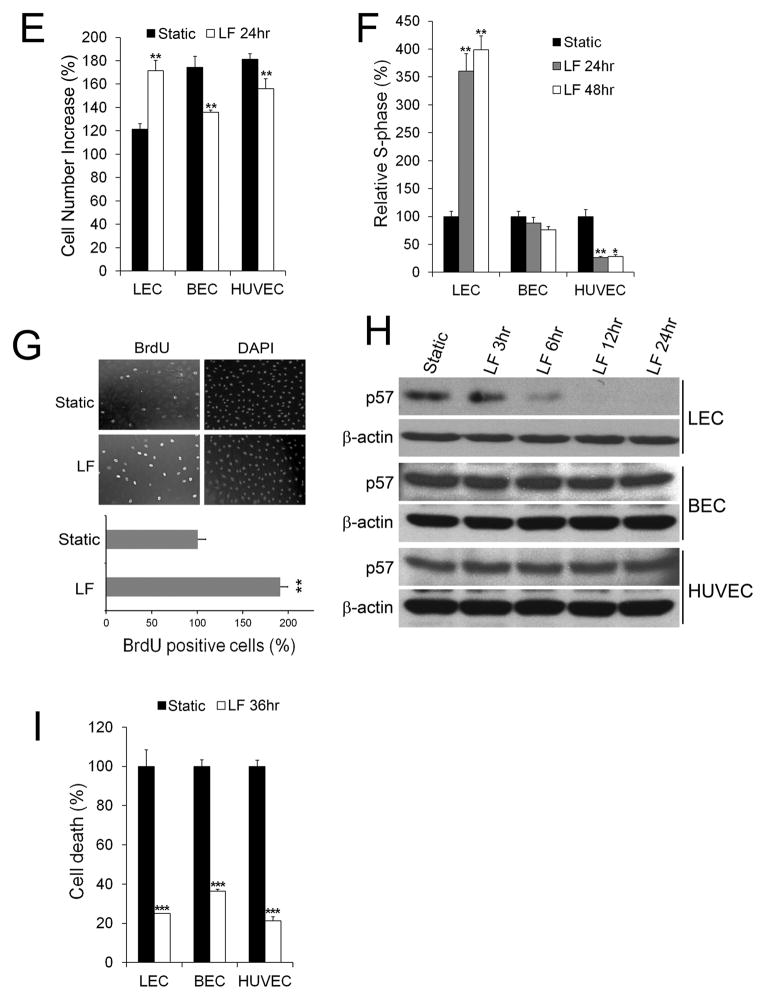
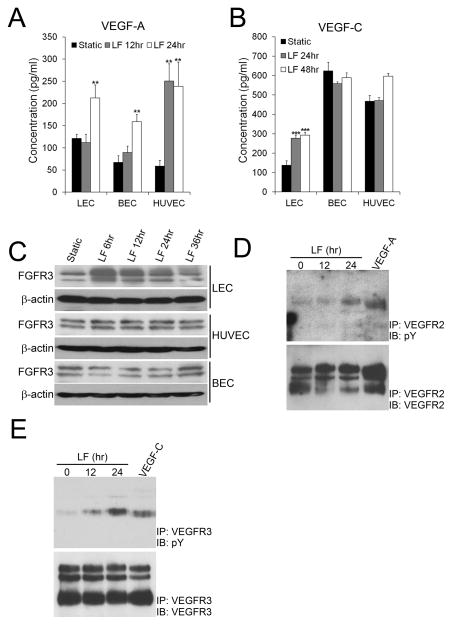
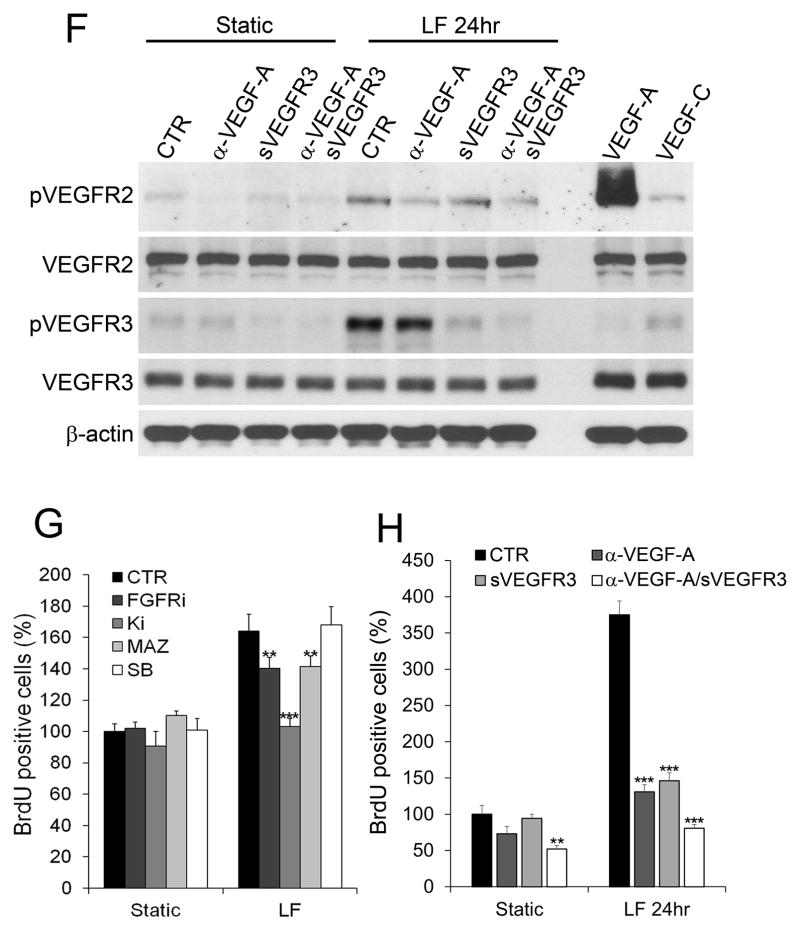
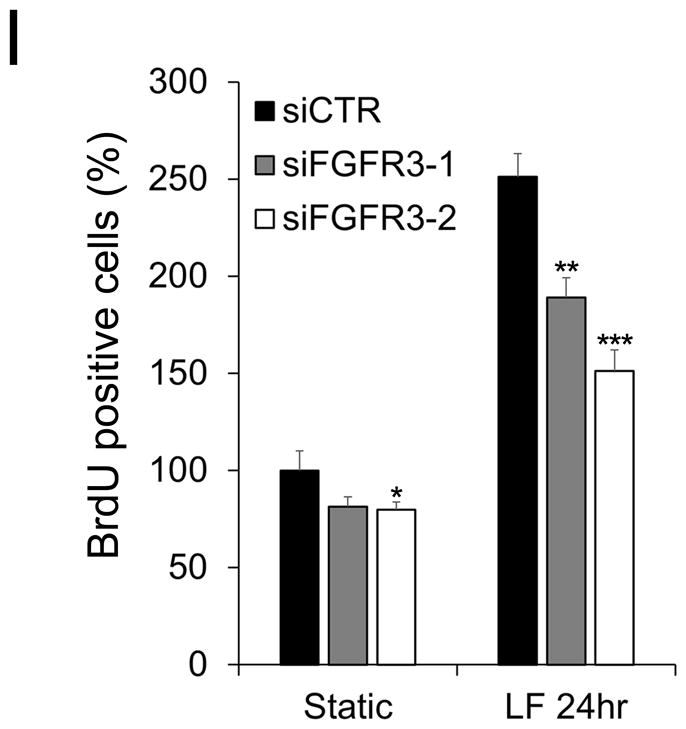
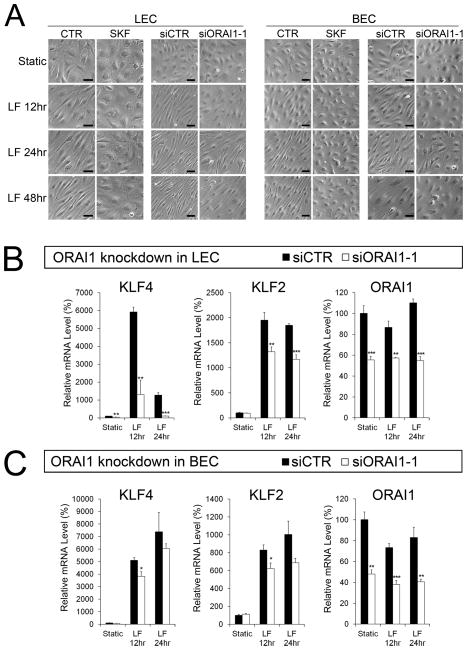
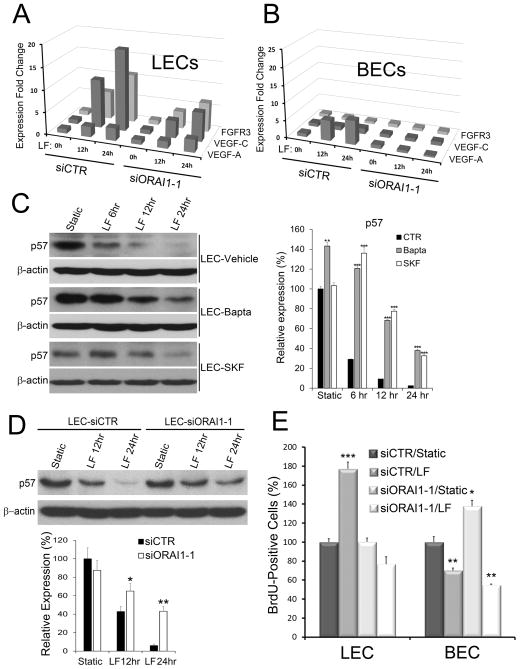
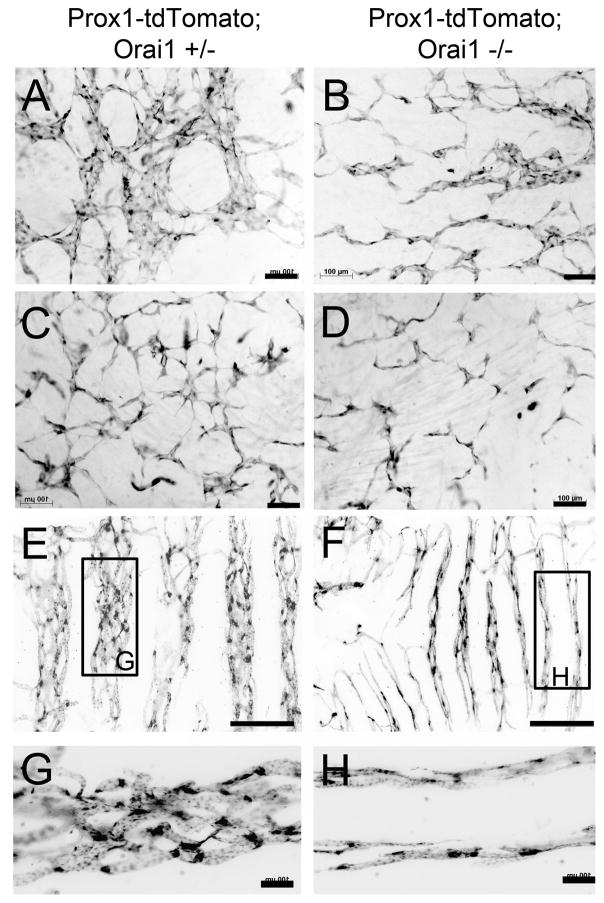
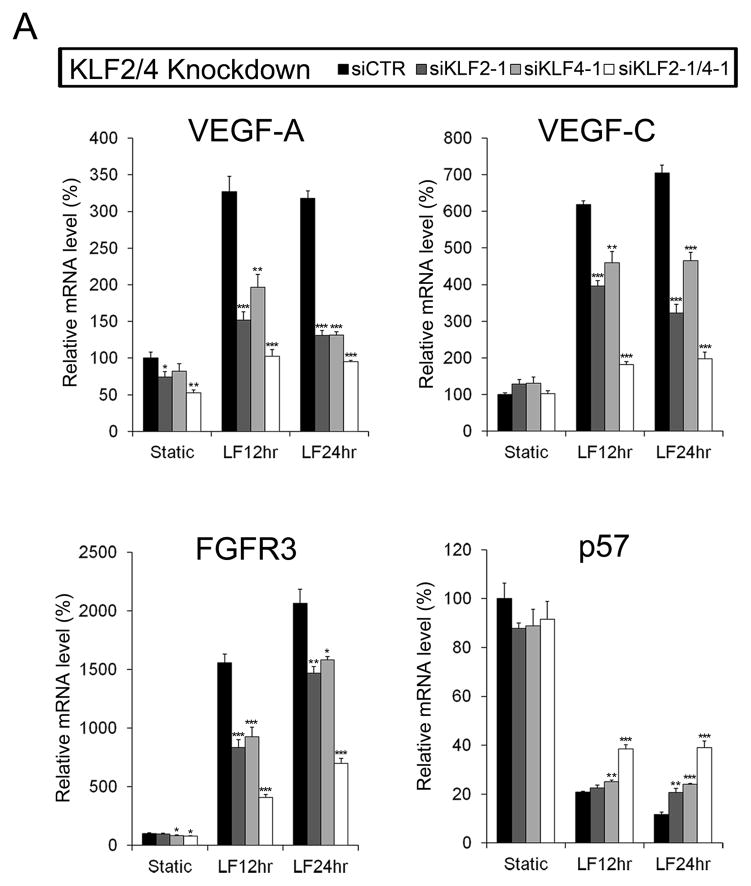
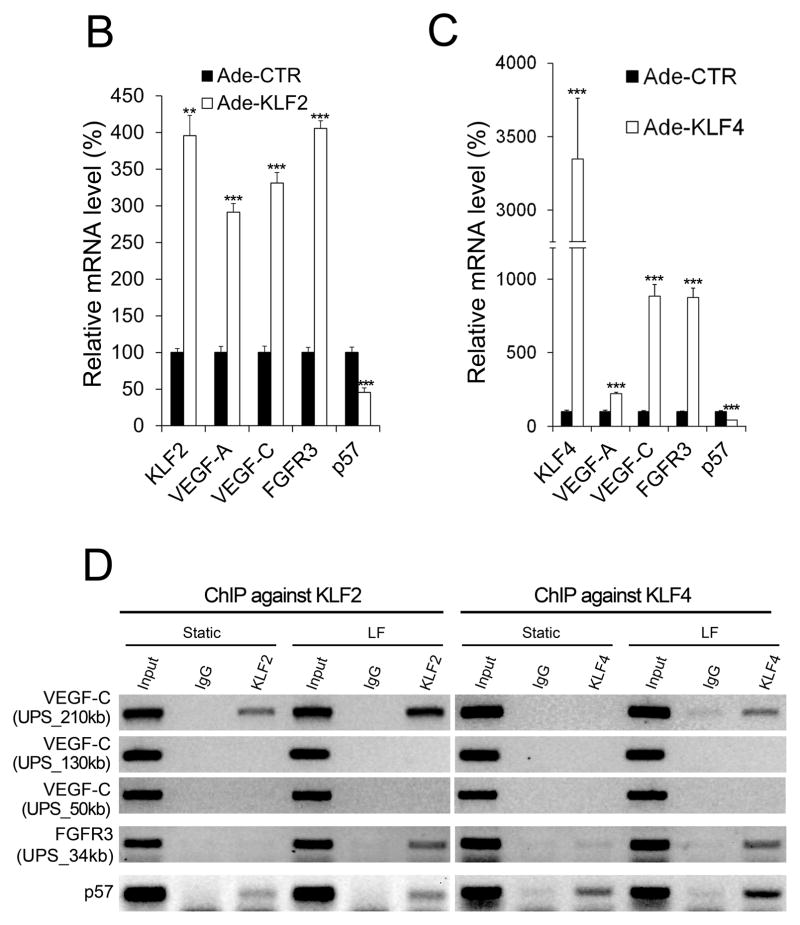
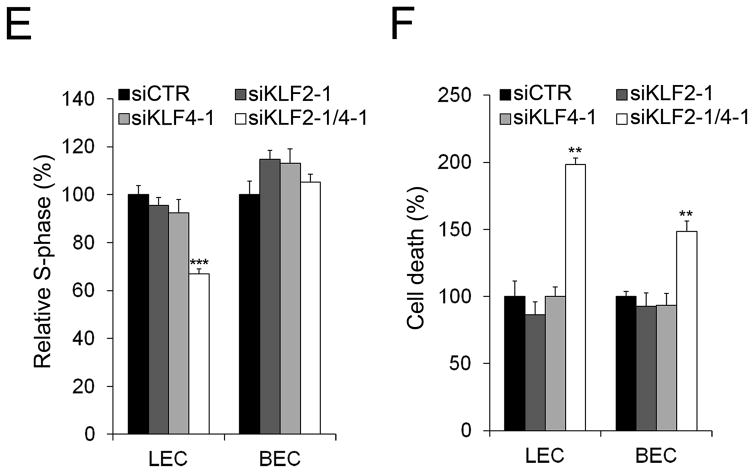
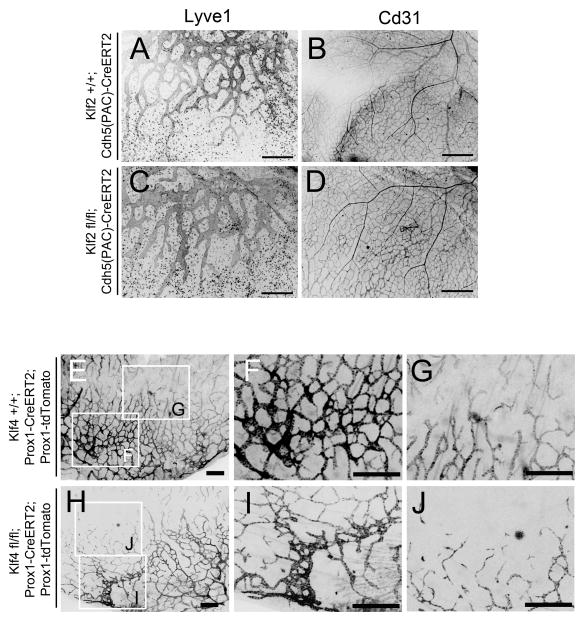
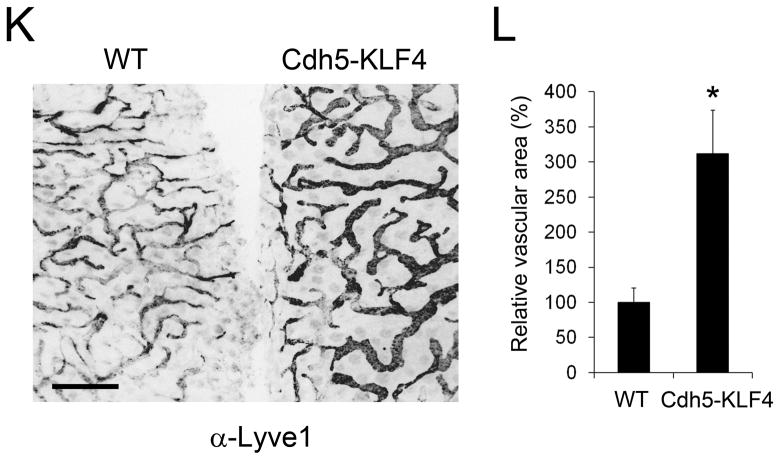
Methods and results: Primary endothelial cells from dermal blood and lymphatic vessels (blood vascular endothelial cells and lymphatic endothelial cells [LECs]) were exposed to low-rate steady laminar flow. Shear stress-induced molecular and cellular responses were defined and verified using various mutant mouse models. Steady laminar flow induced the classic shear stress responses commonly in blood vascular endothelial cells and LECs. Surprisingly, however, only LECs showed enhanced cell proliferation by regulating the vascular endothelial growth factor (VEGF)-A, VEGF-C, FGFR3, and p57/CDKN1C genes. As an early signal mediator, ORAI1, a pore subunit of the calcium release-activated calcium channel, was identified to induce the shear stress phenotypes and cell proliferation in LECs responding to the fluid flow. Mechanistically, ORAI1 induced upregulation of Krüppel-like factor (KLF)-2 and KLF4 in the flow-activated LECs, and the 2 KLF proteins cooperate to regulate VEGF-A, VEGF-C, FGFR3, and p57 by binding to the regulatory regions of the genes. Consistently, freshly isolated LECs from Orai1 knockout embryos displayed reduced expression of KLF2, KLF4, VEGF-A, VEGF-C, and FGFR3 and elevated expression of p57. Accordingly, mouse embryos deficient in Orai1, Klf2, or Klf4 showed a significantly reduced lymphatic density and impaired lymphatic development.

Conclusions: Our study identified a molecular mechanism for laminar flow-activated LEC proliferation.

Keywords: calcium channel; capillary; cell proliferation; lymphatic vessels; vascular endothelial growth factor A.


Conflict of interest statement

DISCLOSURES

The authors declare no conflict of interest with this study.

Figures

Figure 1
Figure 1. Low-rate steady laminar flow selectively activates proliferation of LECs
(A) Steady laminar flow (LF, 2 dyne/cm2) induced elongated cell morphology and alignment in LECs and BECs, with marginal changes in HUVECs. Scale bars: 50 μm. (B,C) Western blot assays showing upregulation of KLF2 (B) and KLF4 (C) in LECs, BECs and HUVECs in response to steady laminar flow (2 dyne/cm2) for indicated time. (D) Quantitative RT-PCR (qRT-PCR) showing upregulation of eNOS in LECs, BECs and HUVECs by steady laminar flow (2 dyne/cm2) for 8 and 16 hr. (E) Total cell number increase after static culturing or laminar flow exposure. Equal number of LECs, BECs, and HUBECs were plated and subjected or not to laminar flow (2 dyne/cm2). After 24 hr., total cell number was counted and the percent increase from the initial cell numbers was graphed. (F) LECs, BECs, and HUBECs were cultured under the static or flow condition (2 dyne/cm2) and the relative percentage of cells in the S-phase was determined using flow cytometry. (G) BrdU-incorporation assays showing the percent of BrdU-positive LECs under the static or flow condition for 48 hr. Top: Fluorescent images showing BrdU-incorporated cells (Green) and total nuclei (Blue). Bottom: Bar graph representing the percent of the BrdU-positive cells. (H) Western blot assays showing LEC-specific downregulation of p57 by laminar flow (2 dyne/cm2). (I) ELISA-based cell death assays showing that laminar flow (2 dyne/cm2) commonly reduced cell death in all cell types. Error bars in the graphs represent the standard deviation (SD) of the mean. Laminar flow was steadily applied at 2 dyne/cm2 as previously described . Using two-tailed t-test, statistical significance was calculated between the static vs. laminar flow conditions, and the significance level was expressed as follows: *, p < 0.05; **, p < 0.01; ***, p < 0.001.
Figure 2
Figure 2. Molecular players in laminar flow-induced LEC proliferation
(A–C) Steady laminar flow (LF) upregulated VEGF-A (A) in LECs, BECs, and HUVECs, while activing the expression of VEGF-C (B) and FGFR3 (C) specifically in LECs, determined by ELISA (A,B) and western blot assays (C). (D,E) Laminar flow increased phosphorylation of VEGFR2 (D) and VEGFR3 (E) in LECs. LECs were exposed to laminar flow and then subjected to immunoprecipitation (IP) for VEGFR2 or VEGFR3, followed by immunoblotting (IB) for phosphorylated tyrosine (pY). As controls, LECs under the static condition were treated with VEGF-A (20 ng/ml) or VEGF-C (20 ng/ml) for 15 minutes before cell harvest. (F) Western blot assays showing the ligand-dependency of the flow-induced phosphorylation of VEGFR2 and VEGFR3 in LECs. LECs were pre-incubated for 10 min. with a VEGF-A neutralizing antibody (α-VEGF-A, 20 ng/mL) and/or soluble VEGFR3 receptor (sVEGFR3, 20 ng/mL), followed by static culturing or laminar flow for 24hr. Western blots were performed using antibodies against phospho-VEGFR2, whole VEGFR2, phospho-VEGFR3, whole VEGFR3 and β-actin. As controls, LECs under the static condition were treated with VEGF-A (20 ng/ml) or VEGF-C (20 ng/ml) for 15 min. before cell harvest. (G–I) BrdU-incorporation assays were performed to estimate the roles of VEGFRs and FGFR3 in the laminar flow-induced LEC proliferation. (G) LECs were pre-treated for 10 min. with chemical inhibitors of FGFR3 (FGFRi, 50 μM of PD 166866), VEGFR2 (Ki, 50 μM of Ki8751), VEGFR3 (MAZ, 50 μM of MAZ51), or CXCR2 (SB, 50 μM of SB225002), followed by static culturing or laminar flow exposure for 24 hr. before BrdU assays. (H) LECs were pre-incubated for 10 min. with a VEGF-A neutralizing antibody (α-VEGF-A, 20 ng/mL) and/or soluble VEGFR3 receptor (sVEGFR3, 20 ng/mL), followed by 24-hr. exposure to static culturing or laminar flow and then subjected to the BrdU assays. (I) LECs were transfected with two different siRNAs for FGFR3 (siFGFR3-1, siFGFR3-2), or control siRNA (siCTR), overnight prior to static culturing or laminar flow for 24 hr. and then subjected to BrdU assay. Laminar flow was applied at 2 dyne/cm2 as previously described . Error bars indicate the standard deviations (SD) of the mean. Using two-tailed t-test, statistical significance was calculated between the static vs. laminar flow conditions (A,B) or between the control vs. treated groups (G–I). Statistical values: **, p < 0.01; ***, p < 0.001.
Figure 3
Figure 3. ORAI1 mediates the laminar flow-induced upregulation of KLF2 and KLF4 in LECs
(A) Inhibition of ORAI1 impaired the flow-induced cellular elongation and alignment of LECs and BECs. LECs or BECs were exposed to laminar flow (2 dyne/cm2) using culture media in the absence (CTR) or presence of SKF (SKF-96365, 10 μM). Alternatively, the cells were transfected with non-specific siRNA (siCTR) or ORAI1 siRNA (siORAI1-1) for 24 hr. before the onset of laminar flow (2 dyne/cm2). Scale bars: 50 μm. (B,C) qRT-PCR analyses showing the expression of KLF4, KLF2 and ORAI1 in LECs (B) and BECs (C), which were transfected with non-specific siRNA (siCTR) or ORAI1 siRNA (siORAI1) for 24 hr. before the onset of laminar flow (2 dyne/cm2). Another set of ORAI1 siRNA (siOrai1-2) was used and comparable results were obtained (Online Figure IV G–I). Error bars indicate the standard deviations (SD) of the mean. Using two-tailed t-test, statistical significance was calculated between the siCTR vs. siORAI1 groups. Statistical values: *, p < 0.05; **, p < 0.01; ***, p < 0.001.
Figure 4
Figure 4. ORAI1 is essential for the laminar flow-response phenotypes of LECs
(A,B) qRT-PCR analyses showing the expression of VEGF-A, VEGF-C and FGFR3 in LECs (A) and BECs (B) that were transfected with non-specific siRNA (siCTR) or ORAI1 siRNA (siORAI1-1) for 24 hr. and exposed to laminar flow (2 dyne/cm2) for 0, 12 or 24 hr. Another set of ORAI1 siRNA (siOrai1-2) was used and comparable results were obtained (Online Figure IV J-L). (C) Western blot analyses (left) showing the expression of p57 in LECs that were pre-treated with vehicle (DMSO), Bapta-AM (3 μM), or SKF-96365 (SKF, 10 μM) for 30 min. and exposed to laminar flow (2 dyne/cm2) for 0 (Static), 6, 12, or 24 hr. Expression of p57 protein was quantified and normalized against β-actin in the graph (right). (D) Western blot analyses (top) showing the expression of p57 in LECs that were transfected with non-specific siRNA (siCTR) or ORAI1 siRNA (siORAI1) for 24 hr. and exposed to laminar flow (2 dyne/cm2) for 0 (Static), 12, and 24 hr. p57 expression was quantified and normalized against β-actin in the graph (bottom). Another set of ORAI1 siRNA (siOrai1-2) was used and comparable results were obtained (Online Figure IV M). (E) BrdU-incorporation assay showing the relative percent of cells in the S-phase. LECs or BECs were transfected with control siRNA (siCTR) or ORAI1 siRNA (siORAI1) for 24 hr. and cultured under the static or flow condition (2 dyne/cm2) for 24 hr. before BrdU-incorporation assay. Error bars: the standard deviations (SD) of the mean. Statistical significance was calculated using two-tailed t-test between the control vs. treated groups (C), between the siCTR vs. siORAI1 groups (D), or between the siCTR/Static vs. other groups (E). Statistical values: *, p < 0.05; **, p < 0.01; ***, p < 0.001.
Figure 5
Figure 5. ORAI1 is required for embryonic lymphatic development
(A–D) Developing dermal lymphatic vessels were visualized in Orai1 heterozygote (+/−) and homozygote (−/−) KO embryos (E14.5) using the Prox1-tdTomato lymphatic reporter . Compared to lymphatic vessels of Orai1 heterozygote embryos (A,C, n=5), those of homozygote KO embryos (B,D, n=4) displayed a significantly reduced number of LECs and impaired lymphatic vessel formation in the dorsolateral (A,B) and dorsal midline (C,D) areas. (E–H) Lymphatic vessels in the trachea of rarely surviving 3-week old Orai1 KO mouse (F,H, n=3) were abnormally thinner, compared to those of heterozygote littermates (E,G, n=6). Boxed areas in panels E and F are enlarged in panels G and H, respectively. Scale bars; 100 μm (A–D, G,H), 500 μm (E,F). Relative lymphatic vascular areas were shown in Online Figure VII A,B.
Figure 6
Figure 6. KLF2 and KLF4 regulate molecular players in flow-induced LEC proliferation
(A) qRT-PCR data showing the effects of KLF2, KLF4 or combined knockdown on the expression of VEGF-A, VEGF-C, FGFR3 and p57 in LECs exposed to laminar flow. Knockdown was performed for 24hr. prior to the onset of laminar flow (2 dyne/cm2) for 12 or 24hr. Data were obtained by using 2 independent siRNA for KLF2 (siKLF2-1, siKLF2-2) and KLF4 (siKLF4-1, siKLF4-2), individually and together, and displayed here and Online Figure IX A–D. Expression levels of KLF2 and KLF4 after individual or combined knockdowns are shown in Online Figure IX F. (B,C) qRT-PCR assays showing the expression of these genes in LECs that were infected for 48 hr. with adenovirus expressing KLF2 (Ade-KLF2) (B), or KLF4 (Ade-KLF4) (C). Ade-CTR, control adenovirus. (D) ChIP assays showing association of KLF2 and KLF4 proteins to the regulatory regions of the VEGF-C, FGFR3, and p57 genes. LECs were exposed to laminar flow (2 dyne/cm2) for 6 hr. and ChIP assays were performed using normal IgG, anti-KLF2 or anti-KLF4 antibody and the primers against the indicated upstream sequences (UPS) regions. Detailed locations of these regions can be found in Online Figure X. (E,F) Effects of the individual or combined knockdown of KLF2 and/or KLF4 on the percent of cells in the S phase (E) and on the cell death (F) of LECs. LECs were transfected with control siRNA (siCTR), KLF2 siRNA (siKLF2) and/or KLF4 siRNA (siKLF4) for 24 hr. under the static condition, followed by flow cytometry-based measurement of the S phase cell population (E) or by ELISA-based measurement of cell death (F). Statistical significance was calculated using two-tailed t-test between the siCTR vs. siKLF2/siKLF4 groups (A,E,F), or between the Ade-CTR vs. Ade-KLF2/KLF4 groups (B,C). Statistical values: *, p < 0.05; **, p < 0.01; ***, p < 0.001.
Figure 7
Figure 7. Defective lymphatic development by targeted deletion of Klf2 or Klf4
(A–D) Developing dermal lymphatic and blood vessels were stained using anti-Lyve1 (A,C) and anti-Cd31 (B,D) antibodies, respectively, in the control embryos (Klf2 +/+; Cdh5(PAC)-CreERT2) or endothelial-specific inducible Klf2 KO embryos (Klf2 fl/fl;Cdh5(PAC)-CreERT2). Tamoxifen-responsive Cre was activated by intraperitoneal injection of tamoxifen (1.5 mg) into pregnant females at E11.5 and 13.5, and their embryos were harvest at E15.5 for vascular analyses. Relative vascular areas (%) are shown in Online Figure VII C. More than 6 embryos were analyzed per genotype. (E–J) Dermal lymphatic and blood vessels were visualized in the control embryos (Klf4 +/+; Prox1-CreERT2; Prox1-tdTomato) or lymphatic-specific Klf4 KO embryos (Klf4 fl/fl; Prox1-CreERT2; Prox1-tdTomato) at E15.5. Tamoxifen-responsive Cre was activated in the same way as for the Klf2 deletion described above. Lymphatic vessels were visualized using the tdTomato reporter. Enlarged images of the boxed regions are shown in the specified panels. Relative vascular areas (%) are shown in Online Figure VII D. More than 6 embryos were analyzed per genotype. (K,L) The ear lymphatics of wild type (WT) or Cdh5-KLF4 transgenic adult mice were stained with anti-Lyve1 antibody (K). Relative lymphatic vascular area (%) in wild type and Cdh5-KLF4 transgenic mice (n >3) were quantitated (L). Error bars display the standard deviations (SD) of the mean. Statistical values: *, p < 0.05. Scale bars: 500 μm (A–N, S), 100 μm (O–R).

Comment in

References

    1. Schwartz MA, Simons M. Lymphatics thrive on stress: mechanical force in lymphatic development. EMBO J. 2012;31:781–782. - PMC - PubMed
    1. Planas-Paz L, Strilić B, Goedecke A, Breier G, Fässler R, Lammert E, Strilic B. Mechanoinduction of lymph vessel expansion. The EMBO journal. 2012;31:788–804. - PMC - PubMed
    1. Sabine A, Agalarov Y, Maby-El Hajjami H, Jaquet M, Hagerling R, Pollmann C, Bebber D, Pfenniger A, Miura N, Dormond O, Calmes JM, Adams RH, Makinen T, Kiefer F, Kwak BR, Petrova TV. Mechanotransduction, PROX1, and FOXC2 cooperate to control connexin37 and calcineurin during lymphatic-valve formation. Dev Cell. 2012;22:430–445. - PubMed
    1. Sweet DT, Jimenez JM, Chang J, Hess PR, Mericko-Ishizuka P, Fu J, Xia L, Davies PF, Kahn ML. Lymph flow regulates collecting lymphatic vessel maturation in vivo. J Clin Invest. 2015;125:2995–3007. - PMC - PubMed
    1. Dewey CF, Jr, Bussolari SR, Gimbrone MA, Jr, Davies PF. The dynamic response of vascular endothelial cells to fluid shear stress. J Biomech Eng. 1981;103:177–185. - PubMed

MeSH terms

Substances