. 2017 Apr;27(4):626-638.
doi: 10.1101/gr.216242.116. Epub 2017 Feb 6.

Microbial strain-level population structure and genetic diversity from metagenomes

Affiliations

Microbial strain-level population structure and genetic diversity from metagenomes

Duy Tin Truong et al. Genome Res. 2017 Apr.

Abstract

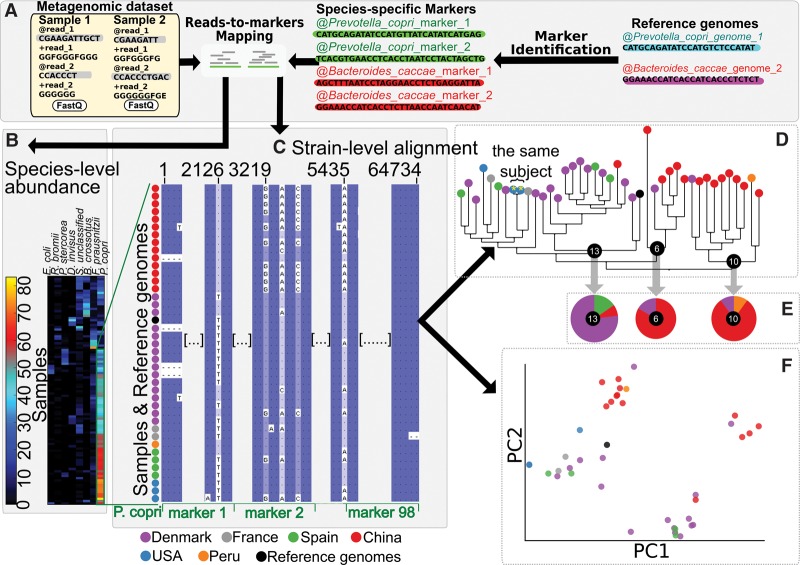
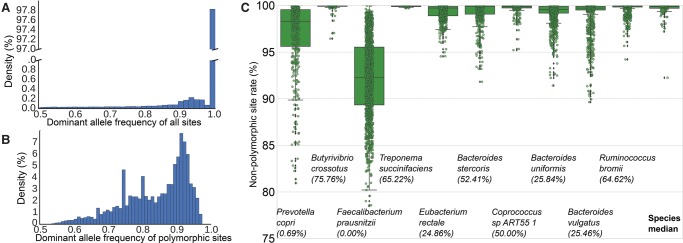
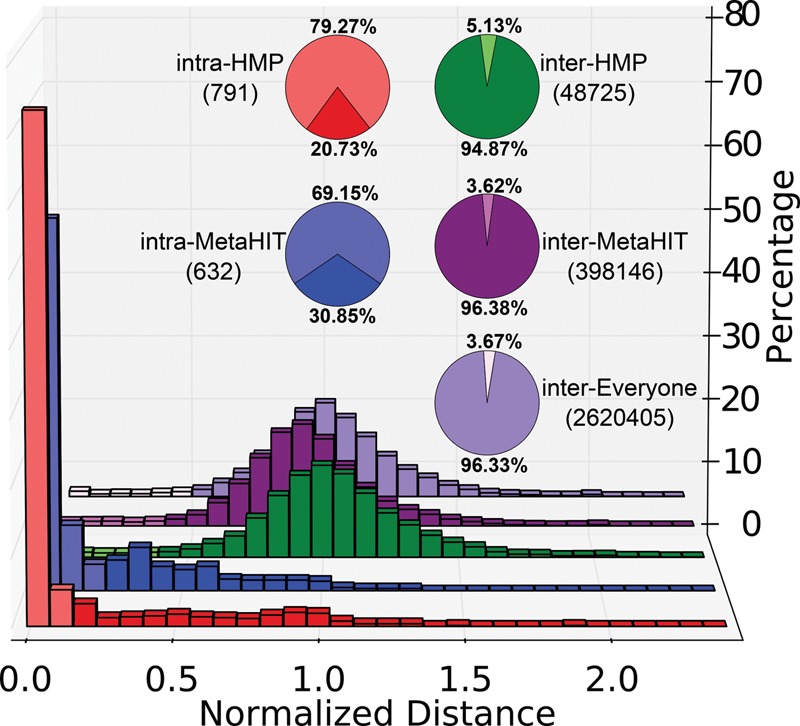
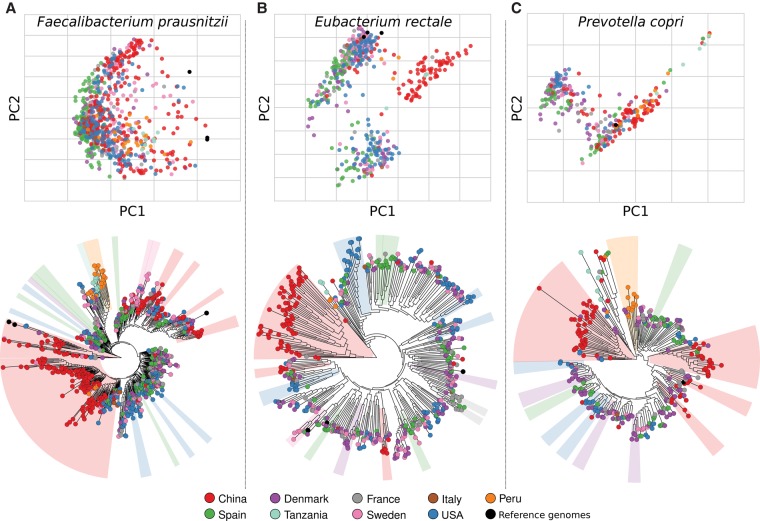
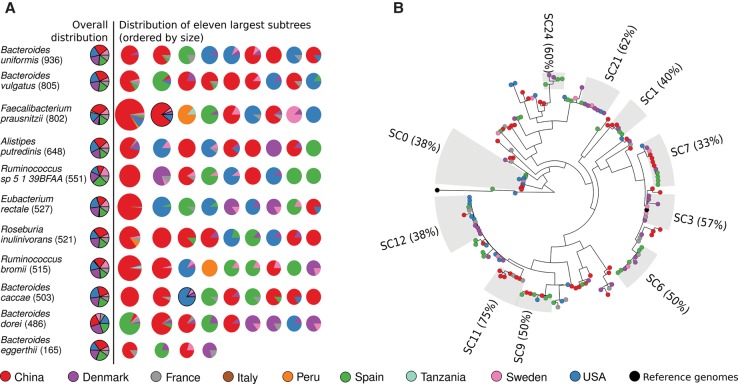
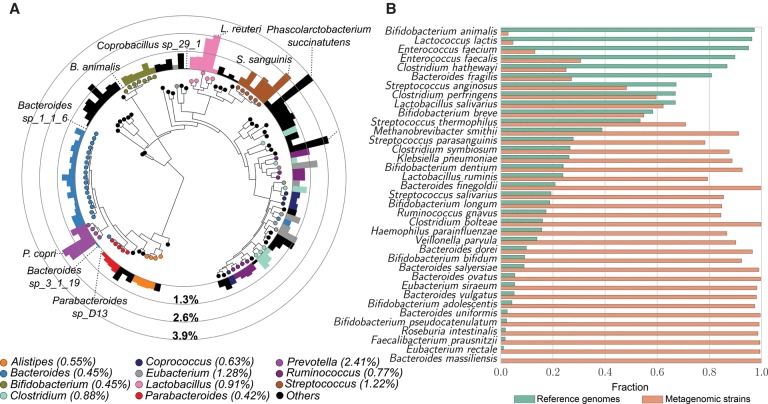
Among the human health conditions linked to microbial communities, phenotypes are often associated with only a subset of strains within causal microbial groups. Although it has been critical for decades in microbial physiology to characterize individual strains, this has been challenging when using culture-independent high-throughput metagenomics. We introduce StrainPhlAn, a novel metagenomic strain identification approach, and apply it to characterize the genetic structure of thousands of strains from more than 125 species in more than 1500 gut metagenomes drawn from populations spanning North and South American, European, Asian, and African countries. The method relies on per-sample dominant sequence variant reconstruction within species-specific marker genes. It identified primarily subject-specific strain variants (<5% inter-subject strain sharing), and we determined that a single strain typically dominated each species and was retained over time (for >70% of species). Microbial population structure was correlated in several distinct ways with the geographic structure of the host population. In some cases, discrete subspecies (e.g., for Eubacterium rectale and Prevotella copri) or continuous microbial genetic variations (e.g., for Faecalibacterium prausnitzii) were associated with geographically distinct human populations, whereas few strains occurred in multiple unrelated cohorts. We further estimated the genetic variability of gut microbes, with Bacteroides species appearing remarkably consistent (0.45% median number of nucleotide variants between strains), whereas P. copri was among the most plastic gut colonizers. We thus characterize here the population genetics of previously inaccessible intestinal microbes, providing a comprehensive strain-level genetic overview of the gut microbial diversity.


Figures

Figure 1.
Figure 1.
StrainPhlAn for strain identification and tracking in shotgun metagenomes and its application to Prevotella copri in the human gut. StrainPhlAn provides a method to identify strains from shotgun metagenomes and provides tracking, comparative, and phylogenetic analyses across samples. Here, we illustrate results using Prevotella copri as an example species in a demonstration subset of this study's human gut metagenomes. (A) In this overview of the method, for each species for which strains are to be analyzed across a metagenome collection, sample-specific and strain-specific markers are constructed by mapping reads against the MetaPhlAn2 (Truong et al. 2015) database of species-specific reference sequences. (B) In each sample, species are identified and quantified if sufficient coverage for the species markers is detected. Here, 100 samples with sufficiently abundant P. copri are shown (seven other abundant species are also displayed). (C) The preselected species-specific markers are concatenated, aligned, and variants identified using the consensus sequence of mapped metagenomic reads. (D) From the resulting set of the most abundant strains per sample, a phylogenetic tree can be built. This allows, for example, retained or minimally divergent strains within a particular environment (e.g., human host) to be easily identified when they appear within the same subtrees. (E) Strains or subtrees can also be statistically associated with sample metadata (e.g., human or environmental phenotypes). (F) Each species’ genetic diversity and divergence can be easily visualized as an ordination comparable to those used for isolate or human population genetics.
Figure 2.
Figure 2.
Most species are dominated by a single strain in the human gut. (A) Distribution of dominant allele frequency for all nucleotide positions in concatenated species-specific markers across all analyzed samples (>482 million total nucleotides). (B) Distribution of the dominant allele frequency for polymorphic positions. We report the median frequencies for each species/sample pair. (C) Distribution of nonpolymorphic site prevalence in samples for the 10 most prevalent gut bacterial species (for the full set of species, see Supplemental Fig. S9). The fraction of nonpolymorphic sites varies from sample to sample and from species to species. In parentheses, we quantify the percentage of strains with >99.9% of nonpolymorphic sites.
Figure 3.
Figure 3.
Most strains are retained over time within the human gut, but few strains are carried by multiple subjects. The distribution of the all-versus-all normalized genetic distance between strains is reported for increasingly large metagenome collections (only MetaHIT, only the HMP, or all 1590 samples). For MetaHIT and the HMP, we also computed the intra-subject distances (temporal separation between samplings averaging 163 SD 125 d and 219 SD 69 d, respectively) normalized based on the median of the all-versus-all comparisons.
Figure 4.
Figure 4.
Population genetic structure of three common intestinal species and its association with sampling geography. Strain population structures for three representative human gut species, reported both as phylogenies built on the concatenated alignments of each species-specific reconstructed marker set (bottom). To highlight the presence of discrete clusters of related strains, we also report the genetic distances measured on the alignments as principal coordinate ordinations (top). We report the population structure of Faecalibacterium prausnitzii (A), Eubacterium rectale (B), and Prevotella copri (C). Results for additional species are reported in Supplemental Figures S12–S16, S18–S24.
Figure 5.
Figure 5.
Associations between subspecies clades and geographical location in the 10 most prevalent gut species and Bacteroides eggerthii. (A) For each of the 10 most prevalent species and Bacteroides eggerthii in this sample set, we show the prevalence of each country in the 11 largest subtrees, ordered by size. Subtrees containing reference isolate genomes are marked with a black border. Information regarding subtrees for all species is available as Supplemental Figures S42–S44. (B) Example phylogenetic tree of Bacteroides eggerthii with the identified subclades.
Figure 6.
Figure 6.
Overall species diversity evaluated across intestinal samples and compared with the diversity available from reference genomes. (A) For the 112 species with concatenated marker length >10,000 nt, we built a phylogenetic tree using PhyloPhlAn (Segata et al. 2013) and GraPhlAn (Asnicar et al. 2015) and here report their median SNV rate computed on all pairwise comparisons in this sample set. The median SNV of each genus is reported in parenthesis in the legend. Species diversity ranges between 0.018% (B. animalis) and 3.9% (Phascolarctobacterium succinatutens) and is partially correlated with phylogeny (Bacteroides, Parabacteroides, Bifidobacterium, and Alistipes species show consistently lower diversity than Prevotella, Lactobacillus, and Streptococcus species). No significant correlation between diversity and total prevalence or average abundance was observed (Supplemental Fig. S45). Detailed information for each species is reported in Supplemental Table S9. (B) Fraction of total branch length spanned by strains sequenced as isolate reference genomes versus branch length spanned by strains from metagenomes. This figure includes species with at least 10 samples, three reference genomes, and concatenated marker length >10,000 nt. The complete set of species is provided in Supplemental Figure S46.

References

    1. Achtman M, Wagner M. 2008. Microbial diversity and the genetic nature of microbial species. Nat Rev Microbiol 6: 431–440. - PubMed
    1. Alneberg J, Bjarnason BS, de Bruijn I, Schirmer M, Quick J, Ijaz UZ, Lahti L, Loman NJ, Andersson AF, Quince C. 2014. Binning metagenomic contigs by coverage and composition. Nat Methods 11: 1144–1146. - PubMed
    1. Altschul SF, Gish W, Miller W, Myers EW, Lipman DJ. 1990. Basic local alignment search tool. J Mol Biol 215: 403–410. - PubMed
    1. Arumugam M, Raes J, Pelletier E, Le Paslier D, Yamada T, Mende DR, Fernandes GR, Tap J, Bruls T, Batto JM, et al. 2011. Enterotypes of the human gut microbiome. Nature 473: 174–180. - PMC - PubMed
    1. Asnicar F, Weingart G, Tickle TL, Huttenhower C, Segata N. 2015. Compact graphical representation of phylogenetic data and metadata with GraPhlAn. PeerJ 3: e1029. - PMC - PubMed

Publication types