. 2017 Feb 21;114(8):E1365-E1374.
doi: 10.1073/pnas.1612254114. Epub 2017 Feb 6.

Molecular basis of fatty acid selectivity in the zDHHC family of S-acyltransferases revealed by click chemistry

Affiliations

Molecular basis of fatty acid selectivity in the zDHHC family of S-acyltransferases revealed by click chemistry

Jennifer Greaves et al. Proc Natl Acad Sci U S A. .

Abstract

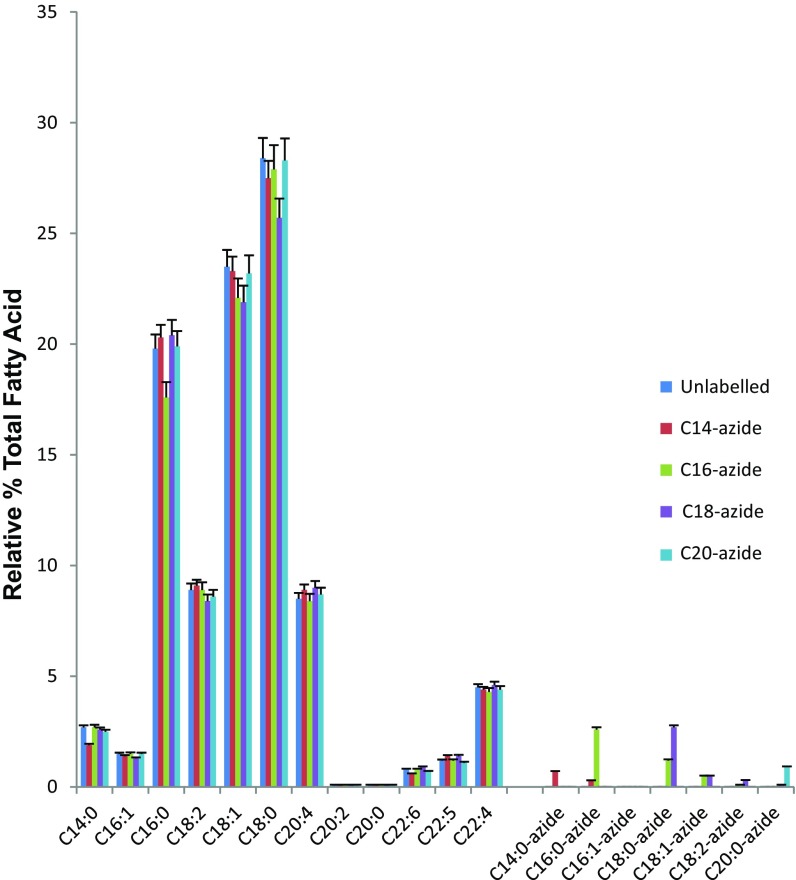
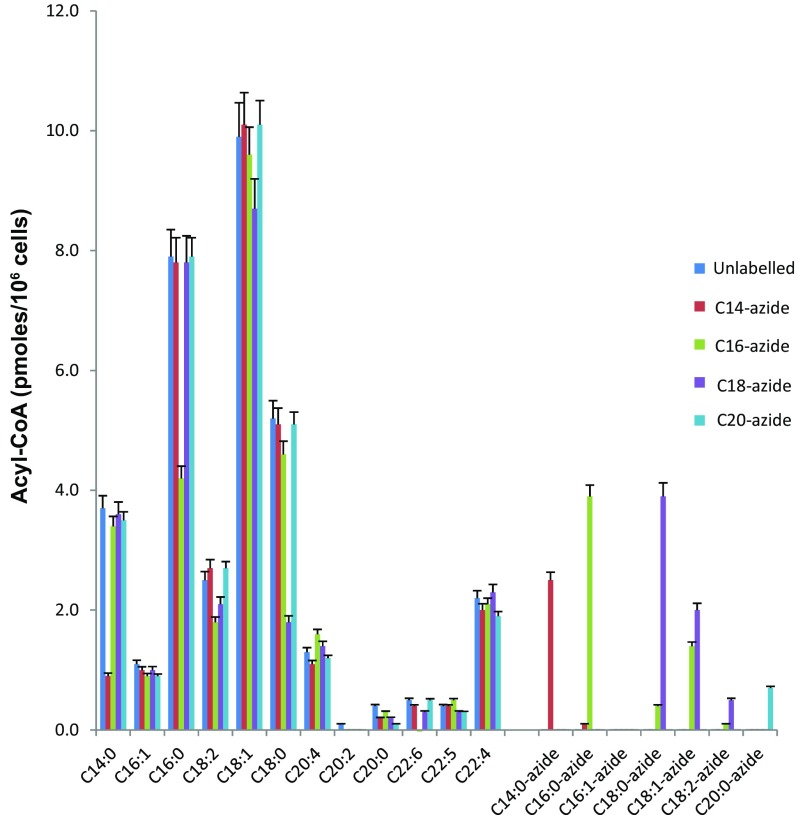
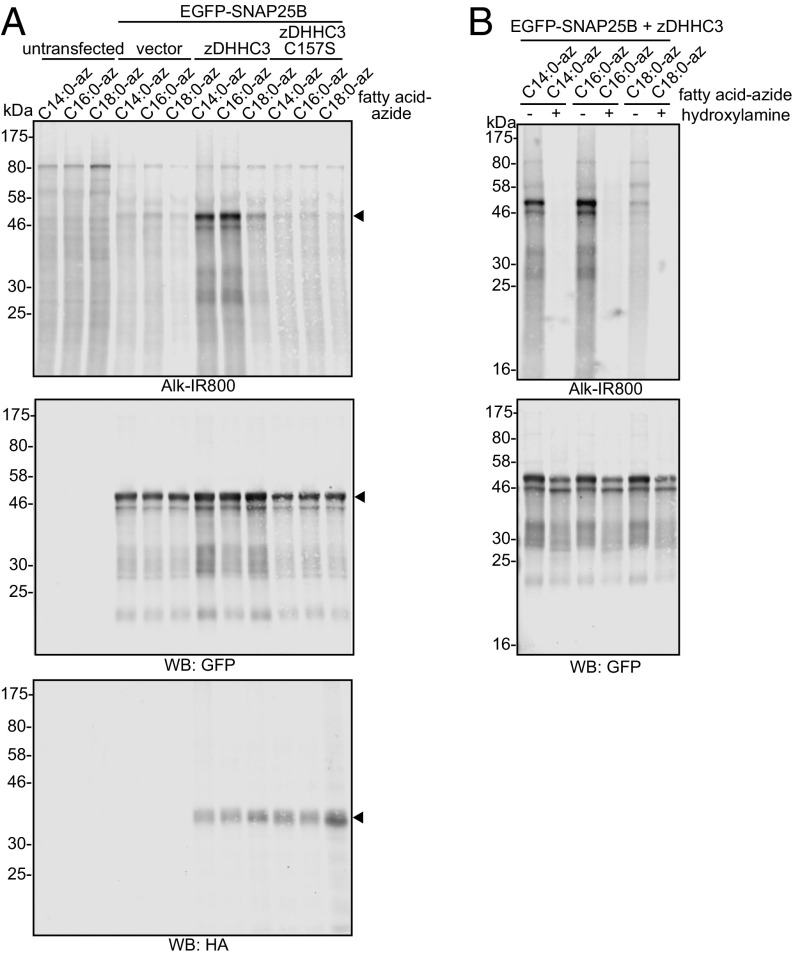
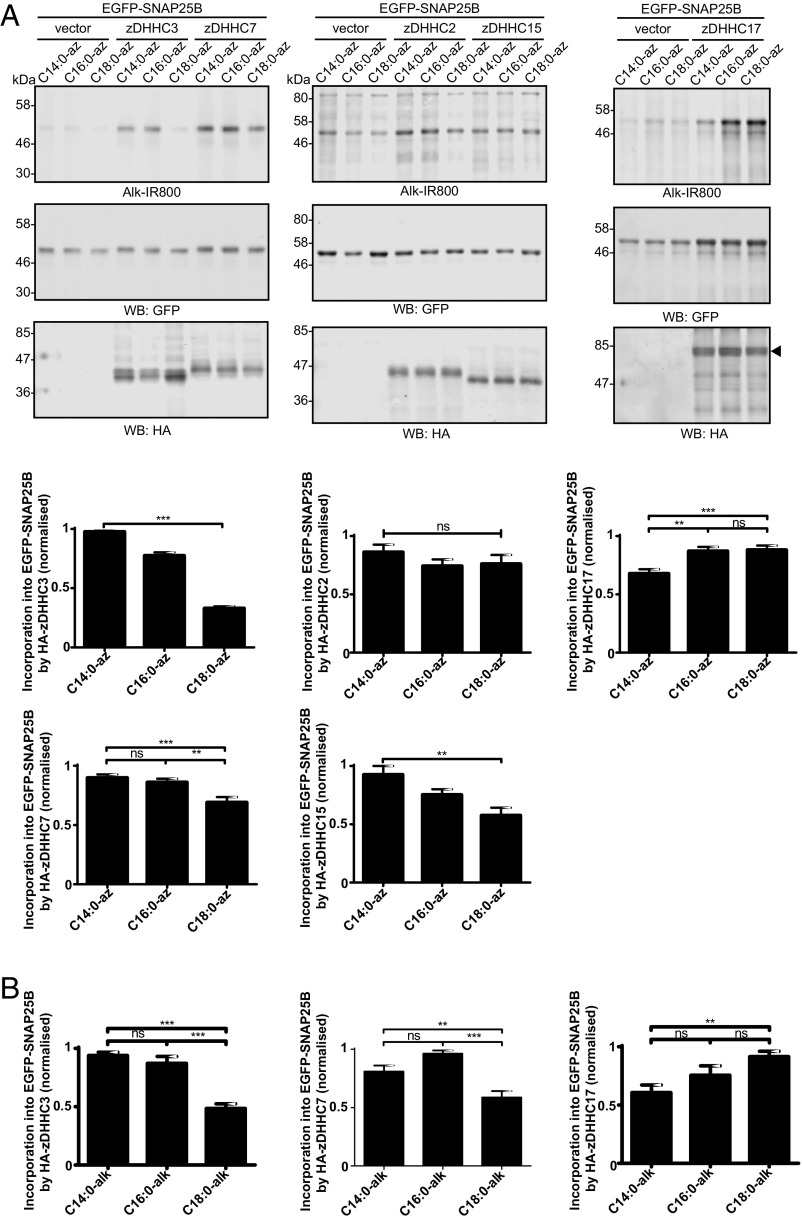
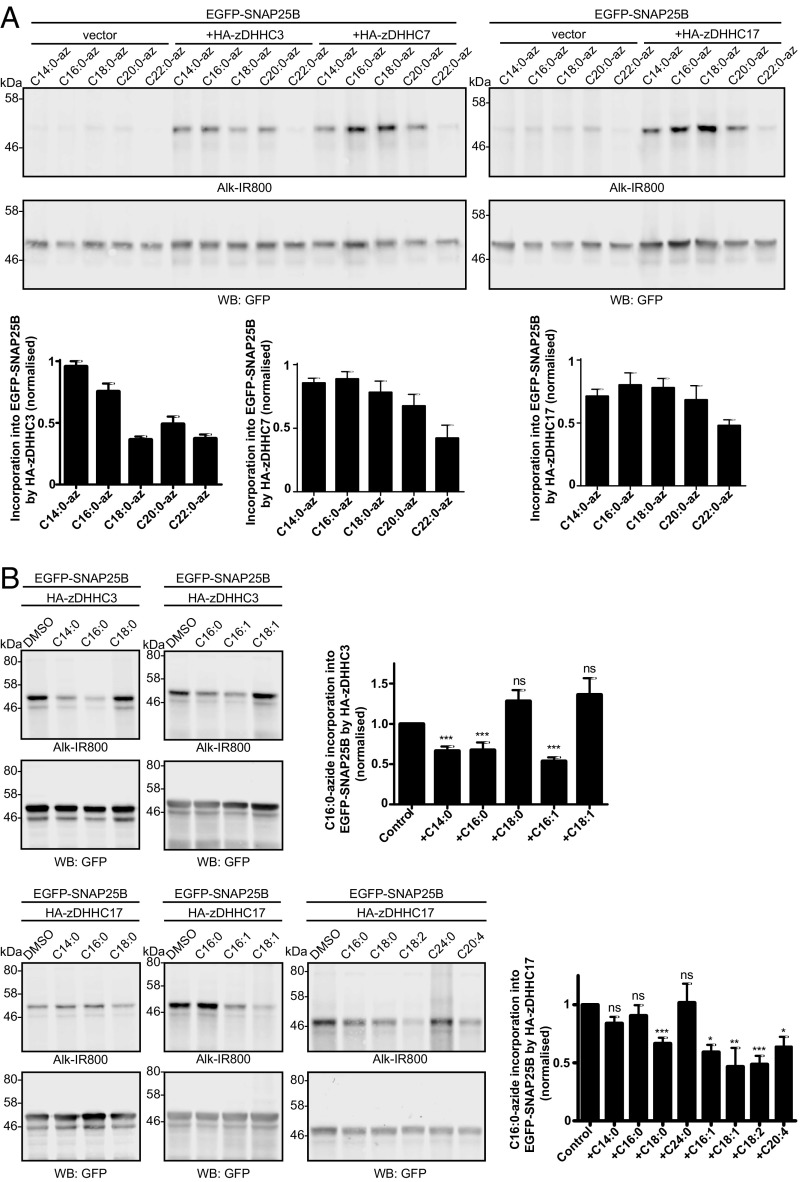
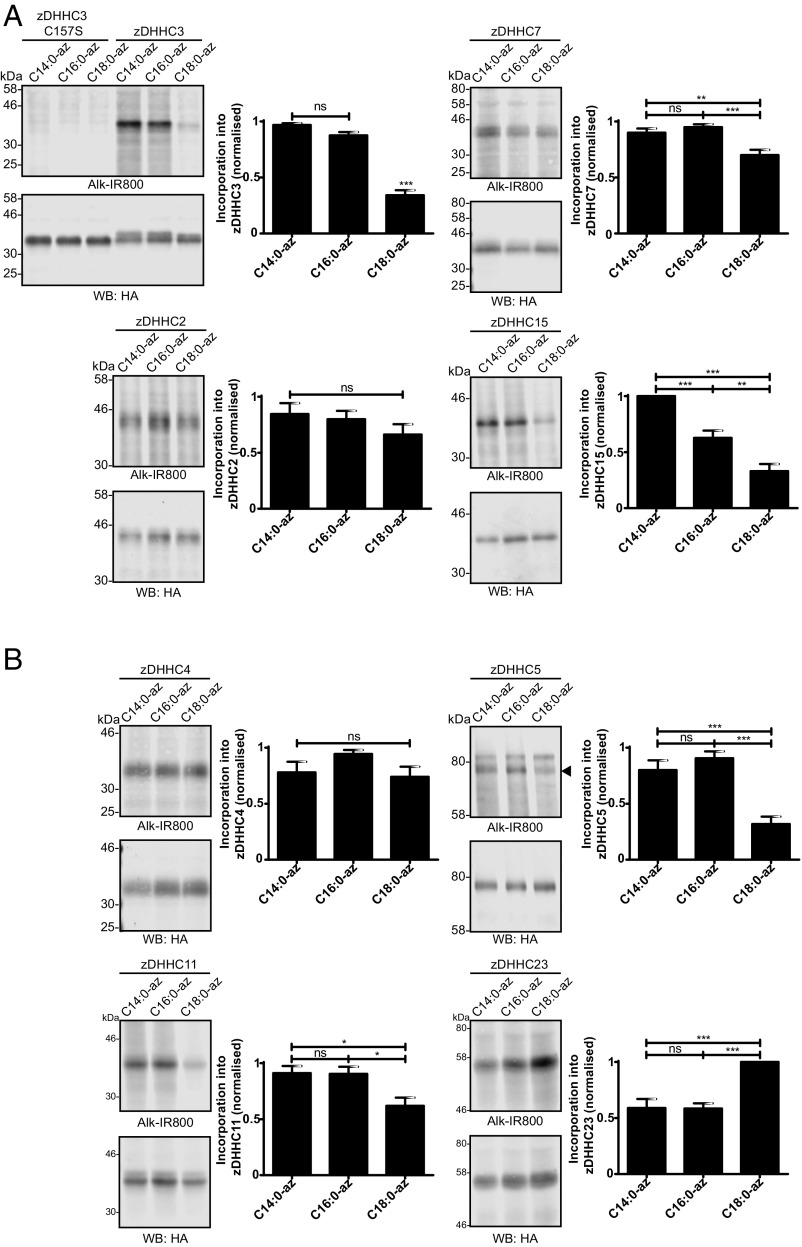
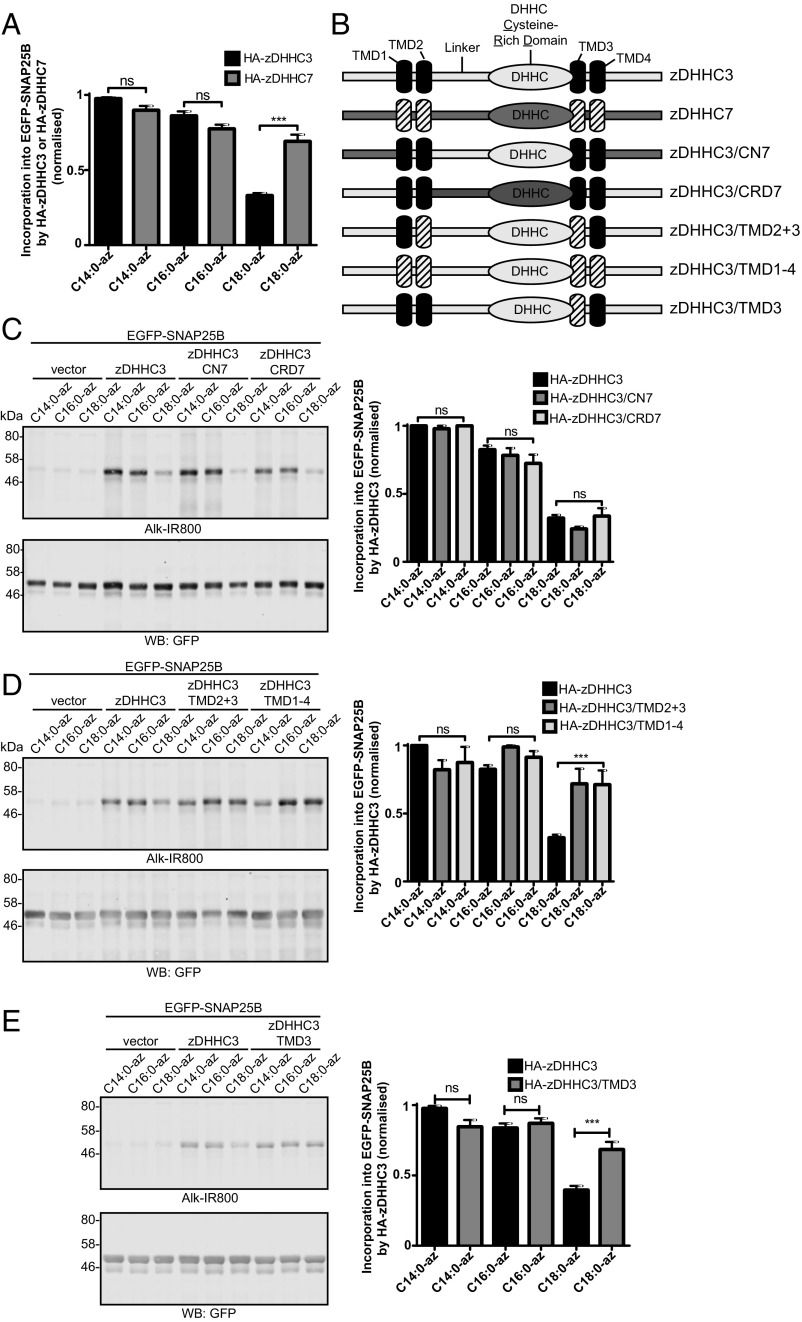
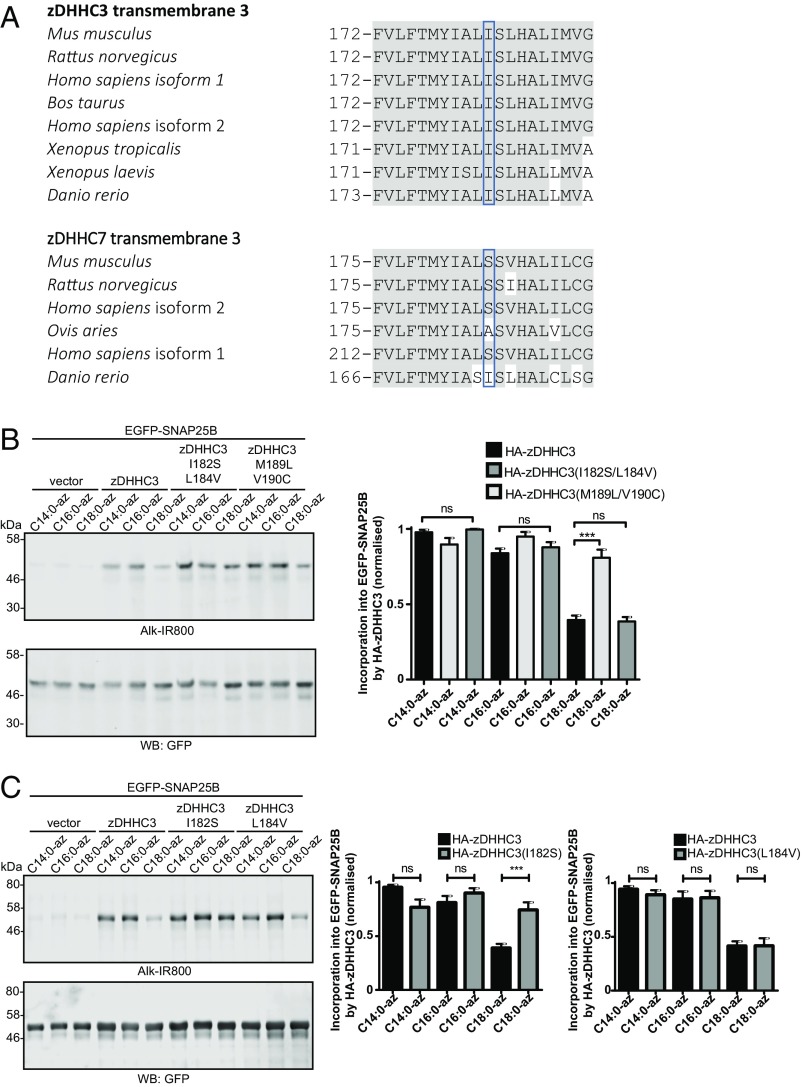
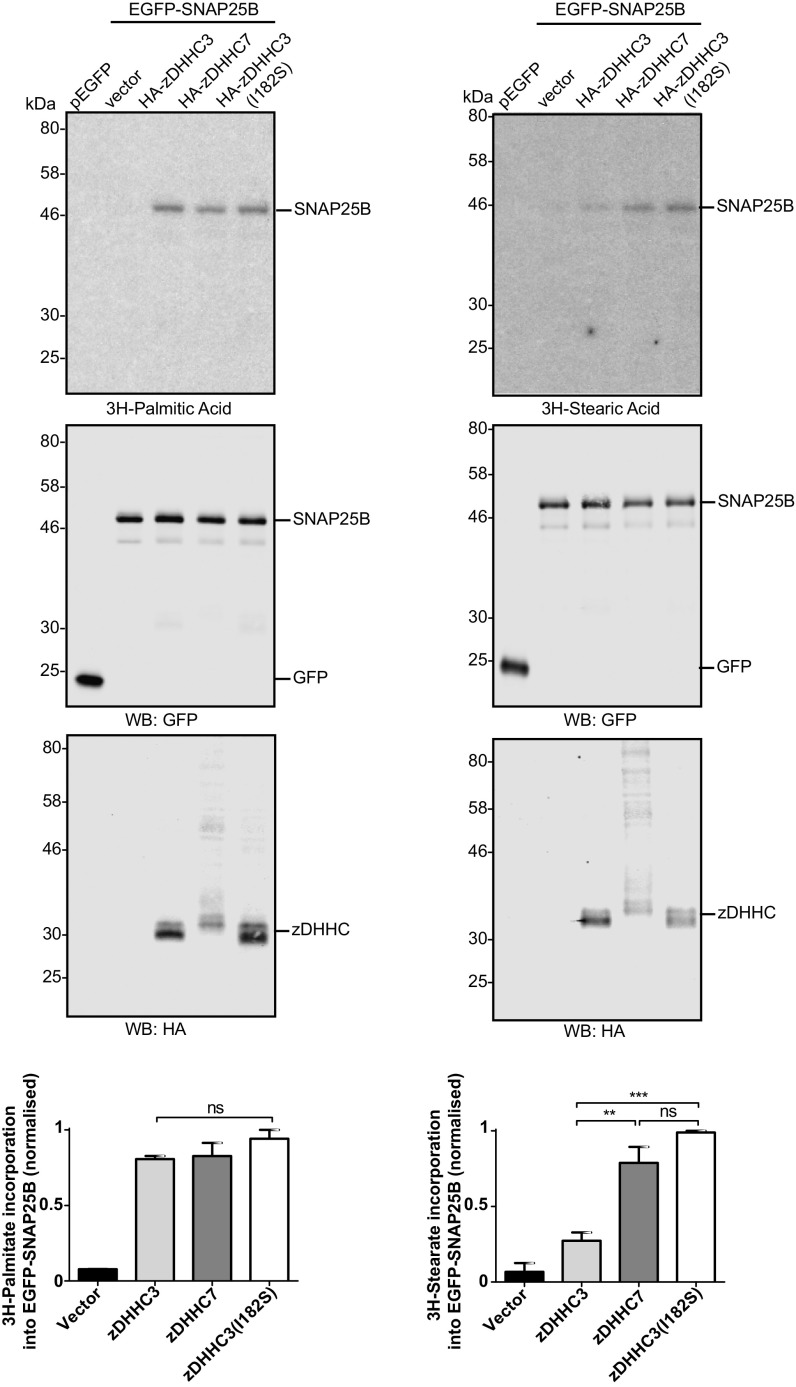
S-acylation is a major posttranslational modification, catalyzed by the zinc finger DHHC domain containing (zDHHC) enzyme family. S-acylated proteins can be modified by different fatty acids; however, very little is known about how zDHHC enzymes contribute to acyl chain heterogeneity. Here, we used fatty acid-azide/alkyne labeling of mammalian cells, showing their transformation into acyl-CoAs and subsequent click chemistry-based detection, to demonstrate that zDHHC enzymes have marked differences in their fatty acid selectivity. This difference in selectivity was apparent even for highly related enzymes, such as zDHHC3 and zDHHC7, which displayed a marked difference in their ability to use C18:0 acyl-CoA as a substrate. Furthermore, we identified isoleucine-182 in transmembrane domain 3 of zDHHC3 as a key determinant in limiting the use of longer chain acyl-CoAs by this enzyme. This study uncovered differences in the fatty acid selectivity profiles of cellular zDHHC enzymes and mapped molecular determinants governing this selectivity.

Keywords: S-acylation; acyl CoA; click chemistry; palmitoylation; zDHHC enzyme.


Conflict of interest statement

The authors declare no conflict of interest.

Figures

Fig. 1.
Fig. 1.
Relative percentage of the total fatty acid content of cells with and without treatments of fatty acid azides. HEK293T cells were incubated with or without fatty acid azides. Fatty acids released from cellular lipids and protein by acid were then converted to methyl esters and analyzed by GC-MS as described in Materials and Methods. Values shown are mean ± SEM (n = 3).
Fig. 2.
Fig. 2.
Quantification of the acyl-CoA content of HEK293T cells with and without treatments of azide fatty acids. HEK293T cells were incubated with or without fatty acid azides, and acyl-CoAs were then quantified as described in Materials and Methods. Values shown are mean ± SEM (n = 3).
Fig. 3.
Fig. 3.
S-acylation of EGFP-SNAP25B by zDHHC3. HEK293T cells were transfected with EGFP-SNAP25B and pEF-BOS-HA (vector), HA-zDHHC3, or HA-zDHHC3(C157S), or were left untransfected. Cells were then incubated with C14:0, C16:0, or C18:0 fatty acid azides for 4 h at 37 °C. Incorporated fatty acid azides were detected by click chemistry using an alkyne-800 infrared dye. Isolated proteins were resolved by SDS/PAGE and transferred to nitrocellulose membranes. Representative images are shown. (A) Click chemistry signal (Top), anti-GFP immunoblot (Middle), and anti-HA immunoblot (Bottom). Arrowheads denote the position of the EGFP-SNAP25 band (Top and Middle) and HA-zDHHC3 band (Bottom). (B) Following click chemistry, samples were incubated in hydroxylamine (+) or Tris (−) at a final concentration of 1 M overnight before SDS/PAGE. (Top) Click chemistry signal. (Bottom) Anti-GFP immunoblot. The positions of molecular weight markers are shown.
Fig. 4.
Fig. 4.
S-acylation of EGFP-SNAP25B by different zDHHC enzymes. HEK293T cells were transfected with EGFP-SNAP25B and pEF-BOS-HA (vector), HA-zDHHC-2, -3, -7, -15, or -17. Cells were then incubated with C14:0, C16:0, or C18:0 fatty acid azides or alkynes as indicated for 4 h at 37 °C. Fatty acid azides/alkynes were labeled by click chemistry using an alkyne- or azide-800 infrared dye. Isolated proteins were then resolved by SDS/PAGE and transferred to nitrocellulose membranes. (A) S-acylation analysis of EGFP-SNAP25B using fatty acid azides. (Top) Representative images with positions of molecular mass standards indicated. (Bottom) Graphs showing mean ± SEM. zDHHC3, n = 46; zDHHC7, n = 26; zDHHC2, n = 10; zDHHC15, n = 9; zDHHC17, n = 22. **P < 0.01; ***P < 0.001. (B) S-acylation analysis of EGFP-SNAP25B in HEK293T cells labeled with fatty acid alkynes. Graphs show mean ± SEM (n = 10). ns, not significant; **P < 0.01; ***P < 0.001.
Fig. 5.
Fig. 5.
S-acylation of EGFP-SNAP25B by longer-chain saturated and unsaturated fatty acids. (A) S-acylation analysis of EGFP-SNAP25B by HA-zDHHC3, HA-zDHHC7, and HA-zDHHC17 in HEK293T cells with C14:0, C16:0, C18:0, C20:0, and C22:0 fatty acid azides. Representative images are shown, and the positions of molecular mass standards are indicated. (Top) Click chemistry signal. (Middle) Anti-GFP immunoblot. (Bottom) Quantified data. n ≥3; mean ± SEM. (B) Competition analysis of EGFP-SNAP25B S-acylation by HA-zDHHC3 (Top) or HA-zDHHC17 (Bottom) in HEK293T cells labeled with C16:0-azide in the presence of threefold excess of the indicated unlabeled fatty acids. Positions of molecular mass standards are shown. Graphs show mean values ± SEM (n ≥ 3). ns, not significant; *P < 0.05; **P < 0.01; ***P < 0.001.
Fig. 6.
Fig. 6.
Autoacylation of zDHHC enzymes by fatty acid azides. HEK293T cells transfected with HA-tagged zDHHC constructs were incubated with C14:0, C16:0, or C18:0 fatty acid azides for 4 h at 37 °C. Fatty acid azides were then labeled by click chemistry using an alkyne-800 infrared dye. Isolated proteins were resolved by SDS/PAGE and transferred to nitrocellulose membranes. Representative click signals and Western blots with positions of molecular mass standards indicated, together with quantified data (mean ± SEM) are shown for each zDHHC enzyme. (A) Autoacylation of zDHHC enzymes active against SNAP25B. zDHHC2, n = 6; zDHHC3, n = 14; zDHHC7, n = 11; zDHHC15, n = 6. (B) Autoacylation of additional zDHHC enzymes. n ≥ 6. ns, not significant; *P < 0.05; **P < 0.01; ***P < 0.001. The arrowhead on the zDHHC5 blot indicates the zDHHC5 band.
Fig. 7.
Fig. 7.
S-acylation of EGFP-SNAP25B by zDHHC3/zDHHC7 chimeras. HEK293T cells were transfected with EGFP-SNAP25B and pEF-BOS-HA (vector) or the indicated WT or mutant zDHHC constructs. Cells were then incubated with C14:0, C16:0, or C18:0 fatty acid azides for 4 h at 37 °C. Fatty acid azides were labeled by click chemistry using an alkyne-800 infrared dye. Isolated proteins were then resolved by SDS/PAGE and transferred to nitrocellulose membranes for analysis. (A) Quantification of the relative levels of C14:0, C16:0, or C18:0 azide incorporation into EGFP-SNAP25B by zDHHC3 or zDHHC7 (mean ± SEM). n ≥ 26. (B) Schematic illustration detailing the zDHHC3/zDHHC7 chimeras that were constructed. (C–E) Analysis of EGFP-SNAP25B S-acylation by zDHHC3 chimeras with fatty acid azides. (Left) Representative images. (Right) Graphs showing mean ± SEM. (C) n ≥ 4. (D) n = 6. (E) n ≥12. ns, not significant; ***P < 0.001.
Fig. 8.
Fig. 8.
S-acylation of EGFP-SNAP25B by zDHHC3 TMD3 mutants. HEK293T cells were transfected with EGFP-SNAP25B and pEF-BOS-HA (vector) or the indicated WT or mutant zDHHC constructs. Cells were then incubated with C14:0, C16:0, or C18:0 fatty acid azides for 4 h at 37 °C. Fatty acid azides were labeled by click chemistry using an alkyne-800 infrared dye. Isolated proteins were resolved by SDS/PAGE and transferred to nitrocellulose membranes. (A) Sequence alignment of amino acids in transmembrane domain 3 of zDHHC3 and zDHHC7. Grey shading highlights amino acids in each zDHHC enzyme that are conserved between all species shown. The blue boxes highlight isoleucine-182 in zDHHC3 and serine-185 in zDHHC7. (B and C) Analysis of EGFP-SNAP25B S-acylation by zDHHC3 TMD3 mutants with fatty acid azides. (Left) Representative images. (Right) Graphs showing mean ± SEM. (B) n ≥ 6. (C) n ≥ 8. ns, not significant, ***P < 0.001.
Fig. 9.
Fig. 9.
Incorporation of [3H]palmitic and [3H]stearic acid into EGFP-SNAP25B by zDHHC3 and zDHHC7. HEK293T cells were transfected with pEGFPC2 or EGFP-SNAP25B together with pEF-BOS-HA (vector), HA-zDHHC3, HA-zDHHC7, or HA-zDHHC3(I182S). Cells were labeled with either [3H]palmitic acid (Left) or [3H]stearic acid (Right), lysed, and resolved by SDS/PAGE. (Top) [3H] fatty acid incorporation. (Top, Middle): expression levels of EGFP-SNAP25B. (Bottom, Middle) zDHHC protein expression. Molecular weight markers are shown on the left. (Bottom) Quantification of [3H] fatty acid incorporation normalized to EGFP-SNAP25B protein levels, expressed as mean ± SEM. n = 3. ns, not significant; **P < 0.01; ***P < 0.001.

References

    1. Smotrys JE, Linder ME. Palmitoylation of intracellular signaling proteins: Regulation and function. Annu Rev Biochem. 2004;73(1):559–587. - PubMed
    1. Chamberlain LH, Shipston MJ. The physiology of protein S-acylation. Physiol Rev. 2015;95(2):341–376. - PMC - PubMed
    1. Salaun C, Greaves J, Chamberlain LH. The intracellular dynamic of protein palmitoylation. J Cell Biol. 2010;191(7):1229–1238. - PMC - PubMed
    1. Linder ME, Deschenes RJ. Palmitoylation: Policing protein stability and traffic. Nat Rev Mol Cell Biol. 2007;8(1):74–84. - PubMed
    1. Greaves J, Chamberlain LH. DHHC palmitoyl transferases: Substrate interactions and (patho)physiology. Trends Biochem Sci. 2011;36(5):245–253. - PubMed

Publication types