. 2017 Feb 28;114(9):2166-2170.
doi: 10.1073/pnas.1616649114. Epub 2017 Feb 6.

Low Hesperian PCO2 constrained from in situ mineralogical analysis at Gale Crater, Mars

Affiliations

Low Hesperian PCO2 constrained from in situ mineralogical analysis at Gale Crater, Mars

Thomas F Bristow et al. Proc Natl Acad Sci U S A. .

Abstract

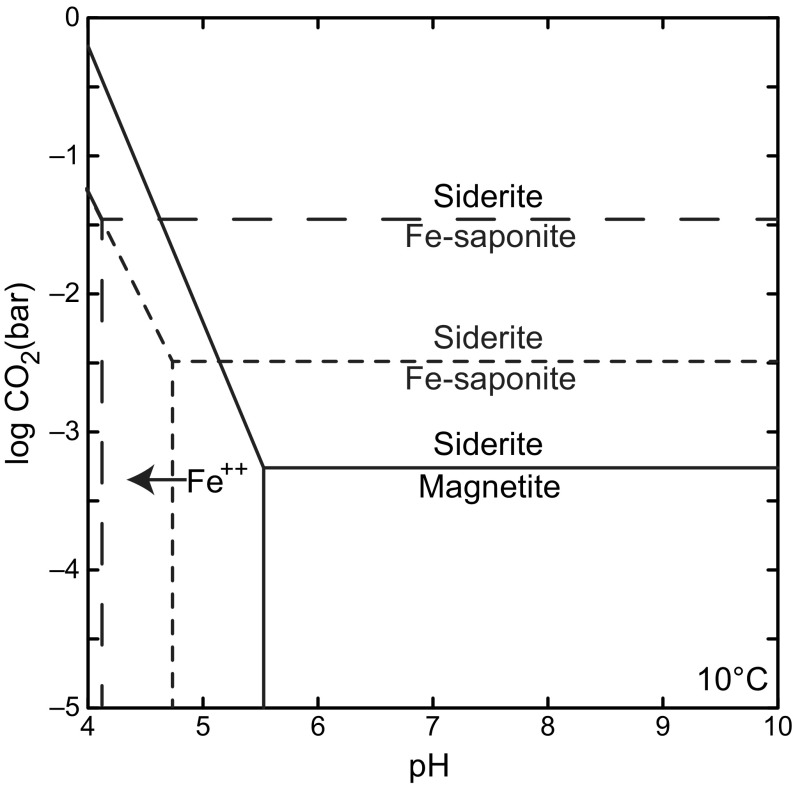
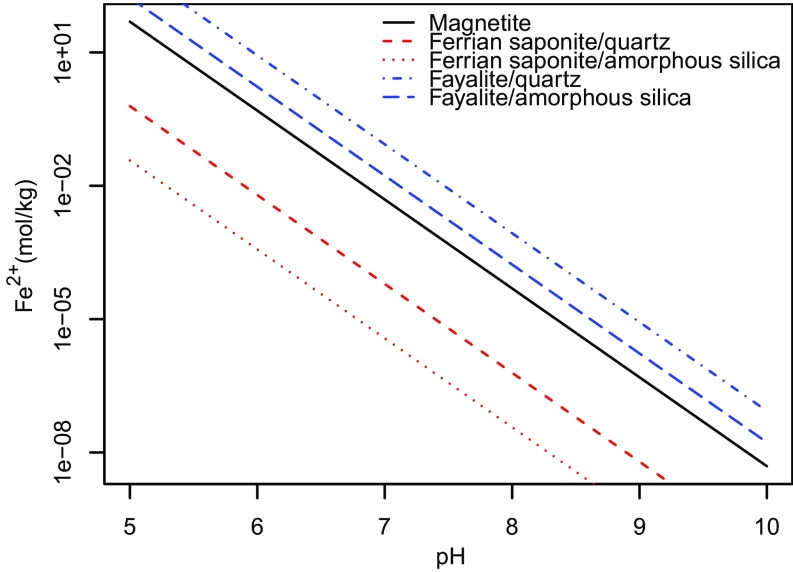
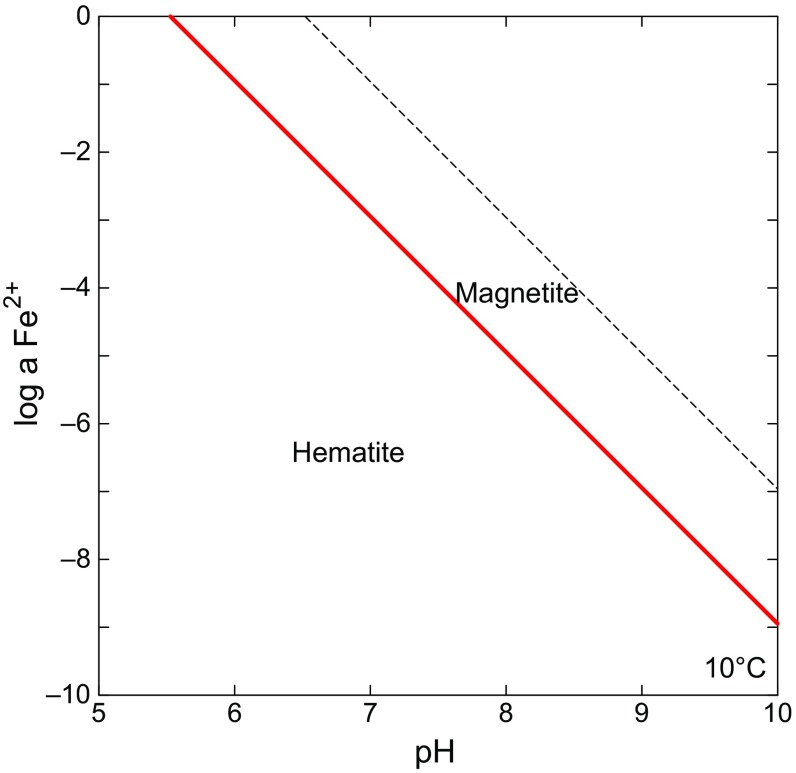
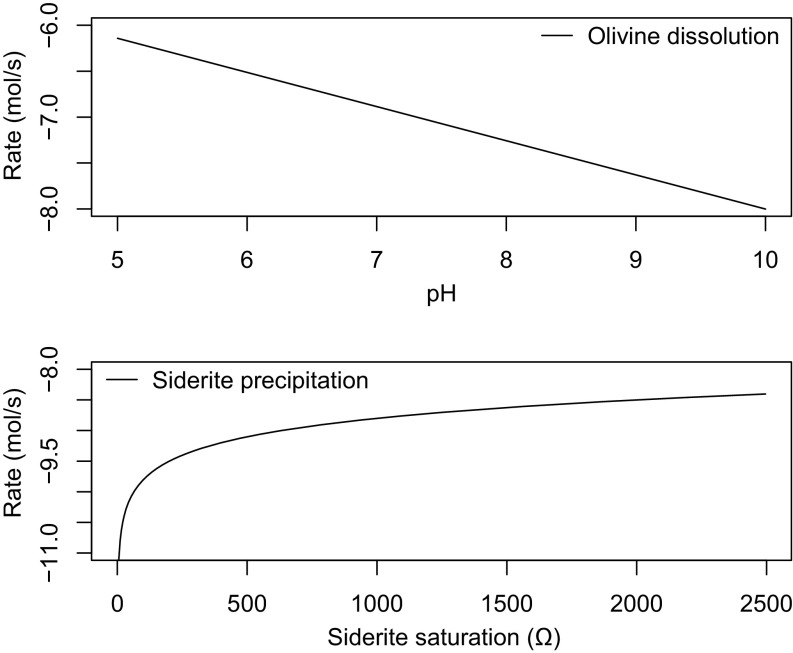
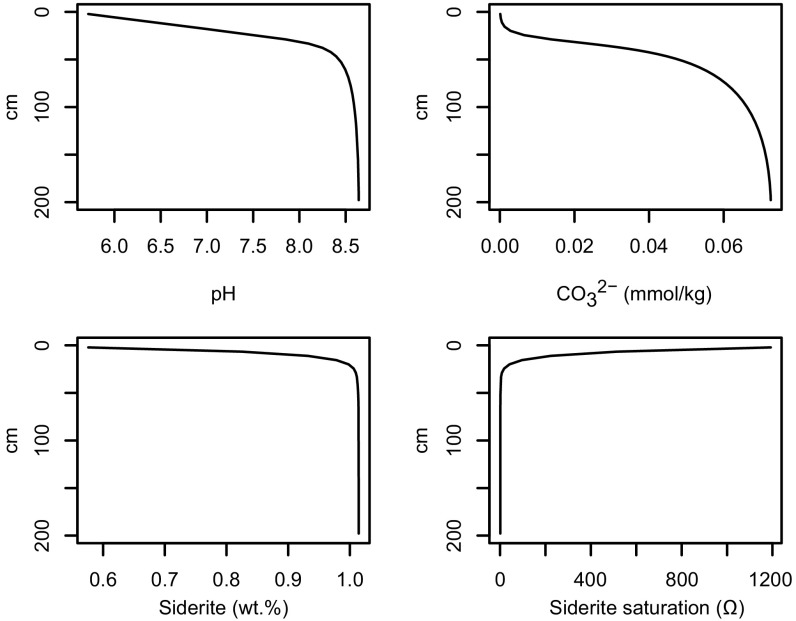
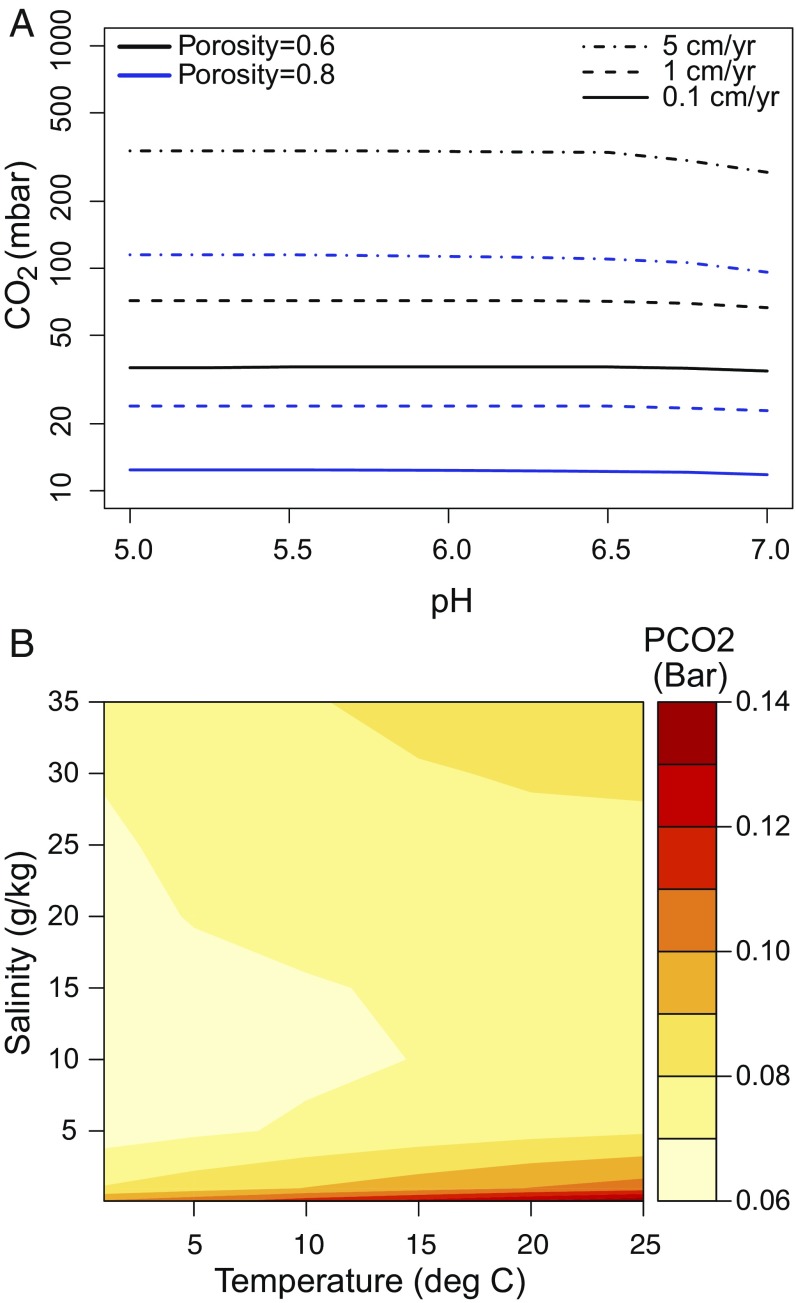
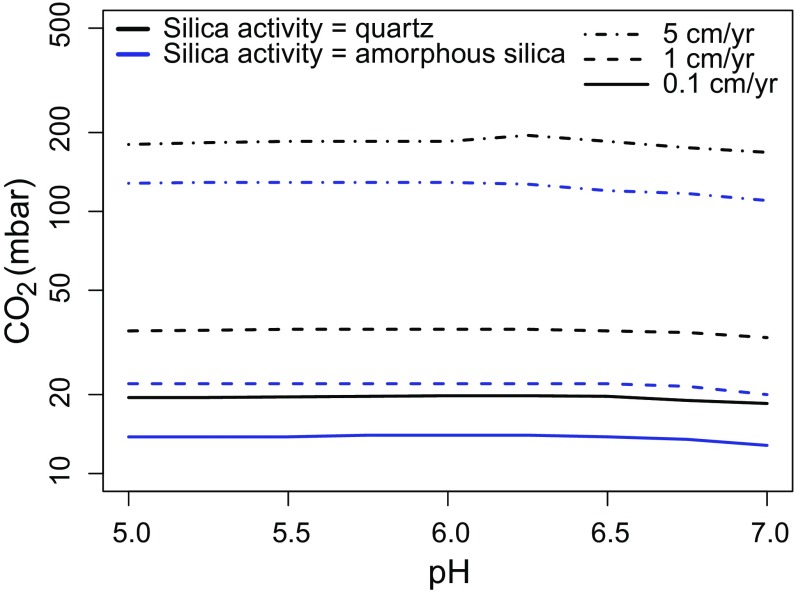
Carbon dioxide is an essential atmospheric component in martian climate models that attempt to reconcile a faint young sun with planetwide evidence of liquid water in the Noachian and Early Hesperian. In this study, we use mineral and contextual sedimentary environmental data measured by the Mars Science Laboratory (MSL) Rover Curiosity to estimate the atmospheric partial pressure of CO2 (PCO2) coinciding with a long-lived lake system in Gale Crater at ∼3.5 Ga. A reaction-transport model that simulates mineralogy observed within the Sheepbed member at Yellowknife Bay (YKB), by coupling mineral equilibria with carbonate precipitation kinetics and rates of sedimentation, indicates atmospheric PCO2 levels in the 10s mbar range. At such low PCO2 levels, existing climate models are unable to warm Hesperian Mars anywhere near the freezing point of water, and other gases are required to raise atmospheric pressure to prevent lake waters from being lost to the atmosphere. Thus, either lacustrine features of Gale formed in a cold environment by a mechanism yet to be determined, or the climate models still lack an essential component that would serve to elevate surface temperatures, at least locally, on Hesperian Mars. Our results also impose restrictions on the potential role of atmospheric CO2 in inferred warmer conditions and valley network formation of the late Noachian.

Keywords: Gale Crater; Hesperian Mars; Mars Science Laboratory; carbon dioxide; martian atmosphere.


Conflict of interest statement

The authors declare no conflict of interest.

Figures

Fig. 1.
Fig. 1.
Thermodynamic stability of secondary minerals (magnetite and Fe saponite) detected in the Sheepbed member, Yellowknife Bay with respect to siderite under varying pH and gaseous CO2 levels. The threshold PCO2 at which siderite is favored over ferrian saponite is dependent on aqueous silica and Al3+ activity. The threshold is higher when SiO2(aq) is saturated with respect to amorphous silica (long dashed line) rather than quartz (short dashed line). In both cases Al3+ is set to saturation with respect to albite—reasonable given that the Sheepbed contains ∼20 wt % plagioclase feldspar (9). In drawing the stability boundaries for magnetite, redox state is set at the magnetite/hematite boundary, as detailed in the main text. All thermodynamic data come from the Lawrence Livermore National Laboratory dataset (15) with the exception of Fe saponite (Na0.35Fe3Al0.35Si3.65O10OH2) determined by Wilson et al. (16). Diagram produced using Geochemist Work Bench 9.
Fig. S1.
Fig. S1.
Thermodynamic stability diagram showing the Fe2+ concentration required to be in equilibrium with various minerals and silica activities ranging from quartz to amorphous silica, as a function of pH. Lines show saturation values at 10 °C and a salinity of 10 g/kg. Minerals are supersaturated above their respective equilibrium lines. All thermodynamic data come from ref. with the exception of Fe saponite (Na0.35Fe3Al0.35Si3.65O10OH2) determined in ref. . In drawing the stability boundaries for magnetite, redox state is set at the magnetite/hematite boundary, as detailed in the main text. In defining equilibrium lines for ferrian saponite, Al3+ is set to saturation with respect to albite, which is reasonable given that the Sheepbed contains ∼20 wt % plagioclase feldspar (9).
Fig. S2.
Fig. S2.
Thermodynamic stability diagram showing the relation between Fe2+ activity (red line) and pH with redox state at the magnetite/hematite boundary. Note that in more oxidizing conditions magnetite is unstable. Under more reducing conditions Fe2+ activity is higher and thus the resulting PCO2 threshold estimated using the reaction–transport model is reduced. The figure was generated using Geochemist’s Workbench for illustrative purposes. In the model [Fe2+] was calculated at a given pH, temperature and salinity using SUPCRT, as described in SI Text, Model Details.
Fig. S3.
Fig. S3.
Comparison of olivine dissolution rates over a range of pH values with siderite precipitation rates at various values of Ω. SI Text, Comparison of Olivine Dissolution and Siderite Precipitation Kinetics describes details of how rates were derived.
Fig. S4.
Fig. S4.
Typical reaction–transport model output. The four panels show calculated changes in pH, DIC, siderite content and saturation with respect to siderite with depth below sediment/water interface. In this simulation, porosity within the model profile is 0.6, sediment accumulation rate is 1 cm/y, temperature is 10 °C and salinity is 10 g/kg. Carbonate speciation and concentrations at the upper model boundary, representing lake waters, are set to be in equilibrium at pH 5.5 with an atmospheric PCO2 of 63 mbars.
Fig. 2.
Fig. 2.
(A) PCO2 required to produce 1 wt % siderite within model sedimentary profiles at various sediment accumulation rates, sediment porosities, and water column pH values. [Fe2+] is set to be saturated with respect to magnetite under redox conditions corresponding to the magnetite/hematite boundary. (B) Sensitivity of PCO2 thresholds to salinity and temperature with a burial rate of 1 cm/y and sedimentary porosity of 0.6.
Fig. 3.
Fig. 3.
PCO2 required to produce 1 wt % siderite within model sedimentary profiles at various sediment accumulation rates, sediment porosities, and water column pH values. [Fe2+] is set at equilibrium with fayalite with silica saturation in equilibrium with quartz (black lines) and amorphous silica (blue lines). Sedimentary porosity is set at 0.6 in all simulations.

References

    1. Carr MF. Water on Mars. Oxford Univ Press; New York: 1996.
    1. Di Achille G, Hynek BM. Ancient ocean on Mars supported by global distribution of deltas and valleys. Nat Geosci. 2010;3:459–463.
    1. Bibring J-P, et al. Global mineralogical and aqueous mars history derived from OMEGA/Mars Express data. Science. 2006;312(5772):400–404. - PubMed
    1. Murchie SL, et al. 2009. A synthesis of Martian aqueous mineralogy after 1 Mars year of observations from the Mars Reconnaissance Orbiter. J Geophys Res 114(E2): 10.1029/2009JE003342.
    1. Niles PB, et al. Geochemistry of carbonates on Mars: Implications for climate history and nature of aqueous environments. Space Sci Rev. 2012;174(1):301–328.

Publication types

LinkOut - more resources