. 2017 Feb 21;114(8):E1432-E1440.
doi: 10.1073/pnas.1700232114. Epub 2017 Feb 6.

Intestinal NCoR1, a regulator of epithelial cell maturation, controls neonatal hyperbilirubinemia

Affiliations

Intestinal NCoR1, a regulator of epithelial cell maturation, controls neonatal hyperbilirubinemia

Shujuan Chen et al. Proc Natl Acad Sci U S A. .

Erratum in

Abstract

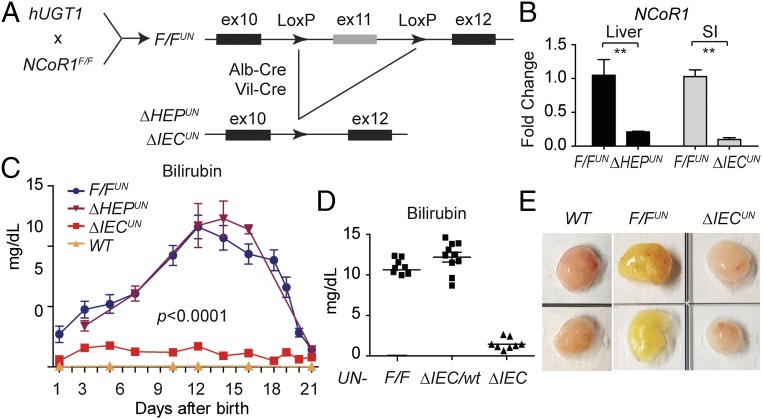
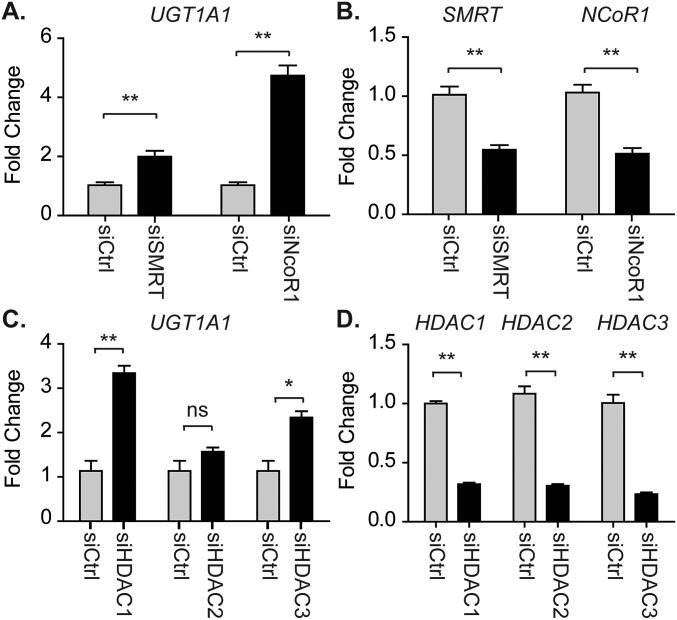
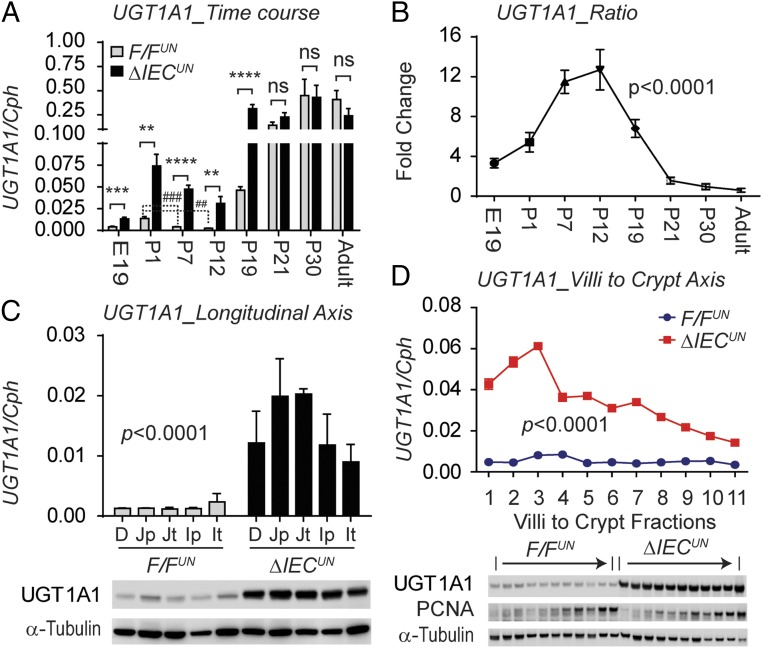
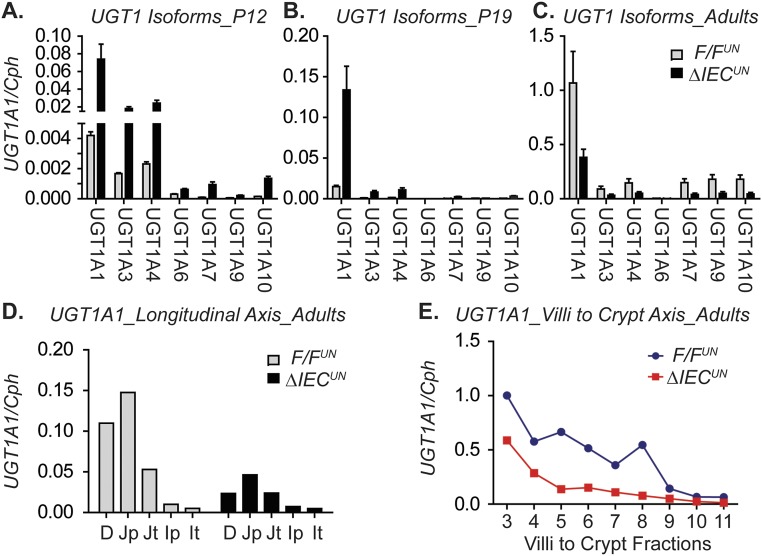
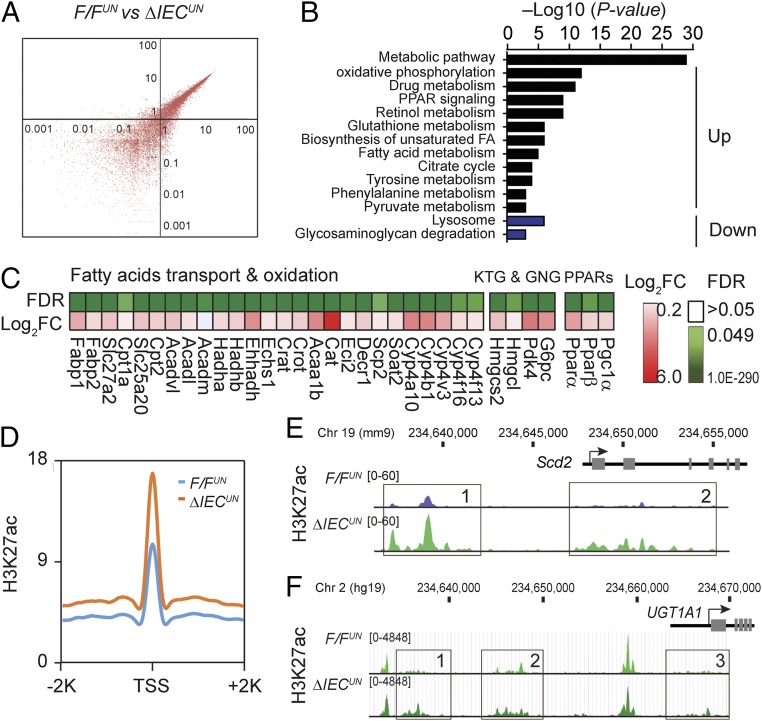
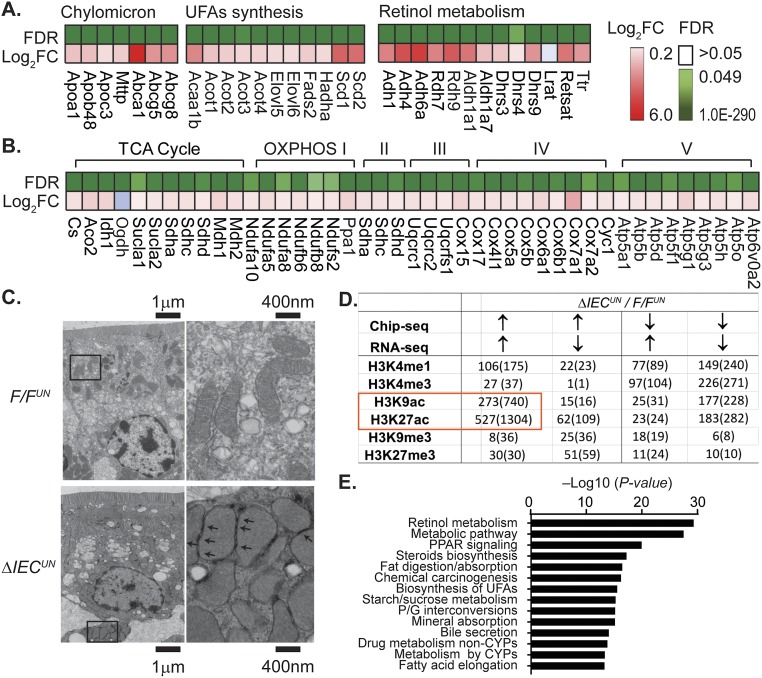
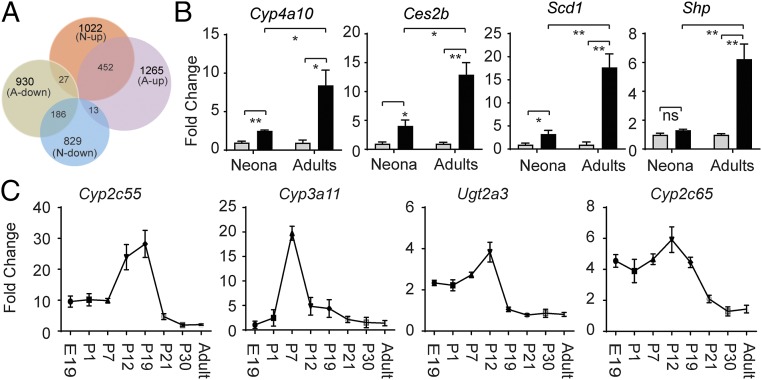
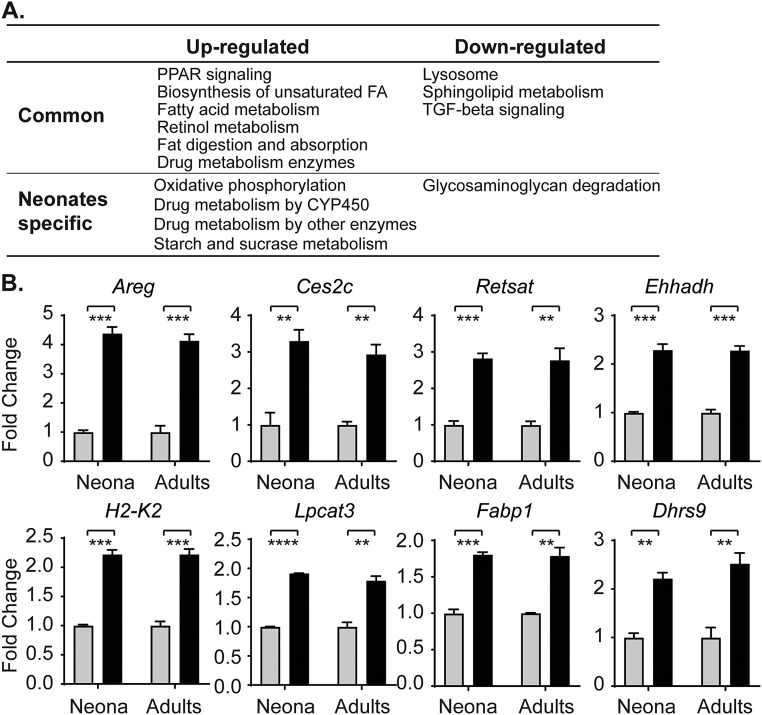
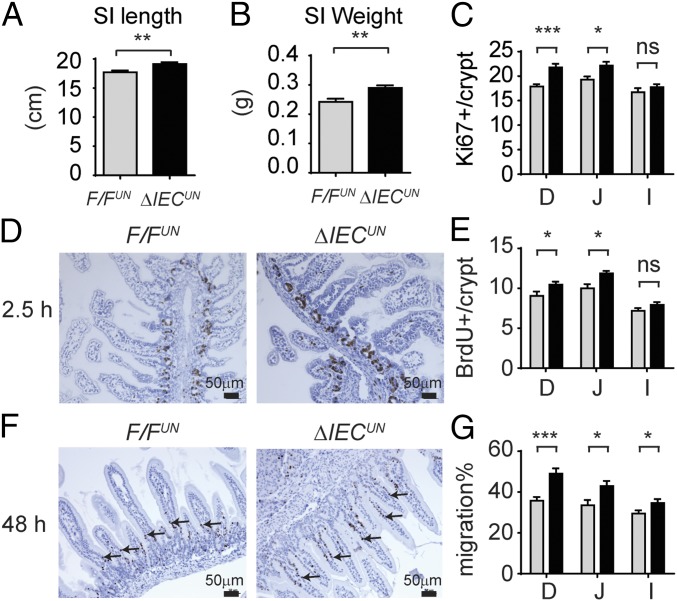
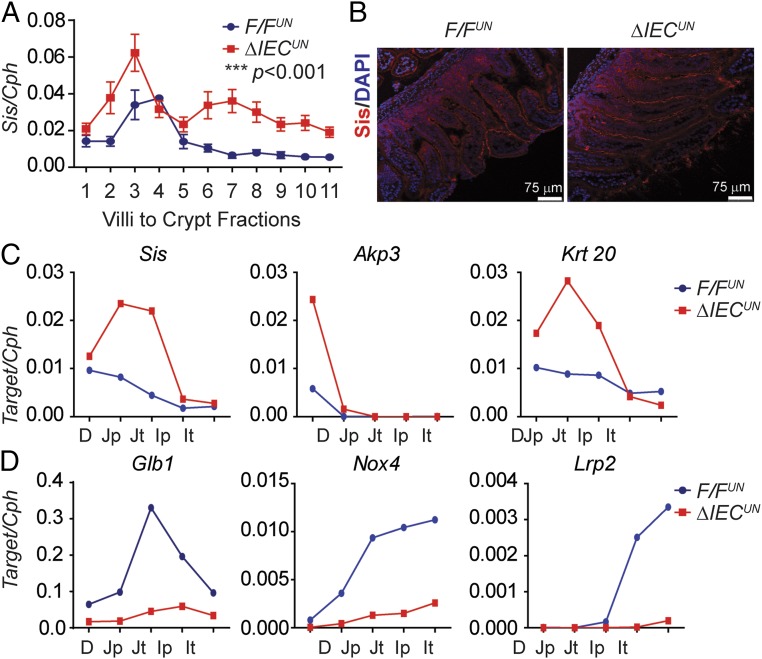
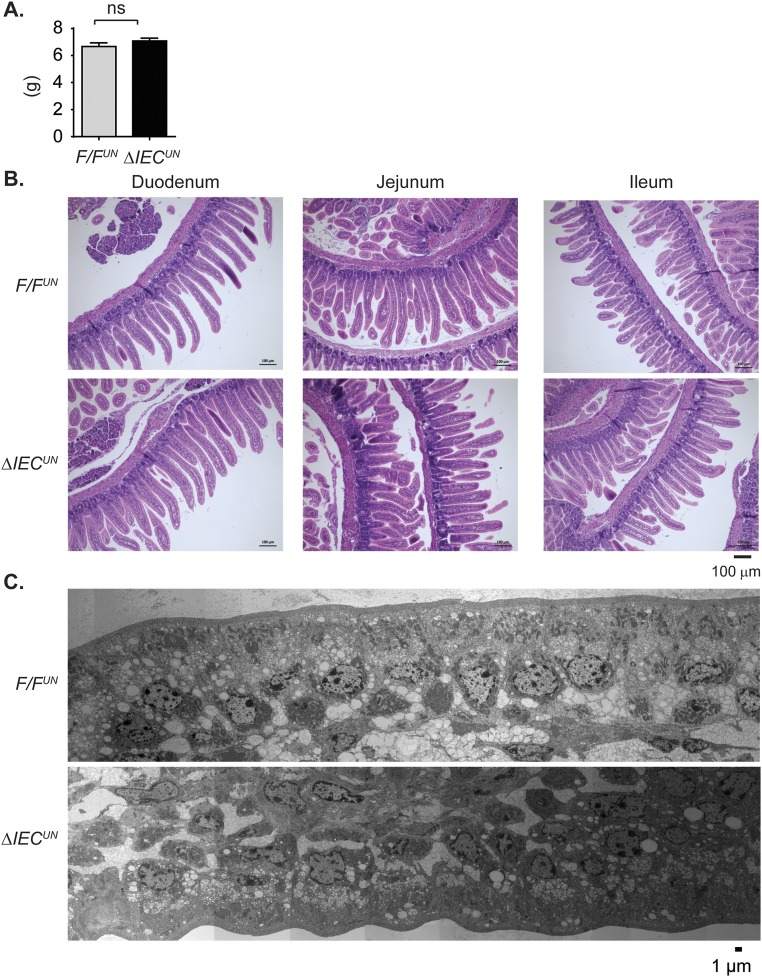
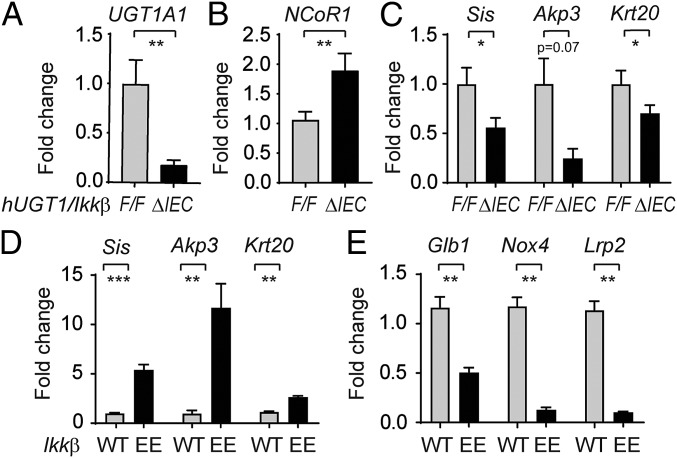
Severe neonatal hyperbilirubinemia (SNH) and the onset of bilirubin encephalopathy and kernicterus result in part from delayed expression of UDP-glucuronosyltransferase 1A1 (UGT1A1) and the inability to metabolize bilirubin. Although there is a good understanding of the early events after birth that lead to the rapid increase in serum bilirubin, the events that control delayed expression of UGT1A1 during development remain a mystery. Humanized UGT1 (hUGT1) mice develop SNH spontaneously, which is linked to repression of both liver and intestinal UGT1A1. In this study, we report that deletion of intestinal nuclear receptor corepressor 1 (NCoR1) completely diminishes hyperbilirubinemia in hUGT1 neonates because of intestinal UGT1A1 gene derepression. Transcriptomic studies and immunohistochemistry analysis demonstrate that NCoR1 plays a major role in repressing developmental maturation of the intestines. Derepression is marked by accelerated metabolic and oxidative phosphorylation, drug metabolism, fatty acid metabolism, and intestinal maturation, events that are controlled predominantly by H3K27 acetylation. The control of NCoR1 function and derepression is linked to IKKβ function, as validated in hUGT1 mice with targeted deletion of intestinal IKKβ. Physiological events during neonatal development that target activation of an IKKβ/NCoR1 loop in intestinal epithelial cells lead to derepression of genes involved in intestinal maturation and bilirubin detoxification. These findings provide a mechanism of NCoR1 in intestinal homeostasis during development and provide a key link to those events that control developmental repression of UGT1A1 and hyperbilirubinemia.

Keywords: IKKβ; UDP-glucuronosyltransferase 1A1; encephalopathy; humanized UGT1 mice; kernicterus.


Conflict of interest statement

The authors declare no conflict of interest.

Figures

Fig. 1.
Fig. 1.
Tissue-specific NCoR1 deletion in hUGT1 mice. (A) Scheme for the generation of tissue-specific NCoR1 deletion in hUGT1 mice (hepatocytes, ΔHEPUN or intestinal epithelial cells, ΔIECUN). (B) RT-QPCR of NCoR1 in livers from F/FUN and ΔHEPUN mice or intestines from F/FUN and ΔIECUN mice (n = 5). **P < 0.01 (Student’s t test). (C) TSB levels during neonatal development. Data are expressed as mean ± SEM (n = 4–10). Two-way ANOVA analysis for ΔIECUN versus F/FUN, P < 0.0001. (D) TSB levels from mice at P12. (E) Fat tissue collected from mice at day 12; yellow staining depicts bilirubin accumulation.
Fig. S1.
Fig. S1.
Gene siRNA knockdown in hepatocytes isolated from hUGT1 neonates at D12. (A–D) Primary hepatocytes were isolated from hUGT1 neonates at D12 and then treated with gene-specific siRNA. Forty-eight hours later, RNA was isolated for RT-QPCR analyses. Data were analyzed using Student’s t test and are expressed as mean ± SEM (n = 3); ns, no significance; *P < 0.05; **P < 0.01.
Fig. 2.
Fig. 2.
Developmental stage-dependent derepression of the UGT1A1 gene resulting from intestinal NCoR1 deletion. (A) RT-QPCR of human UGT1A1 gene expression in SI at E19 and IECs of mice at P1, P7, P12, P19, P21, P30, and week 10 (n = 4–10, Student’s t test). ns, nonsignificant; **P < 0.01; ***P < 0.001; ****P < 0.0001; ##P < 0.01; ###P < 0.001. (B) UGT1A1 fold of change (one-way ANOVA, P < 0.0001). (C) IECs isolated from different SI sections, including duodenum (D), proximal and terminal jejunum (Jp and Jt), and ileum (Ip and It) (n = 3). Shown are RT-QPCR of human UGT1A1 gene (two-way ANOVA analysis, P < 0.0001) and Western blots of UGT1A1 and α-tubulin. (D) IECs were isolated sequentially along the CVA from neonatal mice at P12. Shown are RT-QPCR of human UGT1A1 gene (two-way ANOVA analysis, n = 3) and Western blots.
Fig. S2.
Fig. S2.
Intestinal expression of UGT1A and NCoR1 genes. (A–C) Gene expression of human UGT1 isoforms in SI from F/FUN and ΔIECUN neonates at P12 and P19 and in adult mice. (D and E) Intestinal UGT1A1 gene expression along the longitudinal axis and along the CVA in adult mice (three mice of each strain, pooled).
Fig. 3.
Fig. 3.
Global transcriptomic alterations of ΔIECUN neonates and ChIP-seq analysis. SI were collected from mice at P12 for RNA-seq. (A) Scatter plot analysis. (B) KEGG pathway enrichment analysis; expression heat map of a subset of key genes in the biological processes including (C) fatty acid transport and oxidation, ketogenesis (KTG), and glyconeogenesis (GNG). Pink color represents the Log2 fold of change (Log2FC), and the green color represents the FDR. (D–F) Chip-seq analysis on F/FUN and ΔIECUN neonates at P12. (D) Average profile of H3K27Ac near up-regulated genes. (E and F) Representative distribution of H3K27Ac at selected Scd2 gene against reference genome mm9 and human UGT1A1 gene against reference genome hg19.
Fig. S3.
Fig. S3.
Representative pathways of RNA-seq analysis and the correlation of RNA-seq with ChIP-seq. (A) Expression heat map from RNA-seq analysis, including a subset of key genes in the biological processes such as chylomicron and unsaturated FA (UFA) synthesis and retinol metabolism. (B) Citric acid (TCA) cycle and OXPHOS. (C) Electron microscope images of jejunum (arrows, mitochondria–mitochondria tethering). (D and E) IECs were isolated from the entire SI from F/FUN and ΔIECUN neonates at P12. Chip-seq analysis was carried out by using different histone marks. (D) Correlation analysis between Chip-seq and RNA-seq data of ΔIECUN neonates; data described as number of genes (number of identified peaks). (E) KEGG pathway analysis of the commonly up-regulated genes identified in H3K27ac ChIP-seq.
Fig. 4.
Fig. 4.
Common and differential gene regulation of ΔIECUN mice following development. (A) Venn diagram to compare RNA-seq data from both neonatal mice (N) and adult mice (A). (B) RT-QPCR analysis demonstrated the progressive enhancement of gene regulation in neonatal versus adult mice (gray bar, F/FUN; black bar, ΔIECUN). ns, nonsignificant; *P < 0.05; **P < 0.01 (Student's t test). (C) Small intestines were collected and pulverized for total RNA extraction of mice at different developmental stages, followed by RT and QPCR analysis.
Fig. S4.
Fig. S4.
Neonatal to adult gene expression patterns. (A) KEGG pathway analysis of the commonly regulated genes and genes specifically regulated in neonates. (B) Mice were killed on day 12 (neonates) or week 10 (adults). Small intestines were collected and pulverized for total RNA extraction, followed by RT and QPCR analysis (n = 3). **P < 0.01, ***P < 0.001 (Student’s t test). Gray square, F/FUN; black square, ΔIECUN.
Fig. 5.
Fig. 5.
NCoR1 deletion accelerates migration of IECs. SI length (A) and weight (B) of F/FUN and ΔIECUN mice at P12 (n = 10). (C) Immunofluorescent stainings of Ki67 in frozen sections of duodenum (D), jejunum (J), and Ileum (I), and Ki67-positive cells were counted and described as averages ± SEM (n = 5). (D and E) F/FUN and ΔIECUN at P12 were treated with BrdU through i.p. injection at 0.5 mg/mice. After 2.5 h, sections of SI were prepared for paraffin embedding. Paraffin sections were stained with a BrdU antibody, and BrdU-positive cells were counted (n = 5, Student’s t test). (F and G) Mice at P10 were treated with BrdU. Forty-eight hours later, samples were prepared for BrdU staining. The migration of BrdU-positive cells was measured and described as a percentage of villi length (n = 5, Student’s t test analysis). ns, nonsignificant; *P < 0.05; **P < 0.01; ***P < 0.001.
Fig. 6.
Fig. 6.
NCoR1 deletion accelerates cell maturation of IECs. (A) IECs were isolated sequentially along the CVA in mice at P12, followed by RT-QPCR of Sis gene expression with two-way ANOVA analysis (n = 3). ***P < 0.001. (B) IF staining of Sis (red) in intestine frozen sections, counterstained with DAPI (blue). (C and D) IECs were isolated from different SI sections in mice at P12 (n = 3, samples were pooled). RT-QPCR analysis of Sis, Akp3, Krt20 (J), and Glb1, Nox4, Lrp2 (K) were carried out.
Fig. S5.
Fig. S5.
Impact of NCoR1 on body weight and intestinal tissue of mice at P12. (A) Body weight (n = 10). ns, nonsignificant. (B) H&E staining of the paraffin sections of duodenum, jejunum, and ileum. (C) Electron microscope images of jejunum (images were taken by Serial EM, then constructed and binned).
Fig. 7.
Fig. 7.
Impact of IKKβ on the expressions of NCoR1 and intestinal maturation genes. (A–C) Intestine samples were collected from both 12-d-old control and hUGT1/IkkβΔIEC mice (n = 5). RT-QPCR was carried out to determine gene expression patterns of UGT1A1, NCoR1, and intestinal maturation markers. (D and E) SI were collected from mice carrying the constitutive active IKKβ (n = 6) at 12 d old. RT-QPCR was performed to determine the gene expressions of both up- and down-regulated intestinal maturation markers. *P < 0.05; **P < 0.01; ***P < 0.001 (Student's t test).
Fig. S6.
Fig. S6.
Gene expression in hUGT1/IkkβΔIEC mice. RT-QPCR of intestinal tissues collected from both hUGT1/IkkβF/F and hUGT1/IkkβΔIEC mice at 12 d old (n = 5). *P < 0.05 (Student’s t test).

References

    1. Bosma PJ, et al. Bilirubin UDP-glucuronosyltransferase 1 is the only relevant bilirubin glucuronidating isoform in man. J Biol Chem. 1994;269(27):17960–17964. - PubMed
    1. Burchell B, et al. Development of human liver UDP-glucuronosyltransferases. Dev Pharmacol Ther. 1989;13(2-4):70–77. - PubMed
    1. Watchko JF. Identification of neonates at risk for hazardous hyperbilirubinemia: Emerging clinical insights. Pediatr Clin North Am. 2009;56(3):671–687. - PubMed
    1. Maisels MJ. Managing the jaundiced newborn: A persistent challenge. CMAJ. 2015;187(5):335–343. - PMC - PubMed
    1. Dennery PA, Seidman DS, Stevenson DK. Neonatal hyperbilirubinemia. N Engl J Med. 2001;344(8):581–590. - PubMed

Publication types