. 2017 Feb 21;114(8):E1450-E1459.
doi: 10.1073/pnas.1614787114. Epub 2017 Feb 6.

Selection maintains signaling function of a highly diverged intrinsically disordered region

Affiliations

Selection maintains signaling function of a highly diverged intrinsically disordered region

Taraneh Zarin et al. Proc Natl Acad Sci U S A. .

Abstract

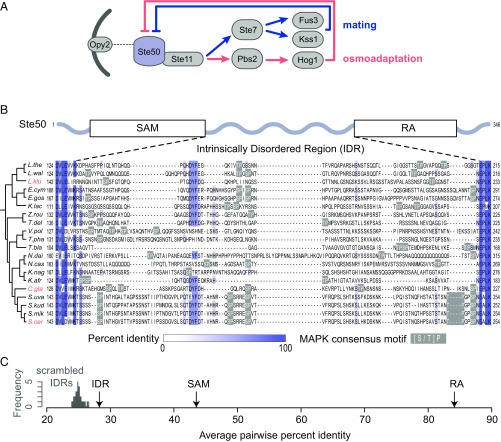
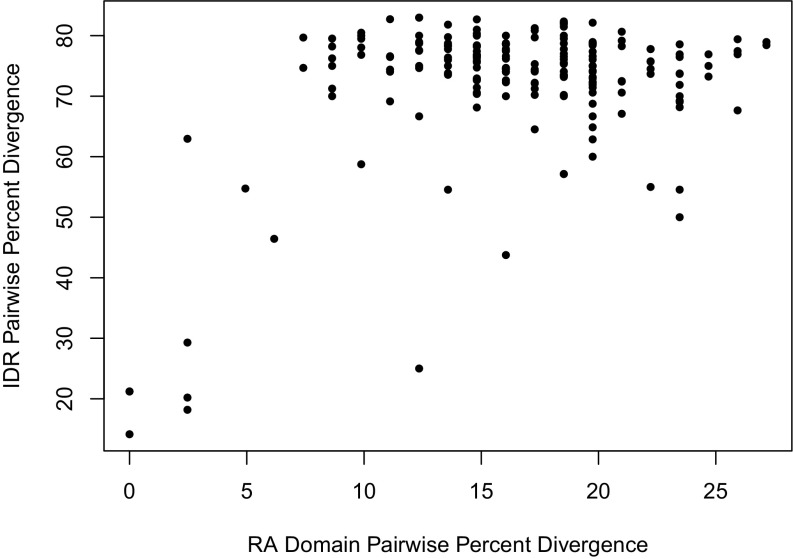
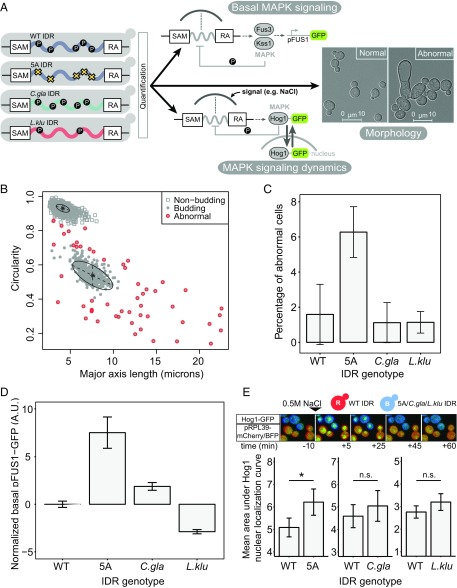
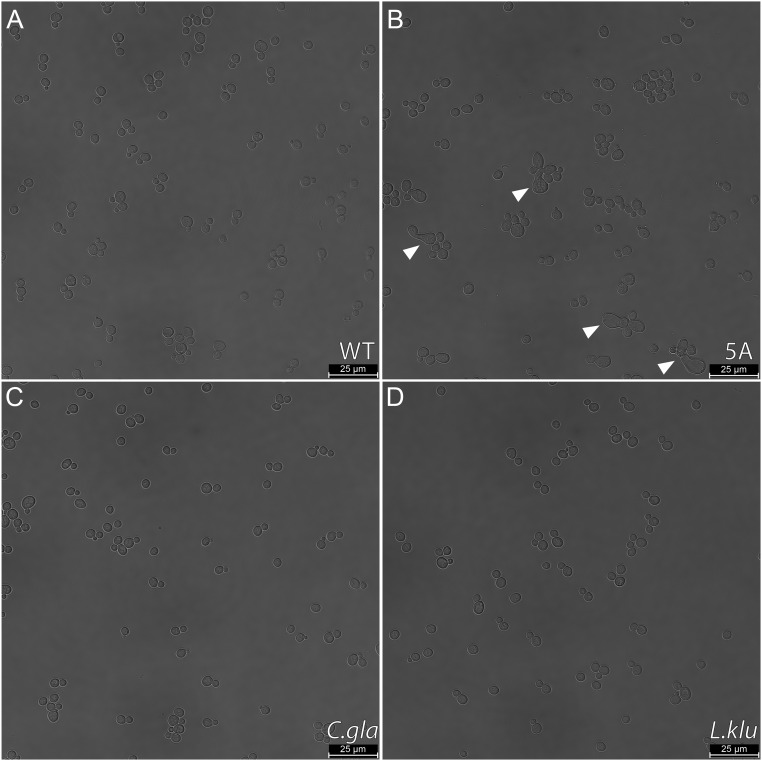
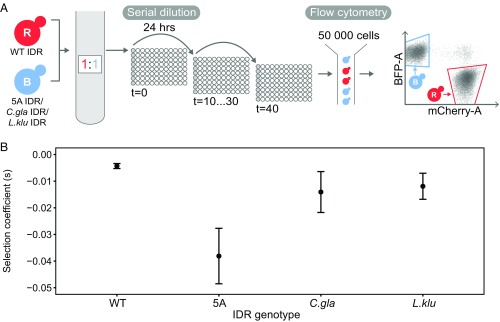
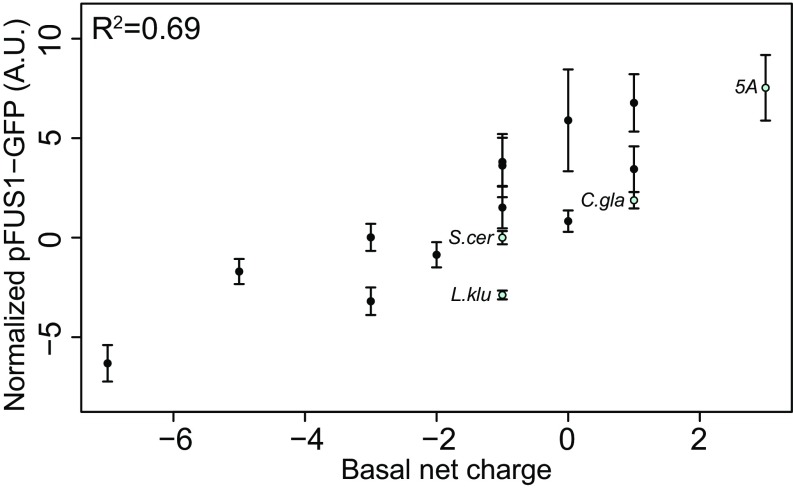
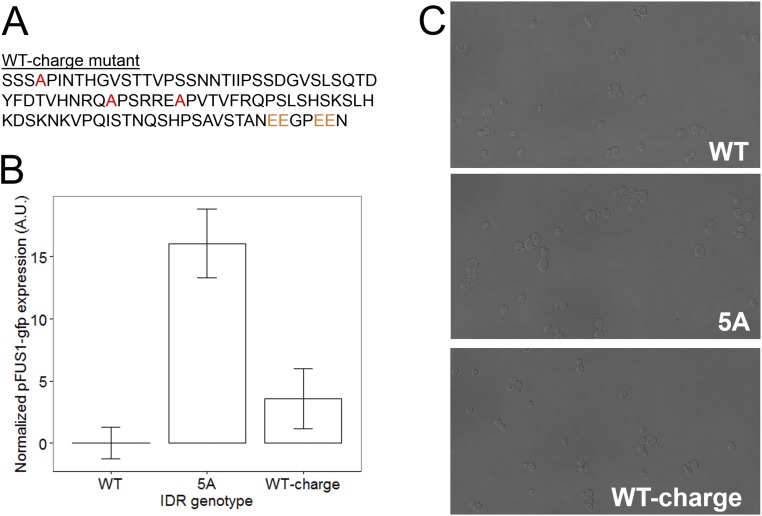
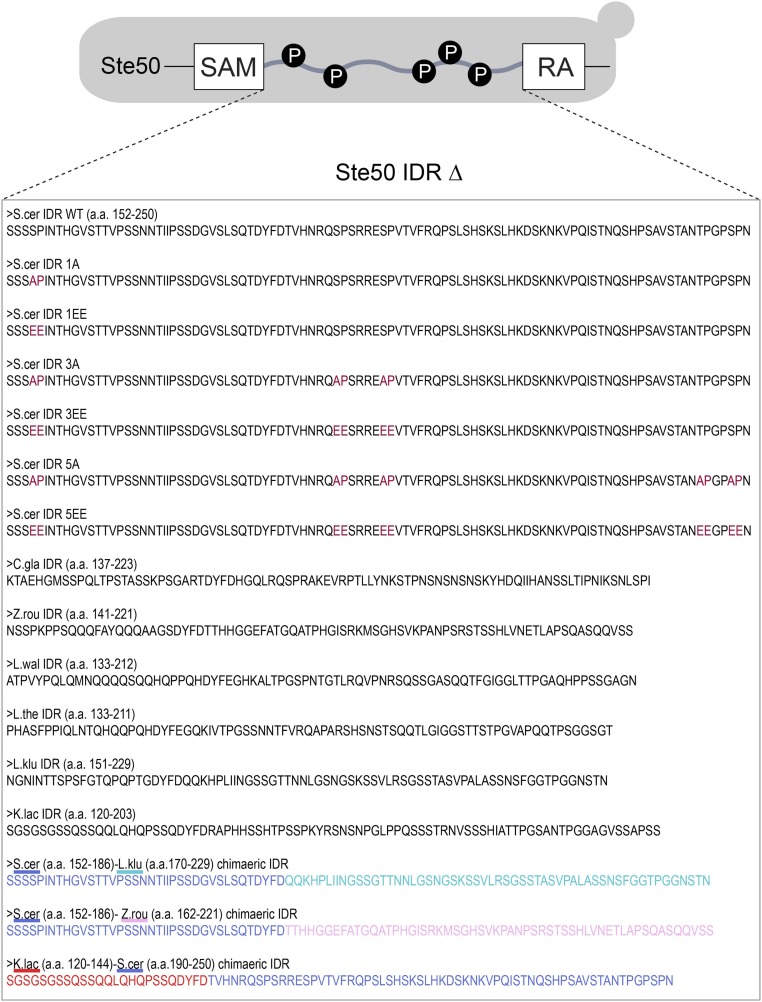
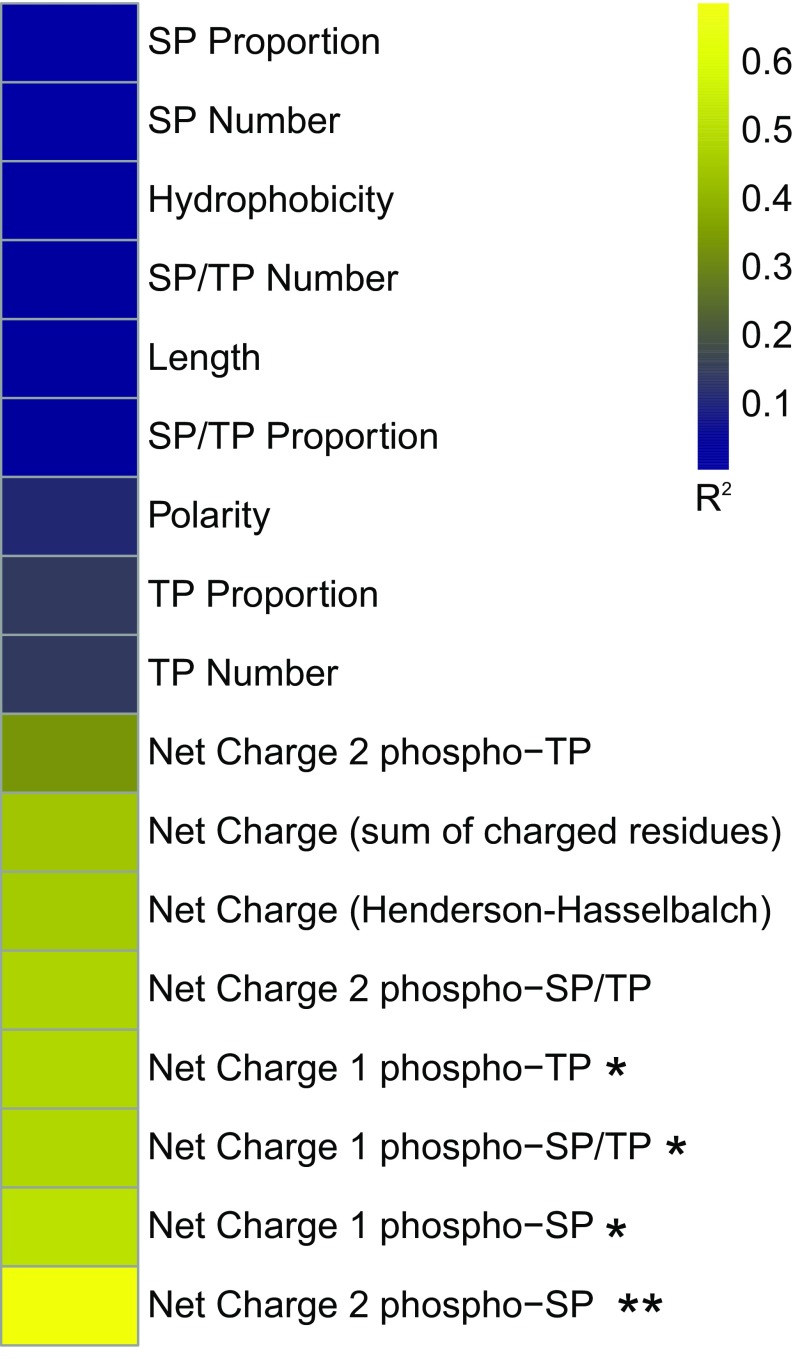
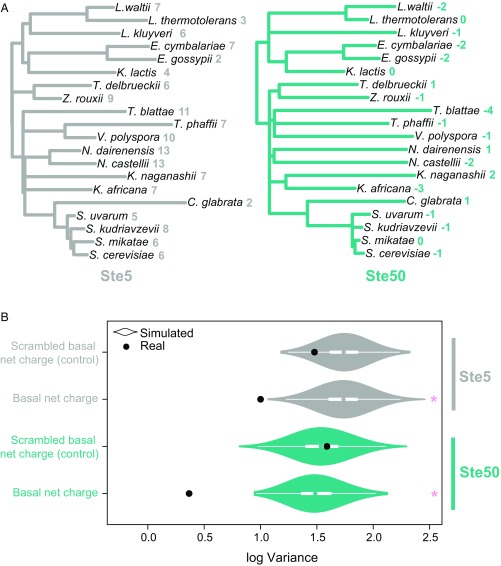
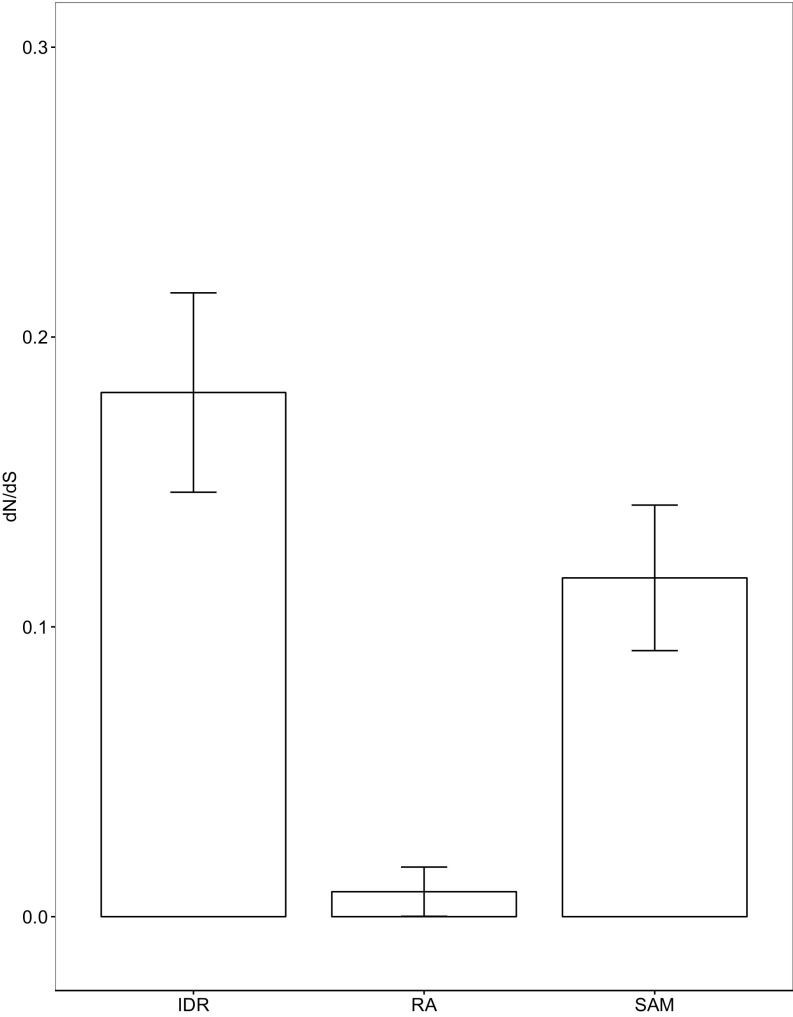
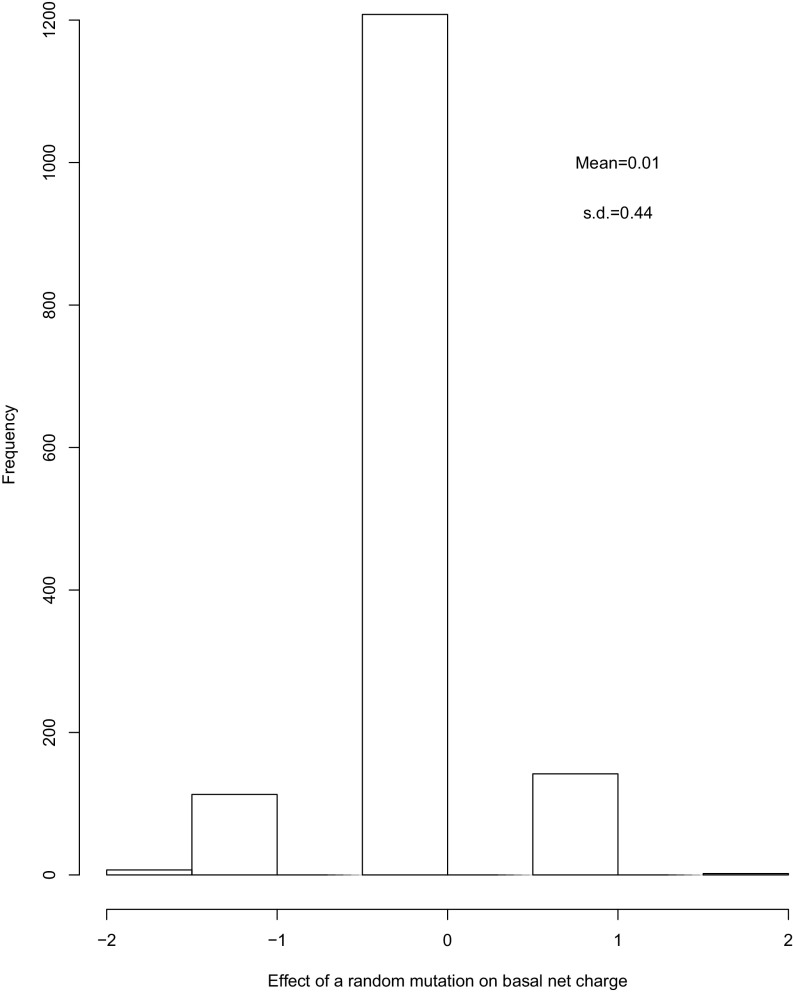
Intrinsically disordered regions (IDRs) are characterized by their lack of stable secondary or tertiary structure and comprise a large part of the eukaryotic proteome. Although these regions play a variety of signaling and regulatory roles, they appear to be rapidly evolving at the primary sequence level. To understand the functional implications of this rapid evolution, we focused on a highly diverged IDR in Saccharomyces cerevisiae that is involved in regulating multiple conserved MAPK pathways. We hypothesized that under stabilizing selection, the functional output of orthologous IDRs could be maintained, such that diverse genotypes could lead to similar function and fitness. Consistent with the stabilizing selection hypothesis, we find that diverged, orthologous IDRs can mostly recapitulate wild-type function and fitness in S. cerevisiae We also find that the electrostatic charge of the IDR is correlated with signaling output and, using phylogenetic comparative methods, find evidence for selection maintaining this quantitative molecular trait despite underlying genotypic divergence.

Keywords: evolution; intrinsically disordered; phylogenetic comparative method; quantitative trait; stabilizing selection.


Conflict of interest statement

The authors declare no conflict of interest.

Figures

Fig. 1.
Fig. 1.
(A) The adaptor protein Ste50 is phosphorylated by multiple MAPKs, which results in dissociation of the adaptor and associated proteins from membrane-bound Opy2 and subsequent negative regulation of downstream MAPKs. Not all pathway components are shown in the schematic. (B) Alignment of the Ste50 IDR for hemiascomycetes (displayed using Jalview) (67). Percentage identity is shown in blue; MAPK phosphorylation consensus motifs ([S/T]P) are boxed in gray. Species names of IDRs that were used for downstream functional and fitness experiments are highlighted in red. (C) Average pairwise percent identity of the real Ste50 IDR alignment (IDR), compared with a distribution of IDRs with randomly scrambled residues (scrambled IDRs), the Ste50 SAM, and the Ste50 RA domain. The y axis shows the frequency of scrambled IDRs.
Fig. S1.
Fig. S1.
The pairwise percent divergence of the Ste50 IDR saturates with divergence time (as measured by RA domain divergence). Each point represents a species pair, where the pairwise percent divergence (i.e., 100 – pairwise percent identity) is plotted for the Ste50 RA domain versus the IDR.
Fig. 2.
Fig. 2.
Diverged orthologous IDRs recapitulate S. cerevisiae IDR functions compared with the 5A mutant. (A) Diverged IDRs were swapped with the S. cerevisiae IDR, and three different functional outputs were quantified: morphology, basal MAPK (Fus3) signaling, and MAPK (Hog1) signaling dynamics. (B) Cell morphology clusters along two dimensions. Each point represents one cell for which major axis length and circularity features were extracted. Figure shows example plot from one biological replicate, where cells have been classified as nonbudding, budding, and abnormal (Materials and Methods for details). (C) Average percentage of cells with abnormal morphology for each IDR genotype. Error bars represent 1.96 SE between three biological replicates (average of ∼400 cells per replicate). (D) Diverged IDRs mostly recapitulate wild-type basal pFUS1-GFP levels. Error bars represent 1.96 SE between 6 to 12 biological replicates (50,000 cells per replicate) for each strain. (E, Top) Representative images of time-lapse movies capturing Hog1-GFP localization in cocultured wild-type and experimental strains (constitutively expressing mCherry and mTagBFP2, respectively). (Bottom) Diverged IDRs recapitulate wild-type Hog1 signaling dynamics. Error bars represent 1.96 SE. Asterisk represents statistical significance (P < 0.01, Student’s t test, n = 15–35 cells) while n.s. indicates no statistical significance (P > 0.05, Student's t test, n = 15–35 cells).
Fig. S2.
Fig. S2.
(AD) Example brightfield (BF) micrographs from each assayed strain (indicated in bottom right corner of panels). Arrows indicate example cells with abnormal morphology.
Fig. 3.
Fig. 3.
Diverged orthologous IDRs rescue fitness of wild-type S. cerevisiae IDR compared with 5A mutant. (A) High-throughput quantitative competition assay captures growth rate of cocultured cells over time. (B) Relative selection coefficients of 5A mutant and orthologous IDRs versus wild type. Error bars represent 1.96 SE; n = 2 for wild type, n = 4 for 5A, C. glabrata, and L. kluyveri IDRs.
Fig. 4.
Fig. 4.
Basal net charge and MAPK reporter pFUS1-GFP expression are positively correlated. Each point represents a different IDR genotype (with blue corresponding to previously shown orthologous IDRs, the wild-type S. cerevisiae IDR, and the 5A IDR mutant, and black corresponding to engineered IDRs with varying phosphorylatable residues, charge, and length). Error bars represent 1.96 SE.
Fig. S3.
Fig. S3.
An unphosphorylatable mutant S. cerevisiae IDR with identical basal net charge to the wild type (“WT-charge” mutant) recapitulates wild-type morphology and pFUS1 expression. (A) Amino acid sequence of the WT-charge mutant IDR, with mutated phosphorylation sites highlighted in red when mutated to alanine and orange when mutated to glutamic acid. (B) Mean pFUS1-gfp expression for wild-type (WT), 5A mutant (5A), and WT-charge mutant IDRs. Error bars represent 1.96 SE of three biological replicates. (C) Example brightfield (BF) micrographs from WT, 5A, and WT-charge mutant IDR strains.
Fig. S4.
Fig. S4.
List of engineered Ste50 IDRs used in correlation study (Fig. 4).
Fig. S5.
Fig. S5.
Heat map of sequence features correlated with functional output (pFUS1-GFP expression) of the Ste50 IDRs tested. *P < 0.05 Bonferroni-corrected, **P < 0.01 Bonferroni-corrected. In order of appearance in the figure: SP proportion refers to the number of SP phosphorylation consensus motifs divided by the total number of amino acids in the IDR; SP number refers to number of SP phosphorylation sites regardless of IDR length; hydrophobicity refers to the GRAVY (grand average of hydropathy) index score of each IDR; SP/TP number is the number of SP or TP phosphorylation consensus motifs in the IDR; length is the total number of amino acid residues in the IDR; SP/TP proportion is the number of SP or TP phosphorylation consensus motifs divided by the total number of amino acids in the IDR; polarity is the average polarity score of the IDR; TP proportion is the number of TP consensus phosphorylation sites divided by the total number of amino acids in the IDR; TP number is the total number of TP consensus phosphorylation sites in the IDR; net charge (sum of charged residues) is the number of positively charged residues in the IDR minus the number of negatively charged residues in the IDR; net charge (Henderson–Hasselbach) is the net charge of the IDR as calculated by the Henderson–Hasselbalch equation at pH 7 and pKa determined by the Lehninger scale; net charge 1 or 2 phospho-SP or TP or SP/TP refers to the net charge (sum of charged residues) in the IDR with the potential for basal phosphorylation of one or two SP, TP, or SP/TP phosphorylation consensus motifs (see Materials and Methods for more details on calculations).
Fig. 5.
Fig. 5.
Stabilizing selection constrains the evolution of basal net charge in Ste50. (A) Phylogenetic trees inferred from Ste5 (Left) and Ste50 (Right) IDRs with constrained resolved species topology. Quantitative trait value (basal net charge) for each species is indicated on tree tips. (B) Log evolutionary variance compared between real proteins (black dots) and 1,000 simulated proteins (violin plots) for Ste5 (top) and Ste50. White boxes show interquartile range and median. Basal net charge was calculated as the sum of positively and negatively charged residues accounting for basal phosphorylation of two SP motifs and with basal phosphorylation of two scrambled PSX motifs [“Scrambled basal net charge (control)”]. Asterisks indicate statistical significance between log variance in real sequences versus empirical distribution of 1,000 simulated sequences (P < 0.001).
Fig. S6.
Fig. S6.
dN/dS values compared between the Ste50 IDR, the RA domain, and the SAM domain. The dN/dS value for the IDR is higher (0.18) compared with the SAM (0.12) and RA (0.01) domains. However, much of the sequence variation in IDRs comes from the high rates of non–frame-shifting insertions and deletions that we find in these regions (–13), which would not be captured in the dN/dS analysis. Therefore, dN/dS is likely to overestimate the constraint in disordered regions. Error bars represent 1.96 SE.
Fig. S7.
Fig. S7.
Distribution of effects of a random nucleotide mutation on basal net charge. n = 1,472.

References

    1. Ward JJ, Sodhi JS, McGuffin LJ, Buxton BF, Jones DT. Prediction and functional analysis of native disorder in proteins from the three kingdoms of life. J Mol Biol. 2004;337(3):635–645. - PubMed
    1. Peng Z, Mizianty MJ, Kurgan L. Genome-scale prediction of proteins with long intrinsically disordered regions. Proteins. 2014;82(1):145–158. - PubMed
    1. Liu J, Faeder JR, Camacho CJ. Toward a quantitative theory of intrinsically disordered proteins and their function. Proc Natl Acad Sci USA. 2009;106(47):19819–19823. - PMC - PubMed
    1. Vavouri T, Semple JI, Garcia-Verdugo R, Lehner B. Intrinsic protein disorder and interaction promiscuity are widely associated with dosage sensitivity. Cell. 2009;138(1):198–208. - PubMed
    1. Forman-Kay JD, Mittag T. From sequence and forces to structure, function, and evolution of intrinsically disordered proteins. Structure. 2013;21(9):1492–1499. - PMC - PubMed

Publication types

MeSH terms

Grants and funding

LinkOut - more resources