. 2017 Feb 21;114(8):E1490-E1499.
doi: 10.1073/pnas.1616420114. Epub 2017 Feb 6.

Dnmt3a restrains mast cell inflammatory responses

Affiliations

Dnmt3a restrains mast cell inflammatory responses

Cristina Leoni et al. Proc Natl Acad Sci U S A. .

Abstract

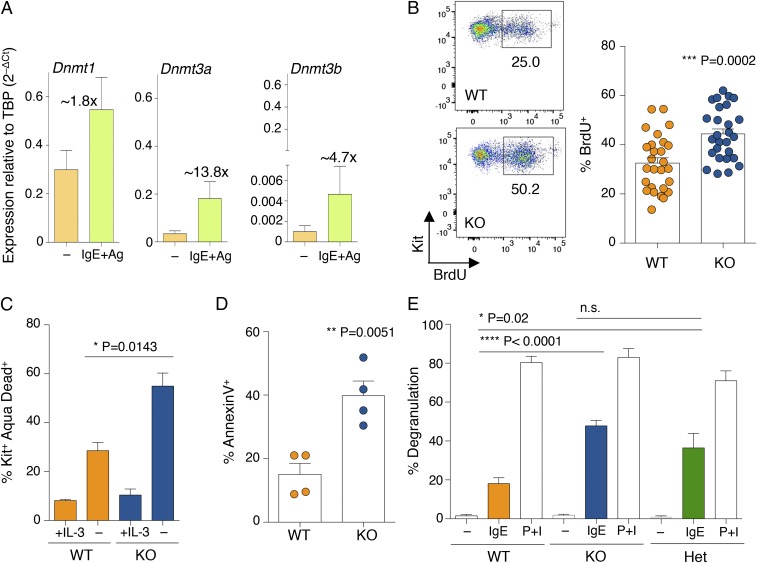
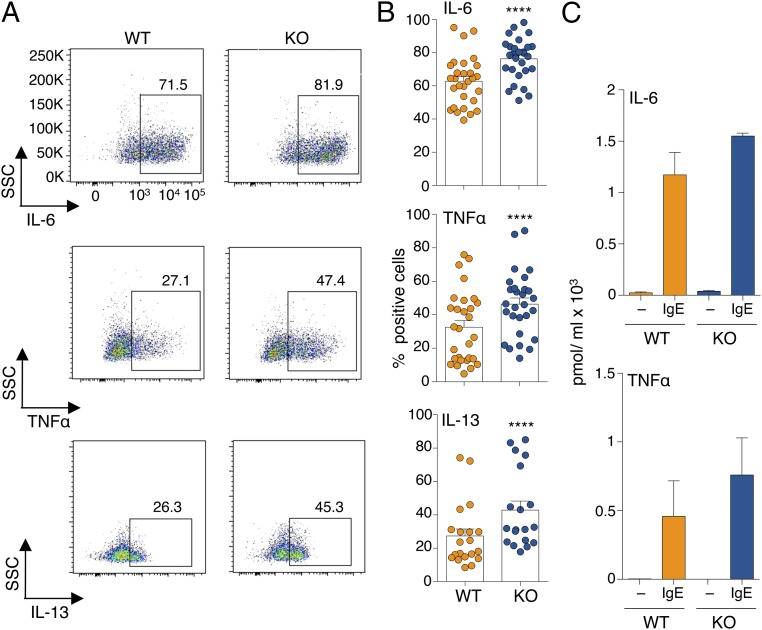
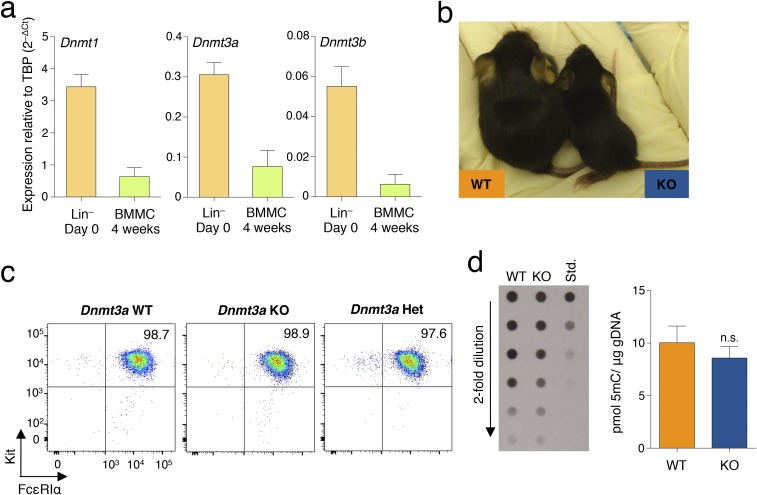
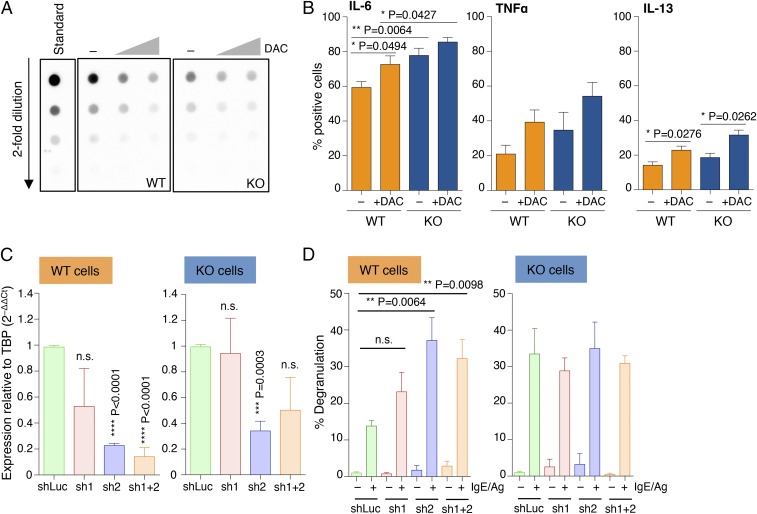
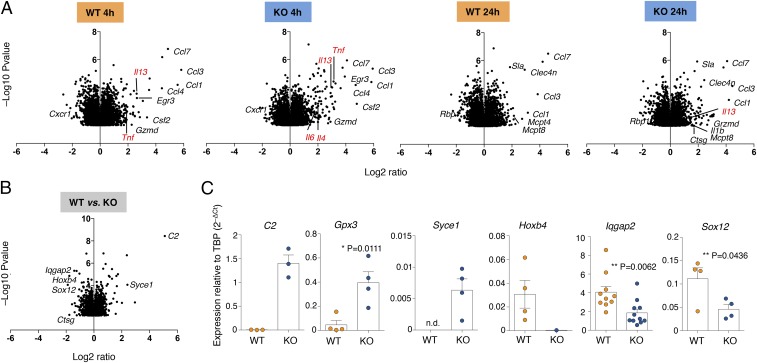
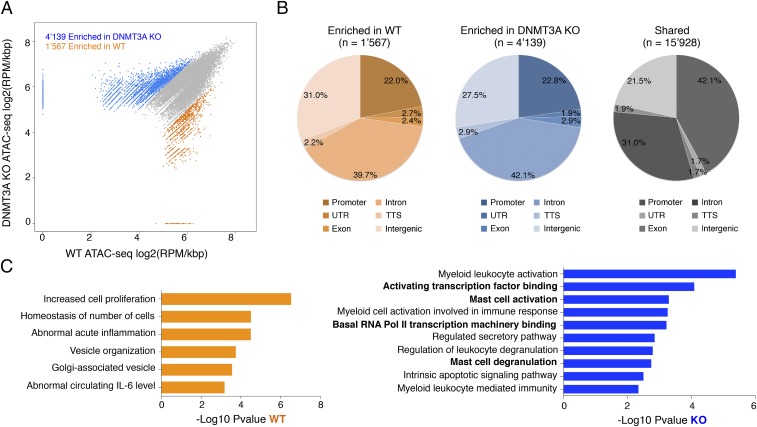
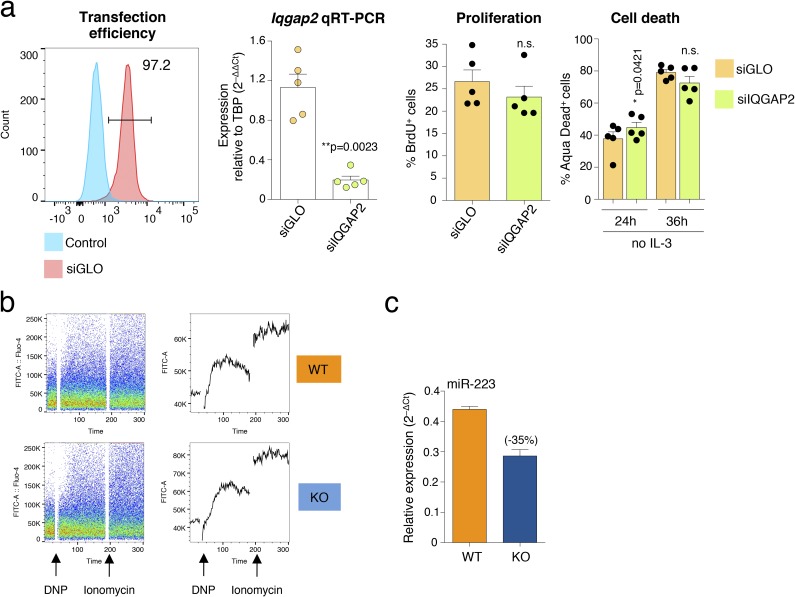
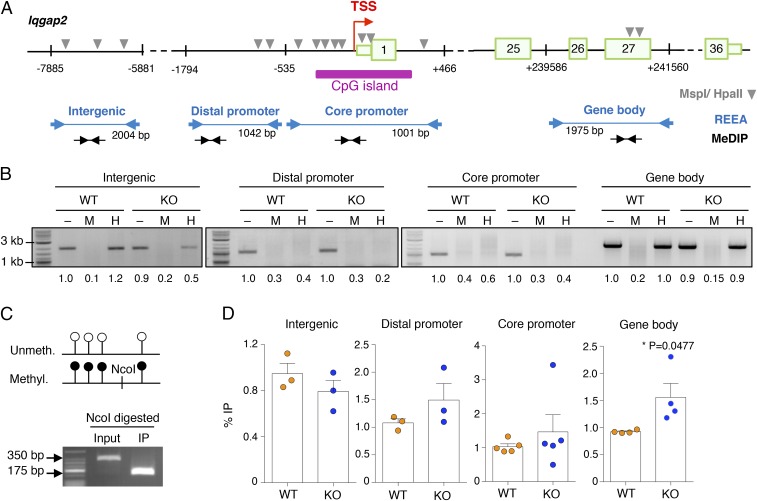
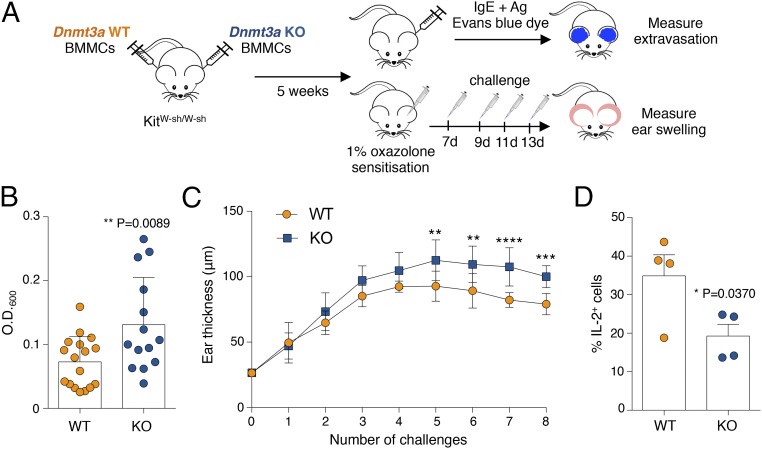
DNA methylation and specifically the DNA methyltransferase enzyme DNMT3A are involved in the pathogenesis of a variety of hematological diseases and in regulating the function of immune cells. Although altered DNA methylation patterns and mutations in DNMT3A correlate with mast cell proliferative disorders in humans, the role of DNA methylation in mast cell biology is not understood. By using mast cells lacking Dnmt3a, we found that this enzyme is involved in restraining mast cell responses to acute and chronic stimuli, both in vitro and in vivo. The exacerbated mast cell responses observed in the absence of Dnmt3a were recapitulated or enhanced by treatment with the demethylating agent 5-aza-2'-deoxycytidine as well as by down-modulation of Dnmt1 expression, further supporting the role of DNA methylation in regulating mast cell activation. Mechanistically, these effects were in part mediated by the dysregulated expression of the scaffold protein IQGAP2, which is characterized by the ability to regulate a wide variety of biological processes. Altogether, our data demonstrate that DNMT3A and DNA methylation are key modulators of mast cell responsiveness to acute and chronic stimulation.

Keywords: DNA methylation; epigenetics; inflammation; mast cells.


Conflict of interest statement

The authors declare no conflict of interest.

Figures

Fig. 1.
Fig. 1.
Mast cells lacking Dnmt3a display a complex phenotype. (A) WT differentiated mast cells were either stimulated with IgE and antigen (Ag) for 6 h or left untreated. After RNA extraction, expression of the indicated Dnmt mRNA was assessed by qRT-PCR. PCR primers used in this study are listed in Table S1. n = 5 independent experiments. Mean ± SEM. TBP, TATA-box-binding protein. (B) Mast cell proliferation was assessed between weeks 4 and 7 of differentiation by BrdU incorporation. One representative experiment is shown (Left); each dot represents one experiment. Mean ± SEM; unpaired t test, two-tailed. (C) Mast cells were deprived of IL-3 for 48 h prior to staining with an Aqua Dead dye to determine cell survival. Shown is the percentage of dying mast cells (Kit+ Aqua Dead+) in the absence of IL-3 in n = 3 independent experiments. Mean ± SEM; unpaired t test, two-tailed. (D) Degranulation of mast cells was measured by annexin V staining upon stimulation with IgE and antigen complexes for 30 min. Each dot represents one experiment. Mean ± SEM; unpaired t test, two-tailed. (E) Mast cell degranulation upon stimulation with either IgE and antigen complexes or phorbol 12-myristate 13-acetate (PMA) and ionomycin (P+I) was measured by β-hexosaminidase release. P+I stimulation was used as a positive control to induce maximum degranulation. n = 4 independent experiments. Mean ± SEM; unpaired t test, two-tailed. n.s., not significant.
Fig. 2.
Fig. 2.
Increased cytokine production in the absence of Dnmt3a. (A) Intracellular staining for the indicated cytokines in mast cells stimulated with IgE and antigen for 3 h. One representative experiment is shown. SSC, side-scatter. (B) Same as A; each dot represents one experiment. Mean ± SEM; paired t test, two-tailed (****P < 0.0001). (C) Release of IL-6 and TNF-α in the supernatant was measured by ELISA after 12 h of stimulation. n = 4 independent experiments. Mean ± SEM.
Fig. S1.
Fig. S1.
(A) Reduced expression of Dnmts upon differentiation of hematopoietic precursors into mast cells. Lin hematopoietic precursors were isolated from murine bone marrow using a Lineage Cell Depletion Kit (Miltenyi Biotec). Cells were either immediately lysed in TRIzol for RNA extraction or differentiated into mast cells for 4 wk, after which expression of Dnmt1, Dnmt3a, and Dnmt3b was assessed by qRT-PCR. n = 3 independent experiments. Mean ± SEM. (B) Dnmt3a KO mice are runt and fail to thrive. Shown is one example of a Dnmt3a KO pup at 2.5 wk of age, together with an age-matched littermate. (C) Dnmt3a KO mast cells are indistinguishable from their WT counterparts. Bone marrow cells were obtained from age- and sex-matched Dnmt3a WT, KO, and heterozygous mice and were in vitro differentiated into mast cells. Surface staining for the mast cell markers Kit and FcεRIα revealed no gross phenotypic differences among the three genotypes. (D) Deletion of Dnmt3a does not lead to a significant reduction in overall levels of genomic 5mC. Genomic DNA (gDNA) was extracted from WT and Dnmt3a KO mast cells, and overall levels of 5mC were measured by dot blot assay using an anti-5mC antibody. Data in the histogram are from n = 18 measurements for WT cells and n = 17 measurements for Dnmt3a KO mast cells. Mean ± SEM; unpaired t test, two-tailed.
Fig. 3.
Fig. 3.
Increased mast cell responses upon disruption of DNA methylation activities. (A) Differentiated mast cells were treated with 0.5 and 5 μM 5-aza-2′-deoxycytidine for 48 h, after which genomic DNA was extracted and overall levels of 5mC were quantified by dot blot. (B) Mast cells were treated with 0.5 μM DAC for 3 d before stimulation with IgE and antigen and measurement of cytokine production by intracellular cytokine staining. Mean ± SEM; unpaired t test, two-tailed. (C) Mast cells were transduced with lentiviral vectors (sh1 and sh2) expressing shRNAs to knock down expression of Dnmt1. A vector expressing an irrelevant hairpin (shLuc) was used as control. After puromycin selection of the transduced cells, total RNA was extracted and the extent of Dnmt1 down-regulation was measured by qRT-PCR. Shown are the compiled results of three independent experiments. Mean ± SEM; unpaired t test (relative to the shLuc sample), two-tailed. (D) Same as C, except that cells were stimulated with IgE and antigen prior to measurement of the extent of degranulation by β-hexosaminidase release. Shown are the compiled results of three independent experiments. Mean ± SEM; unpaired t test, two-tailed.
Fig. 4.
Fig. 4.
Altered gene expression in the absence of Dnmt3a. (A) Mast cells (three independent biological samples) were either left untreated or stimulated with IgE and antigen for 4 or 24 h; RNA was extracted and gene expression was analyzed by microarray. Shown is the effect of stimulation on gene expression in either WT or KO cells. (B) Same as A, except that genes differentially expressed between WT and KO cells (regardless of stimulation) are shown. (C) Selected genes from B were validated in independent biological samples by qRT-PCR. Each dot represents one experiment. Mean ± SEM; unpaired t test, two-tailed.
Fig. 5.
Fig. 5.
Chromatin accessibility in WT and KO cells. (A) The scatter plot shows ATAC-seq signals as reads per million (RPM) per kilobase at chromatin accessible regions in WT and Dnmt3a KO cells. Regions enriched in WT cells are depicted in orange; regions enriched in KO cells are in blue; shared regions are in gray. (B) The diagram illustrates the overall distribution of enriched and shared peaks into promoter, untranslated region (UTR), exon, intron, transcription termination site (TTS), and intergenic regions. (C) Functional enrichment analysis of the enriched regions was performed using GREAT. The full list of categories is provided in Dataset S1.
Fig. 6.
Fig. 6.
Reduced expression of Iqgap2 is sufficient to increase mast cell degranulation. (A) Expression of IQGAP family members Iqgap1 and Iqgap3 was measured by qRT-PCR in WT and KO mast cells. Each dot represents one experiment. Mean ± SEM; unpaired t test, two-tailed. (B) Mast cells were transiently transfected with a pool of siRNAs to knock down Iqgap2 expression. Forty-eight hours after transfection, total RNA was extracted and the extent of Iqgap2 down-modulation was assessed by qRT-PCR. Each dot represents one experiment. Mean ± SEM; paired t test, two-tailed (****P < 0.0001). (C) Same as B, except that transfected cells were stimulated with IgE and antigen, and their ability to degranulate was measured by the release of β-hexosaminidase enzyme. n = 4 independent experiments. Mean ± SEM; unpaired t test, two-tailed. (D) Cells were treated as in C, except that cytokine production was measured by intracellular staining. Each dot represents one experiment. Mean ± SEM; paired t test, two-tailed. (E) WT and KO mast cells were transduced with a lentiviral vector to stably express HA-NFAT1(4–460)-GFP. After selection, cells were stimulated with IgE and antigen for the indicated times, and nuclear translocation of HA-NFAT1(4–460)-GFP was followed over time using a fluorescence microscope. Representative of n = 8 independent experiments. (F) Same as B, except that protein extracts were prepared from transduced cells and the extent of HA-NFAT1(4–460)-GFP dephosphorylation upon stimulation was assessed by Western blot using an anti-HA antibody. (G) Nuclear translocation of endogenous NFAT1 upon stimulation of WT and KO cells with 0.5 μM ionomycin was visualized by immunofluorescence using an anti-NFAT1 antibody. Nuclei were counterstained with DAPI. (H) Calcium flux was measured by flow cytometry in WT and KO cells loaded with Fluo-4 AM and stimulated with IgE anti-DNP antibody and HSA-DNP antigen as well as ionomycin. Shown are the compiled data of n = 5 independent experiments. Mean ± SEM; two-way ANOVA. MFI, mean fluorescence intensity.
Fig. S2.
Fig. S2.
(A) Analysis of mast cell proliferation and survival upon knockdown of Iqgap2. WT mast cells were transfected with Amaxa with the indicated siRNAs; siGLO is a fluorescent conjugated siRNA used to assess efficiency of transfection, which was reproducibly close to 100%. Efficient knockdown of Iqgap2 was assessed by qRT-PCR, cell proliferation was assessed by BrdU incorporation assay, and cell death upon withdrawal of the essential cytokine IL-3 was assessed by Aqua Dead staining as described in SI Materials and Methods. Each dot represents one independent experiment. Mean ± SEM; paired t test, two-tailed. (B) Example of calcium measurement upon stimulation of WT and KO mast cells. (C) Reduced miR-223 expression in Dnmt3a KO mast cells. Total RNA was extracted from WT and KO mast cells. miR-223 expression was measured by qRT-PCR using Exiqon microRNA LNA PCR primer sets. n = 2 independent experiments. Mean ± SEM.
Fig. 7.
Fig. 7.
Methylation analysis of the Iqgap2 locus. (A) Schematic representation (not to scale) of the Iqgap2 locus, with the location of the primers used for REAA and MeDIP-PCR indicated, as well as the location of the restriction sites (MspI/HpaII) required for REAA. Numbered boxes represent exons. (B) REAA of the Iqgap2 locus: Purified genomic DNA of WT and KO cells was either left untreated (–) or digested with the methylation-insensitive enzyme MspI (M) or its CpG methylation-sensitive isoschizomer HpaII (H) before PCR analysis. Representative of n = 2 or 3 independent experiments, depending on the region. Numbers below the bands represent the relative quantification (to input WT) of band intensity. The sizes of the PCR products are indicated in the scheme in A. (C) To check for the efficiency of the IP reaction in all MeDIP experiments, control DNA, containing in vitro methylated and nonmethylated pUC19 plasmid at a ratio of 1:4, was added to every sample before the IP. The combination of plasmid-specific PCR primers with NcoI restriction digestion (site present only in the methylated plasmid) confirmed the specific enrichment of methylated DNA in all MeDIP experiments. Shown is one representative experiment out of at least four. (D) MeDIP-PCR of the Iqgap2 locus: Sonicated genomic DNA from WT and KO cells was immunoprecipitated with an anti-5mC antibody. Shown is the percentage of immunoprecipitated methylated DNA relative to the input for each region. Each dot represents one independent experiment. Mean ± SEM; unpaired t test, two-tailed.
Fig. 8.
Fig. 8.
Increased acute and chronic inflammatory responses in vivo in the absence of Dnmt3a. (A) Schematic representation of the experimental design for passive cutaneous anaphylaxis and oxazolone-induced contact sensitivity experiments. BMMCs, bone marrow-derived mast cells. (B) For passive cutaneous anaphylaxis experiments, the ear pinnae of KitW-sh/W-sh mice were reconstituted with WT or KO mast cells. After ∼5 wk, ears were sensitized intradermally with IgE and then challenged 24 h later by i.v. injection of antigen in the presence of Evans blue dye. The dye was then extracted and measured. Each dot represents one mouse (WT, n = 17; KO, n = 14). Mean ± SD; unpaired t test, two-tailed. (C) Mice were reconstituted as in B, except that they were then challenged with 1% oxazolone, followed, 7 d later, by repeated challenges with 0.5% oxazolone. The extent of inflammation was assessed by measuring swelling of the ears. Data include measurements of eight mice (mean ± SD) and are representative of n = 2 independent experiments. Comparisons between the groups were performed by two-way ANOVA. **P = 0.0061, ***P < 0.0001, ****P < 0.0001. (D) WT and KO cells were stimulated for 5 h with PMA and ionomycin before intracellular cytokine staining for IL-2 expression. Each dot represents one experiment. Mean ± SEM; paired t test, two-tailed.

Similar articles

Cited by

References

    1. Deaton AM, Bird A. CpG islands and the regulation of transcription. Genes Dev. 2011;25(10):1010–1022. - PMC - PubMed
    1. Jaenisch R, Bird A. Epigenetic regulation of gene expression: How the genome integrates intrinsic and environmental signals. Nat Genet. 2003;33(Suppl):245–254. - PubMed
    1. Schübeler D. Function and information content of DNA methylation. Nature. 2015;517(7534):321–326. - PubMed
    1. Yang L, Rau R, Goodell MA. DNMT3A in haematological malignancies. Nat Rev Cancer. 2015;15(3):152–165. - PMC - PubMed
    1. Leoni C, Vincenzetti L, Emming S, Monticelli S. Epigenetics of T lymphocytes in health and disease. Swiss Med Wkly. 2015;145:w14191. - PubMed

Publication types

MeSH terms