. 2017 Feb 21;114(8):E1316-E1325.
doi: 10.1073/pnas.1615233114. Epub 2017 Feb 6.

Estrogen receptor α wields treatment-specific enhancers between morphologically similar endometrial tumors

Affiliations

Estrogen receptor α wields treatment-specific enhancers between morphologically similar endometrial tumors

Marjolein Droog et al. Proc Natl Acad Sci U S A. .

Erratum in

Abstract

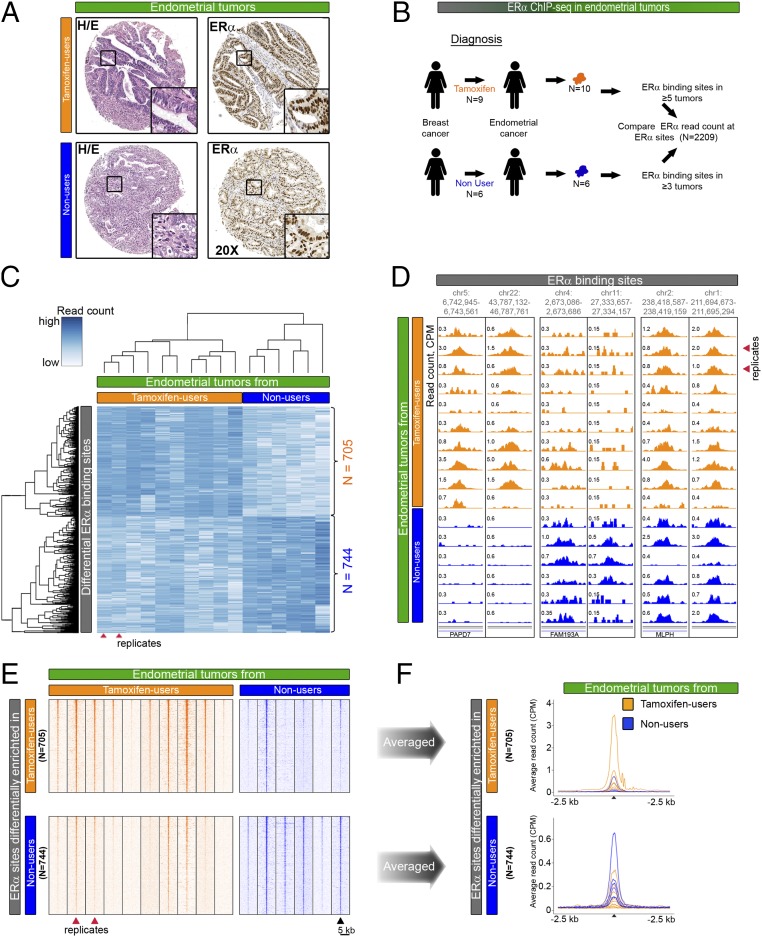
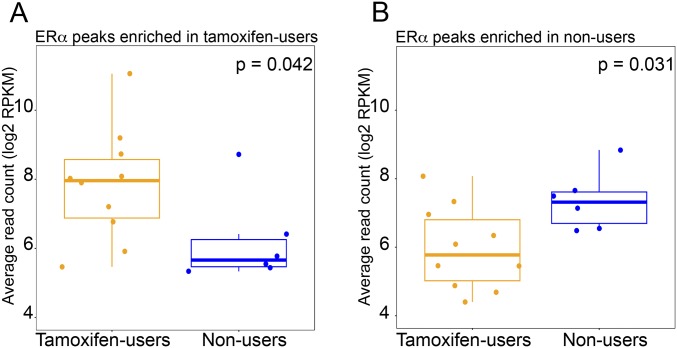
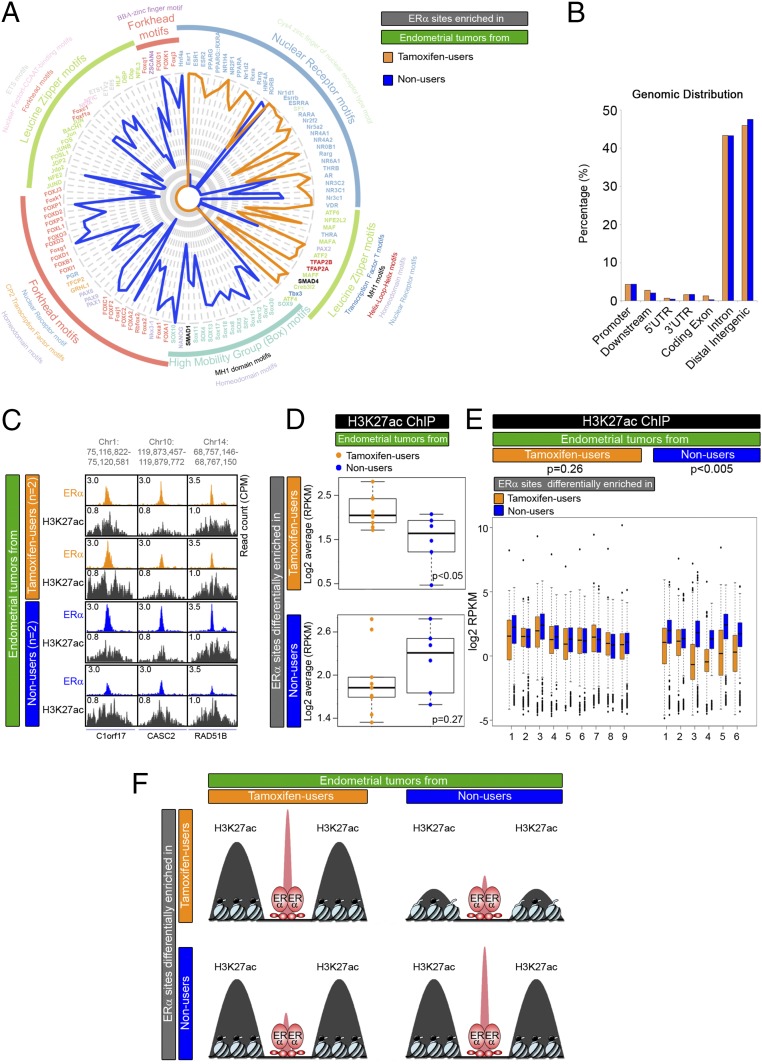
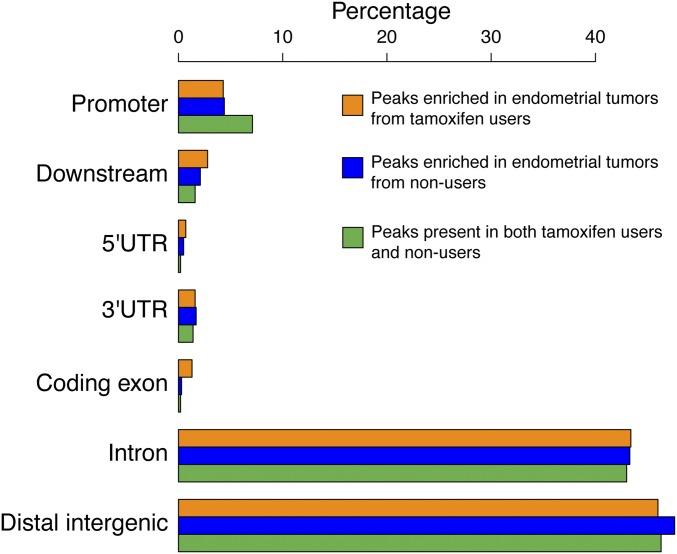
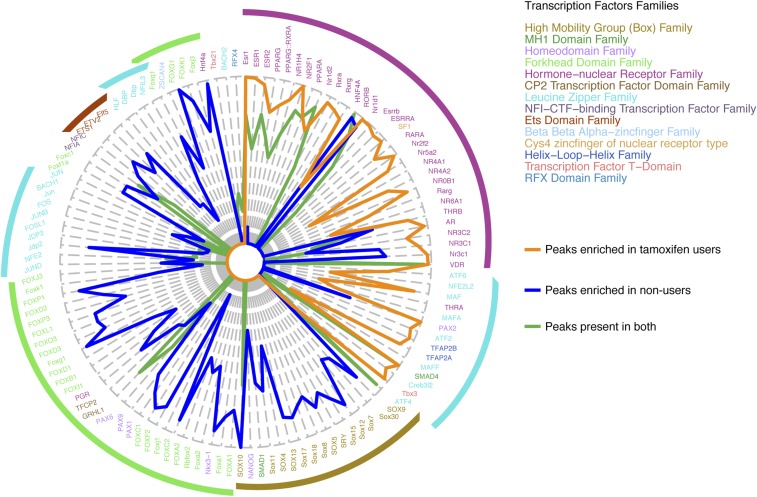
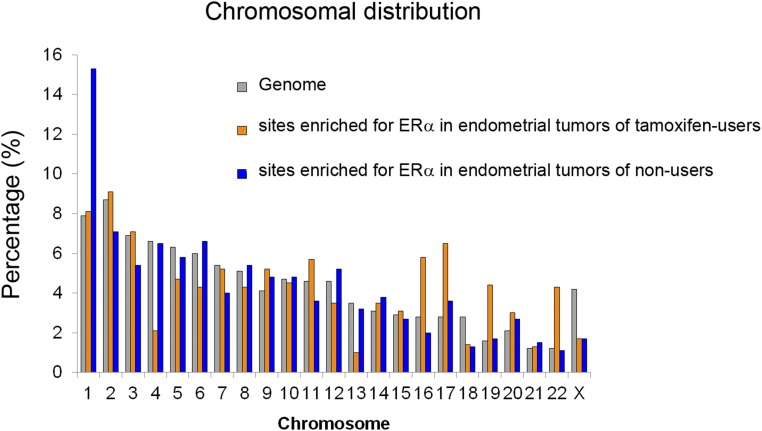
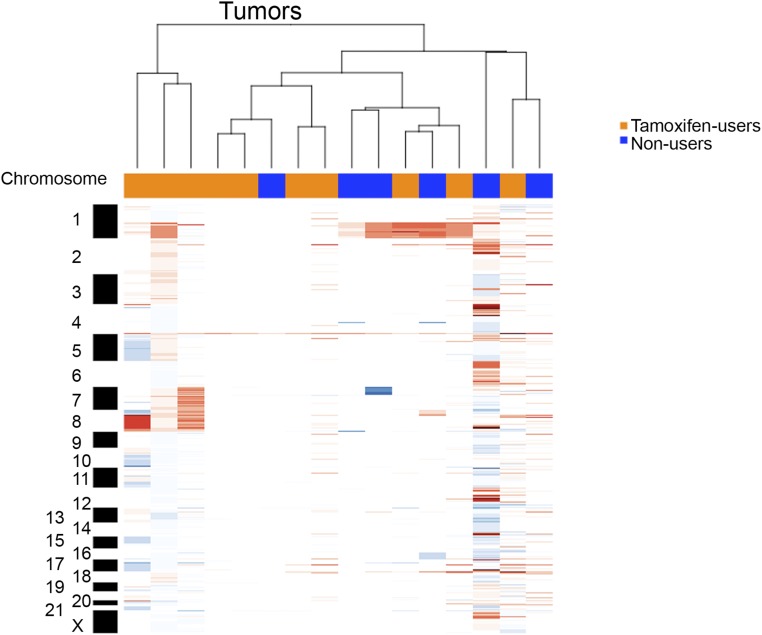
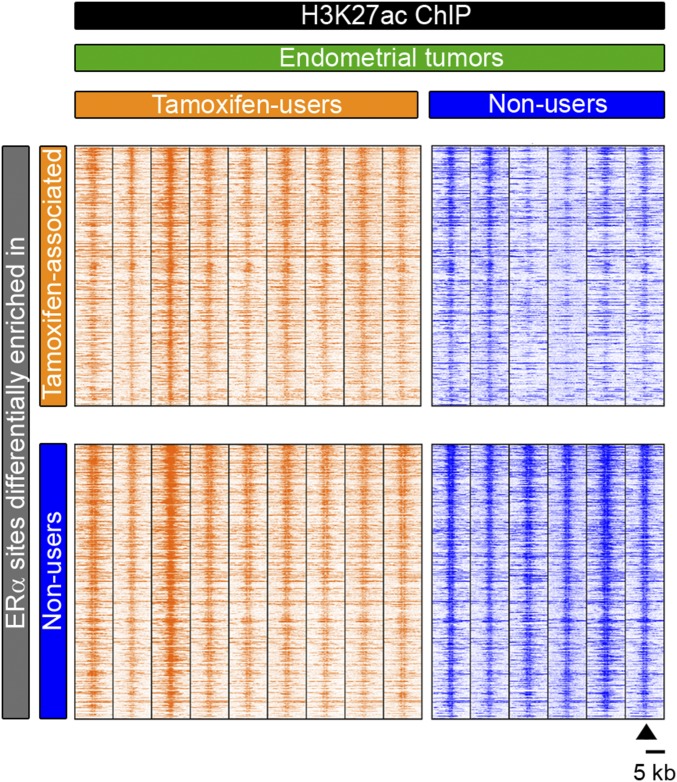
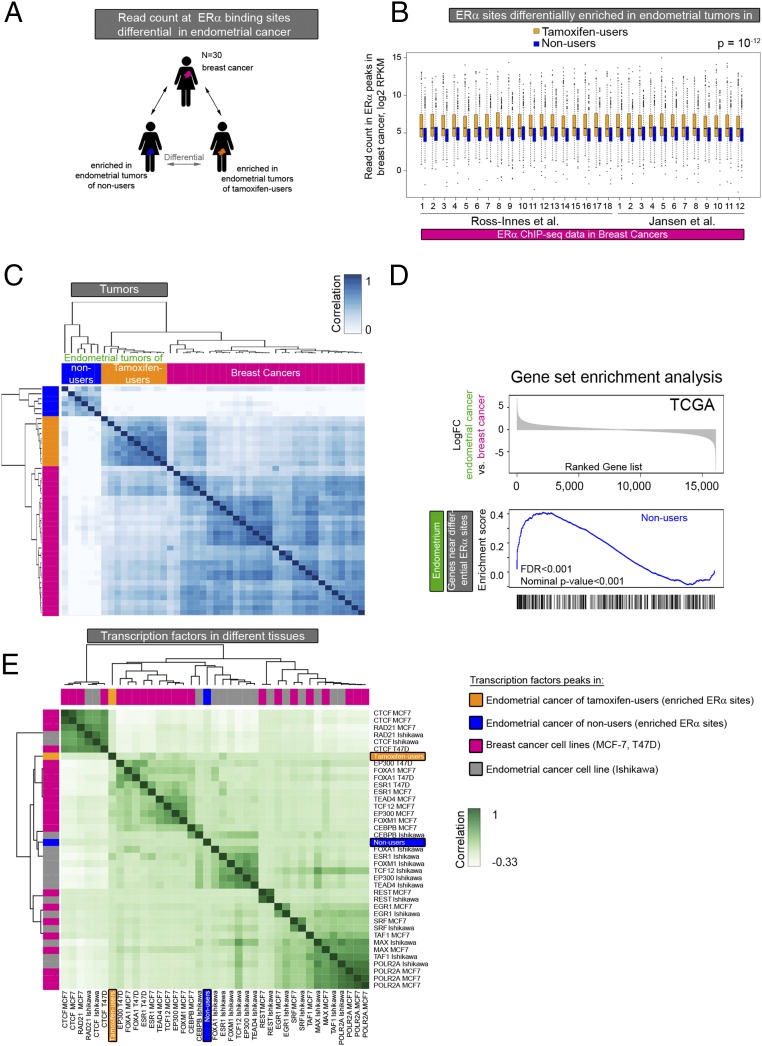
The DNA-binding sites of estrogen receptor α (ERα) show great plasticity under the control of hormones and endocrine therapy. Tamoxifen is a widely applied therapy in breast cancer that affects ERα interactions with coregulators and shifts the DNA-binding signature of ERα upon prolonged exposure in breast cancer. Although tamoxifen inhibits the progression of breast cancer, it increases the risk of endometrial cancer in postmenopausal women. We therefore asked whether the DNA-binding signature of ERα differs between endometrial tumors that arise in the presence or absence of tamoxifen, indicating divergent enhancer activity for tumors that develop in different endocrine milieus. Using ChIP sequencing (ChIP-seq), we compared the ERα profiles of 10 endometrial tumors from tamoxifen users with those of six endometrial tumors from nonusers and integrated these results with the transcriptomic data of 47 endometrial tumors from tamoxifen users and 64 endometrial tumors from nonusers. The ERα-binding sites in tamoxifen-associated endometrial tumors differed from those in the tumors from nonusers and had distinct underlying DNA sequences and divergent enhancer activity as marked by histone 3 containing the acetylated lysine 27 (H3K27ac). Because tamoxifen acts as an agonist in the postmenopausal endometrium, similar to estrogen in the breast, we compared ERα sites in tamoxifen-associated endometrial cancers with publicly available ERα ChIP-seq data in breast tumors and found a striking resemblance in the ERα patterns of the two tissue types. Our study highlights the divergence between endometrial tumors that arise in different hormonal conditions and shows that ERα enhancer use in human cancer differs in the presence of nonphysiological endocrine stimuli.

Keywords: ChIP-seq; breast cancer; endometrial cancer; estrogen receptor; tamoxifen.


Conflict of interest statement

The authors declare no conflict of interest.

Figures

Fig. 1.
Fig. 1.
Comparative analysis of ERα binding in endometrial tumors from tamoxifen users and nonusers. (A) H&E staining and ERα immunohistochemistry staining in endometrial tumors from tamoxifen users and nonusers. (Magnification: 20×.) (B) Experimental set-up of ChIP-seq analyses in endometrial cancers. The analysis compares ERα binding in 10 endometrial tumors from nine tamoxifen users (orange) and ERα binding in six patients who never received endocrine therapy for breast cancer treatment (blue). Patient characteristics are described in Table 1. (C) Hierarchical clustering based on the results of differential binding analysis. (Upper) ERα-binding sites (705) that have a higher read count in tamoxifen-associated endometrial tumors (orange). (Lower) ERα-binding sites (744) that have a higher read count in endometrial tumors from patients who never used tamoxifen (blue). Red arrowheads indicate two tumors that originated from one patient. (D) Snapshots depicting ERα-binding sites in 16 endometrial tumors at the indicated genomic locations. Read counts were normalized [in counts per million sequenced reads (cpm)]. (E) Heatmap visualizing raw read count intensity of ERα at differential binding sites in tamoxifen-associated endometrial tumors (orange) and endometrial tumors from patients who never used tamoxifen (blue). Upper and lower panels show differential ERα-binding sites as described in C. The ChIP-seq signal aligns on the center of the peaks with a window of 5 kb. (F) Averaged read counts for ERα ChIP-seq data in tumors from tamoxifen users (orange) and nonusers (blue) at differential ERα-binding sites. Data align on the center of ERα peaks with a 2.5-kb window.
Fig. S1.
Fig. S1.
Boxplots visualizing the normalized average read count of ERα sites differentially enriched in endometrial tumors of tamoxifen users (A) and nonusers (B). P values are according to the Mann–Whitney test.
Fig. 2.
Fig. 2.
Characterization of ERα sites differentially bound in endometrial tumors from tamoxifen users and nonusers. (A) Radar plot visualizing DNA motif enrichment at genomic ERα sites differentially enriched in endometrial tumors from tamoxifen users (orange) and nonusers (blue). Lengths of radii correspond to the fraction of peaks that contain the identified motif. Motif colors correspond to transcription factor families. (B) Genomic distribution of ERα sites that are differentially enriched in endometrial tumors from tamoxifen users (orange) and nonusers (blue), relative to the nearest gene. (C) Snapshots depicting the H3K27ac ChIP-seq signal at ERα-binding sites in endometrial tumors from tamoxifen users (orange) and nonusers (blue) at the indicated genomic locations. Read counts were normalized [counts per million sequenced reads (cpm)]. (D) Boxplots showing the average normalized H3K27ac read count in endometrial tumors from tamoxifen users (orange dots) and nonusers (blue dots) at differential ERα-binding sites. (E) Boxplots showing normalized H3K27ac read counts at ERα differential binding sites in endometrial tumors from tamoxifen users (orange) and nonusers (blue). P values of the paired t test for each tumor group are shown. (F) Model for the intensity of H3K27ac mark (black) at differential ERα-binding sites (red) in the two tumor groups.
Fig. S2.
Fig. S2.
Genomic distribution of ERα sites that are shared (green) or differentially enriched in endometrial tumors from tamoxifen users (orange) and nonusers (blue), relative to the nearest gene.
Fig. S3.
Fig. S3.
Radar plot visualizing DNA motif enrichment at genomic ERα sites that are shared (green) or are differentially enriched in endometrial tumors from tamoxifen users (orange) or nonusers (blue). Lengths of radii correspond to the fraction of peaks that contain the identified motif. Motif colors correspond to transcription factor families.
Fig. S4.
Fig. S4.
Chromosomal distribution of ERα-binding sites differentially enriched in endometrial tumors from tamoxifen users (orange) or nonusers (blue).
Fig. S5.
Fig. S5.
Copy number variations analysis of endometrial cancers used for ChIP-seq (red indicates genomic gains; blue indicates loss). Copy number profiles are clustered based on correlation; endometrial tumors from tamoxifen users and nonusers do not cluster according to tumor group.
Fig. S6.
Fig. S6.
Heatmap showing raw read count intensity of H3K27ac in endometrial tumors from tamoxifen users (orange) and nonusers (blue) at DNA sites that are differentially bound by ERα per group.
Fig. S7.
Fig. S7.
The networks illustrate the results of the pathway enrichment analysis (with GSEA) of differential gene expression in tamoxifen users and nonusers. Nodes represent pathways that link overlapping genes (overlap coefficient cutoff 0.5). Red nodes illustrate pathways up-regulated in tamoxifen users, and blue nodes represent pathways up-regulated in nonusers.
Fig. 3.
Fig. 3.
ERα-mediated gene regulation in endometrial tumors from tamoxifen users and nonusers. (A) The bar plot shows potential upstream regulators of genes proximal to differential ERα-binding sites according to IPA. The Inset shows how potential target genes are defined. (B) GSEA based on differential gene expression in endometrial tumors of tamoxifen users and nonusers from the TAMARISK cohort. (Upper) Ranked log-fold change in gene expression between the two cancer groups. (Lower) Enrichment scores versus gene rank in three significantly enriched gene sets: genes proximal to the binding sites enriched in tamoxifen-associated tumors, genes proximal to the binding sites enriched in tumors of nonusers, and genes up-regulated by estradiol in the MCF-7 breast cancer cell line. Patient characteristics are described in Table 1. (C) Top network from IPA based on genes identified as potential targets of ERα by combined analysis of gene expression and ChIP-seq data.
Fig. 4.
Fig. 4.
Comparative analysis of ERα-binding sites in endometrial and breast tumor tissue. (A) Analysis set-up. ERα binding in breast cancer at the differential sites in the two endometrial cancer groups was evaluated. (B) Boxplot showing the normalized ERα ChIP-seq read count in breast cancers at the ERα-binding sites differentially enriched in endometrial tumors from tamoxifen users (orange boxplots) and nonusers (blue boxplots). The P value of the paired t test is P = 10−12. (C) Heatmap visualization of the correlation matrix based on ERα ChIP-seq read count at differential ERα-binding sites in endometrial tumors of tamoxifen users (orange) and nonusers (blue) and in breast tumors (pink). (D) GSEA based on differential gene expression in endometrial and breast cancers from the TCGA pan-cancer project. (Upper) Ranked log-fold change in gene expression in endometrial cancer vs. breast cancer. (Lower) Enrichment scores vs. gene rank in the significantly enriched gene set: genes proximal to the binding sites enriched in tumors of nonusers. (E) Hierarchical clustering of the correlation between transcription factor genomic occupancy (peaks) from publicly available ChIP-seq data in the breast cancer cell lines MCF-7 and T47D (pink), the endometrial cancer cell line Ishikawa (gray), and the ERα sites enriched in endometrial tumors from tamoxifen users (orange) and nonusers (blue).
Fig. S8.
Fig. S8.
(A) Heatmap visualization of the correlation matrix based on ERα ChIP-seq read count at ERα-binding sites in endometrial tumors of tamoxifen users (orange), nonusers (blue), and in breast tumors (pink). Only peaks found in at least five tumors were included. (B) Hierarchical clustering of ERα ChIP-seq signal in breast tumors (pink) and endometrial tumors (tamoxifen users are orange; nonusers are blue) in peaks present in at least five tumors.
Fig. S9.
Fig. S9.
Hierarchical clustering of the ERα ChIP-seq signal in endometrial tumors from tamoxifen users (orange) and nonusers (blue) and in breast tumors (pink) in peaks that are differential in endometrial tumors of tamoxifen users and nonusers.

References

    1. Droog M, Mensink M, Zwart W. The estrogen receptor α-cistrome beyond breast cancer. Mol Endocrinol. 2016;30(10):1046–1058. - PMC - PubMed
    1. Shiau AK, et al. The structural basis of estrogen receptor/coactivator recognition and the antagonism of this interaction by tamoxifen. Cell. 1998;95(7):927–937. - PubMed
    1. Flach KD, Zwart W. The first decade of estrogen receptor cistromics in breast cancer. J Endocrinol. 2016;229(2):R43–R56. - PubMed
    1. Hurtado A, Holmes KA, Ross-Innes CS, Schmidt D, Carroll JS. FOXA1 is a key determinant of estrogen receptor function and endocrine response. Nat Genet. 2011;43(1):27–33. - PMC - PubMed
    1. Severson TM, et al. Neoadjuvant tamoxifen synchronizes ERα binding and gene expression profiles related to outcome and proliferation. Oncotarget. 2016;7(23):33901–33918. - PMC - PubMed

Publication types