. 2017 Feb 28;114(9):2271-2276.
doi: 10.1073/pnas.1621412114. Epub 2017 Feb 6.

Cell population structure prior to bifurcation predicts efficiency of directed differentiation in human induced pluripotent cells

Affiliations

Cell population structure prior to bifurcation predicts efficiency of directed differentiation in human induced pluripotent cells

Rhishikesh Bargaje et al. Proc Natl Acad Sci U S A. .

Abstract

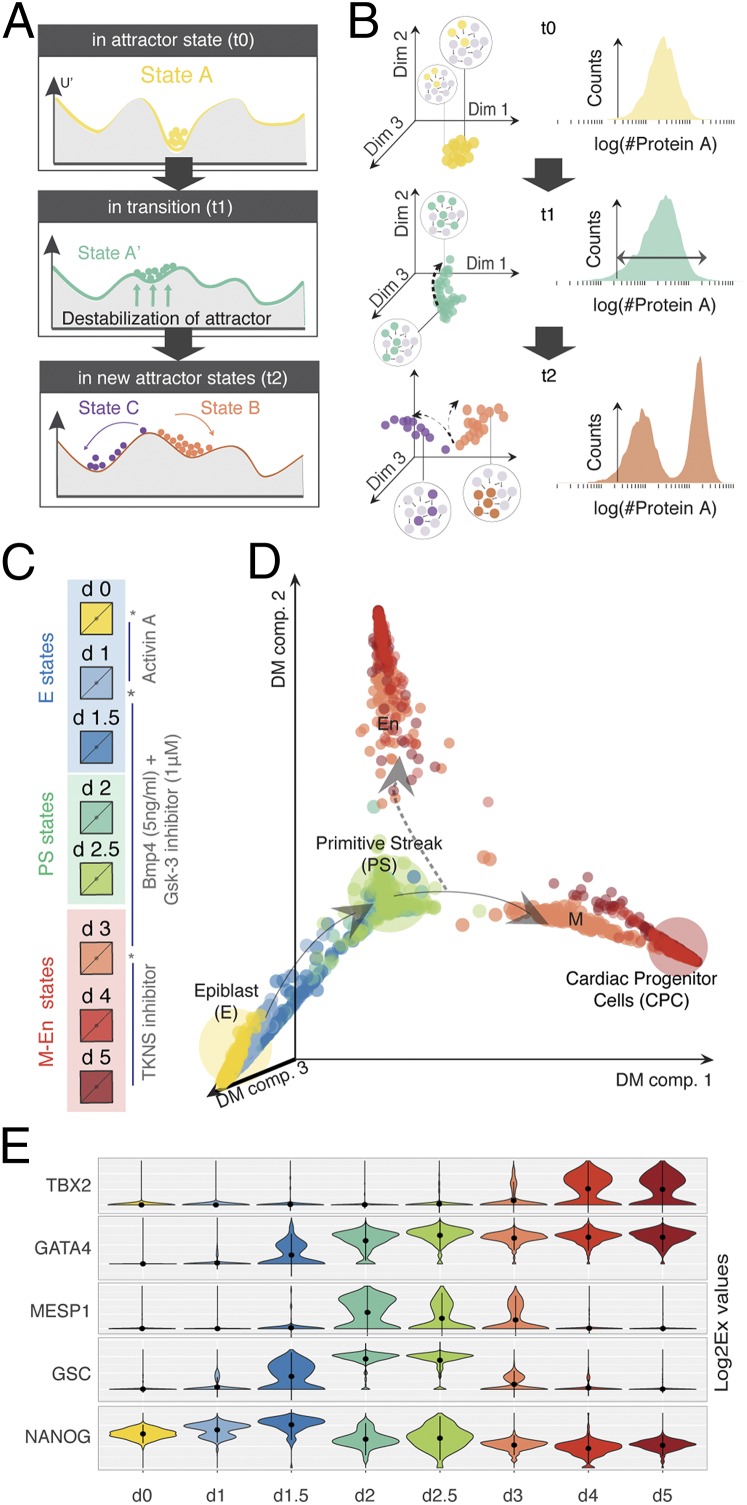
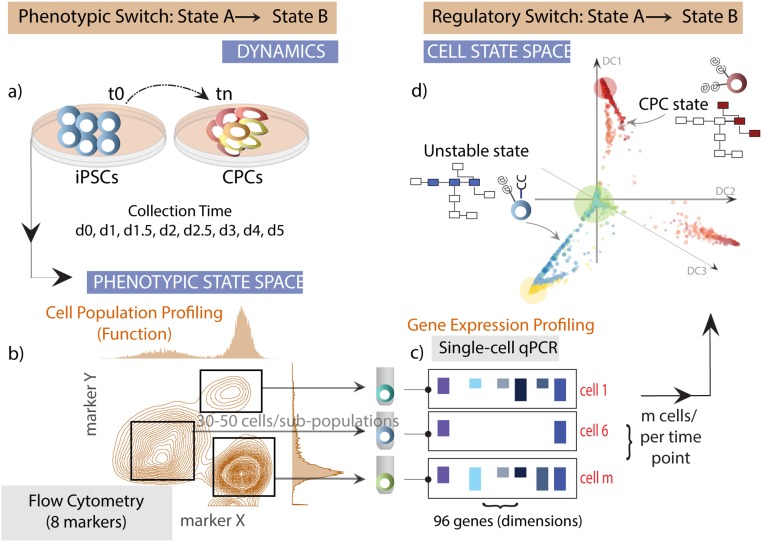
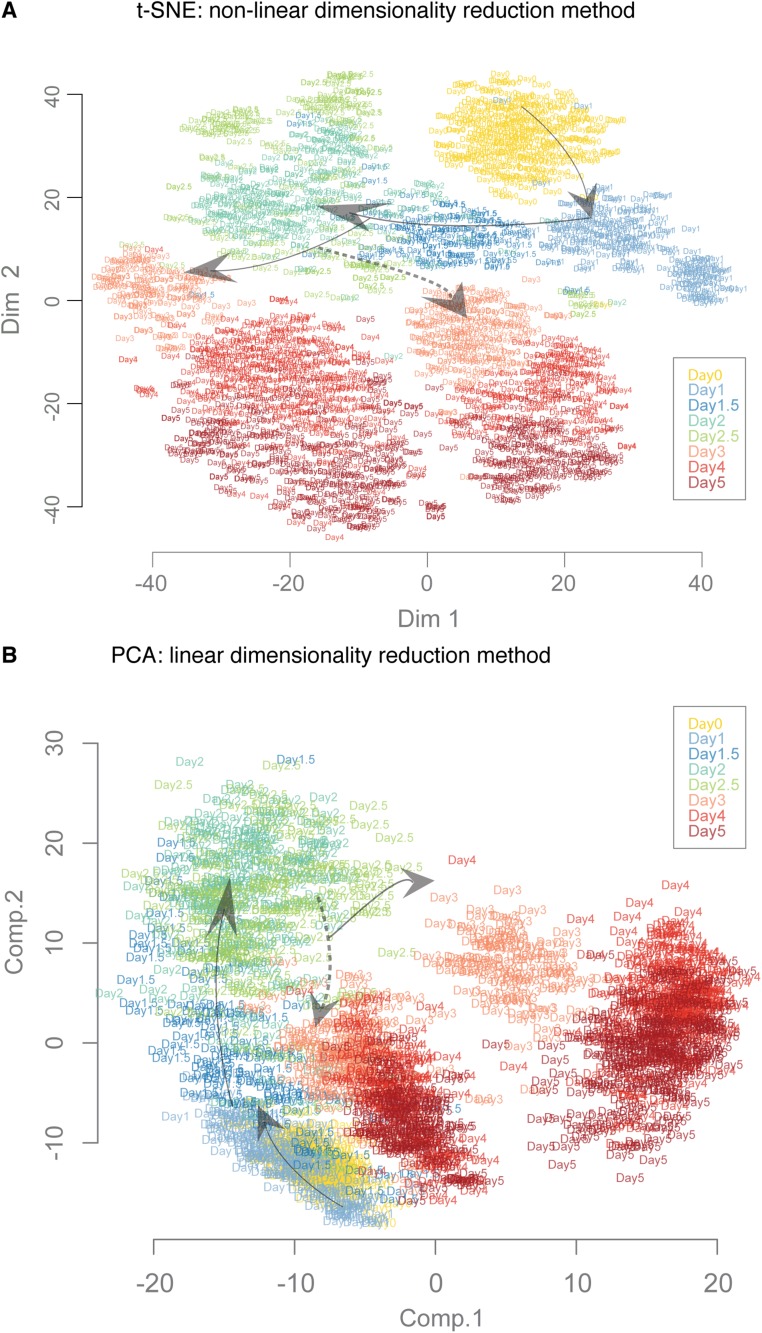
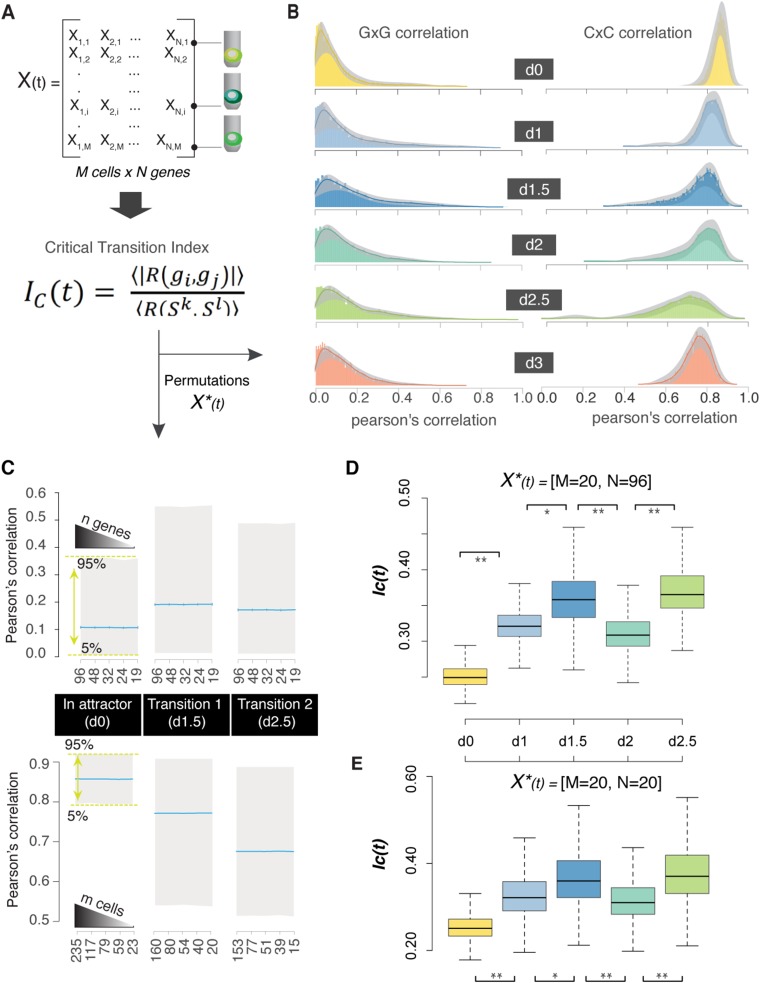
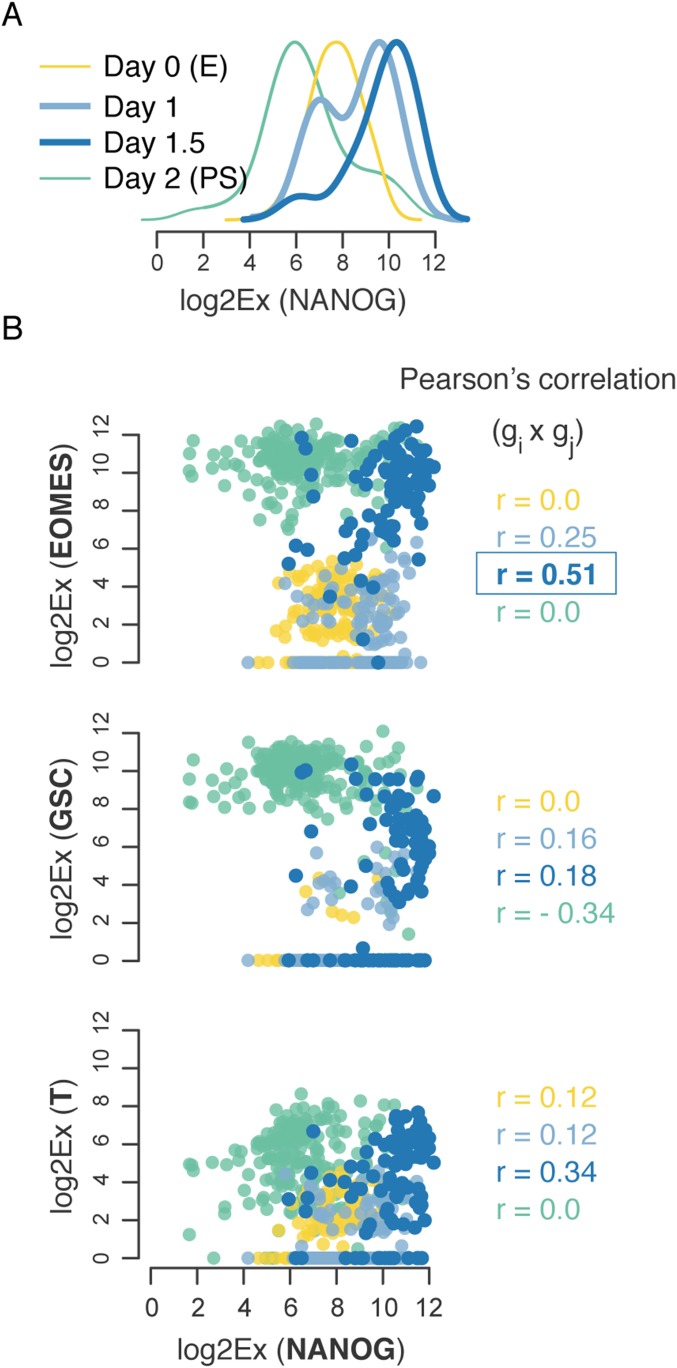
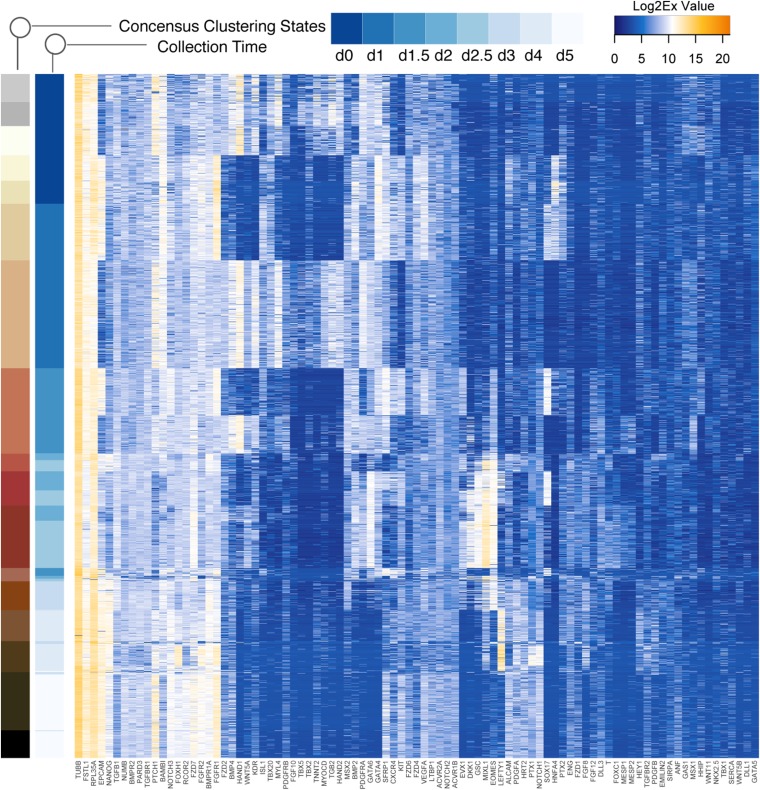
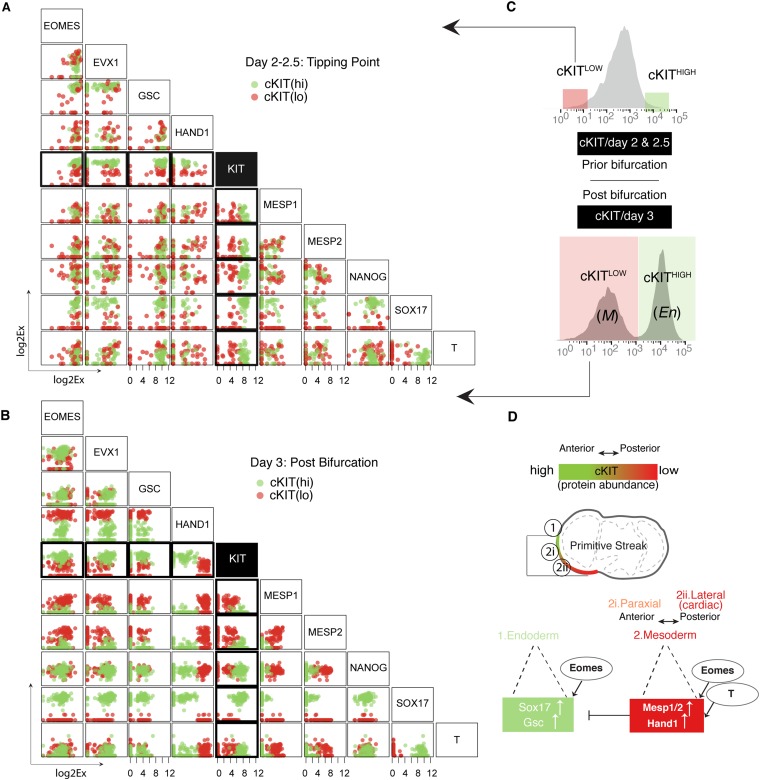
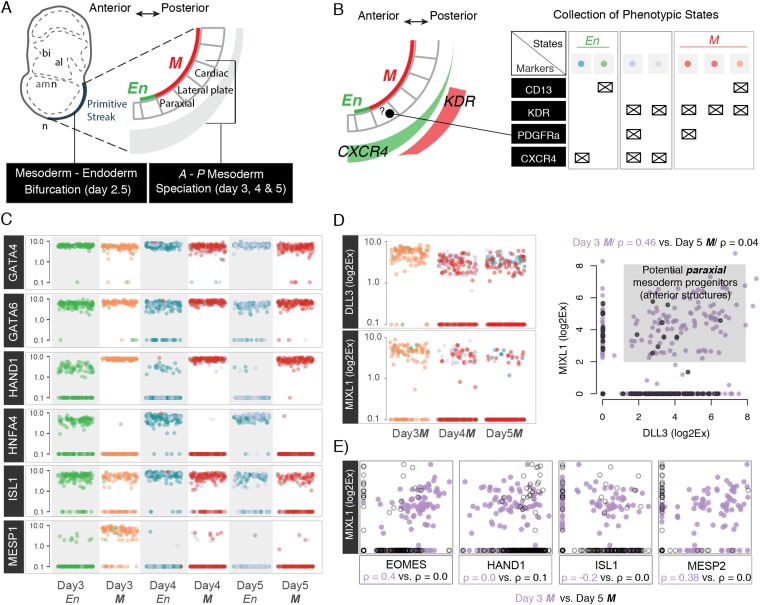
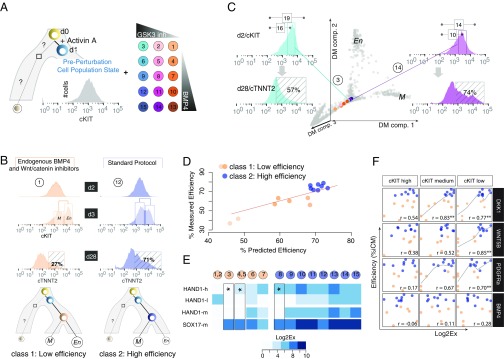
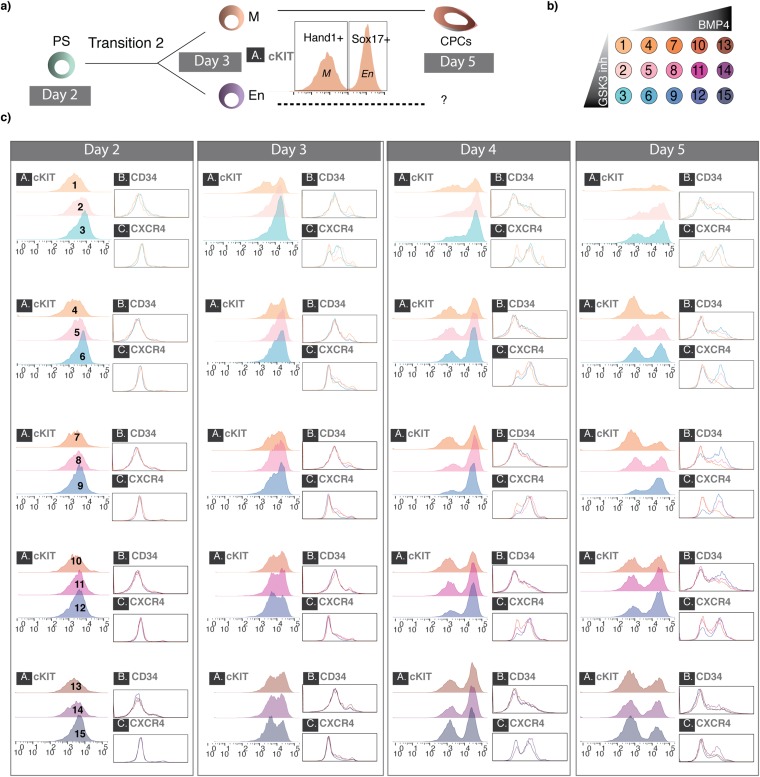
Steering the differentiation of induced pluripotent stem cells (iPSCs) toward specific cell types is crucial for patient-specific disease modeling and drug testing. This effort requires the capacity to predict and control when and how multipotent progenitor cells commit to the desired cell fate. Cell fate commitment represents a critical state transition or "tipping point" at which complex systems undergo a sudden qualitative shift. To characterize such transitions during iPSC to cardiomyocyte differentiation, we analyzed the gene expression patterns of 96 developmental genes at single-cell resolution. We identified a bifurcation event early in the trajectory when a primitive streak-like cell population segregated into the mesodermal and endodermal lineages. Before this branching point, we could detect the signature of an imminent critical transition: increase in cell heterogeneity and coordination of gene expression. Correlation analysis of gene expression profiles at the tipping point indicates transcription factors that drive the state transition toward each alternative cell fate and their relationships with specific phenotypic readouts. The latter helps us to facilitate small molecule screening for differentiation efficiency. To this end, we set up an analysis of cell population structure at the tipping point after systematic variation of the protocol to bias the differentiation toward mesodermal or endodermal cell lineage. We were able to predict the proportion of cardiomyocytes many days before cells manifest the differentiated phenotype. The analysis of cell populations undergoing a critical state transition thus affords a tool to forecast cell fate outcomes and can be used to optimize differentiation protocols to obtain desired cell populations.

Keywords: critical state transitions; differentiation efficiency; iPSC to cardiomyocyte differentiation; prediction; single-cell analysis.


Conflict of interest statement

The authors declare no conflict of interest.

Figures

Fig. 1.
Fig. 1.
Directed differentiation at single-cell resolution. (A) Theoretical and (B) experimental framework to study cell differentiation as a transition between attractors. Before transition (time t0): Cells in state A (local minima in a quasipotential landscape) are defined by a distinct GRN state (expressed and nonexpressed genes are colored and gray, respectively). The state A attractor manifests as either a dense cloud of points in a high-dimensional cell-state space (as measured using single-cell qPCR) or a tight, uniform distribution of a single gene/dimension (as measured by flow cytometry) as shown in B. The tipping point (time t1): The attractor destabilizes (via changes in the quasipotential landscape), and cells become primed toward a future attractor state(s). Cells in the poised state A' exhibit increased cell diversity, which manifests as a shift in the high-dimensional state space or a wider distribution in a single dimension. Posttransition (time t2): Stable states B and C emerge through the stabilization of mutually exclusive GRN states that can be observed as two clouds occupying distinct positions in the high-dimensional cell-state space or bimodal distribution of the marker gene as shown in B. (C) Snapshot of the iPSC to iCM differentiation protocol used in this study. Asterisks mark the perturbation time points (days 0, 1, and 3) that also correspond to cell culture media exchanges. (D) Diffusion map (DM) of the iPSC to iCM differentiation based on 1,934 single-cell gene expression vectors of 96 genes. Color of each dot represents the day of collection during differentiation. Arrows indicate the direction of cell-state trajectories. The dashed arrow points toward the undesired cell state. (E) Dynamics of state-specific transcription factors. The violin plots show the variability of gene expression (log2Ex) across each cell population for five transcription factors: NANOG (stem cell marker), GSC (PS marker), MESP1 (posterior PS/cardiac mesoderm marker), GATA4 (mesoderm and endoderm marker), and TBX2 (cardiac marker).
Fig. S1.
Fig. S1.
An integrative systems biology approach to study cell differentiation. We integrated single-cell qPCR measurements with flow cytometry to connect the phenotypic states (cell surface marker profile) to the regulatory states (transcription factor expression profile). (A) Single cells are collected using flow cytometry at specific time points as iPSCs differentiate to cardiac progenitors cells (CPCs) as described in the methods for downstream single-cell and population analyses. (B) We monitor the dynamics for eight specific cell surface markers, and individual cells from distinct cell populations are sorted into wells of a 96-well plate containing a buffer optimized for single-cell cDNA synthesis. (C) We performed qPCR on cDNA generated from sorted single cells using Fluidigm’s microfluidics-based platform (Biomark). The expression level of 96 genes (composed of transcription factors, signal transducers, and cell surface proteins) was measured in ∼1,900 individual cells. (D) Finally, we performed a rigorous computational analysis of single-cell gene expression data based on clustering, dimensionality reduction, and correlation analysis to map gene regulatory states and identify the differentiation trajectories and branch points.
Fig. S2.
Fig. S2.
Comparison of dimensionality reduction algorithms to visualize the trajectories and transitions. We compared the data projections based on 1,934 single-cell gene expression profiles using three different dimensionality reduction methods. Results from diffusion maps are described and discussed in the text: (A) t-SNE—a nonlinear method—and (B) principle component analysis (PCA)—a linear method. The cells are represented by labels according to the collection day. The arrows indicate the general direction of progression of differentiation. The broken line arrows indicate the branching of En lineage from PS-like population.
Fig. 2.
Fig. 2.
A critical transition signature for differentiation branch points. (A) Time point-specific boxplots represent the distribution of IC(t) values from 1,000 permutations of 25 randomly selected genes. After bifurcation, we used cells that cluster as M lineage for day 3. The mean value corresponds to the IC(t) value [X(t) = 96 genes × M cells]. **P value < 2e-10 for comparison between the time points (Kolmogorov–Smirnov test and Wilcoxon rank sum test). (B) Gene to gene (GxG) correlation plots for six lineage-specific transcription factors at day 0 (“in attractor”). The shade corresponds to the Pearson’s correlation across all of the cells for each pairwise comparison, whereas the shape of the data cloud shows the distribution of Pearson’s correlation across all of the cells for each gene pair. (C and D) GxG correlation plots for six lineage-specific transcription factors during two state transitions. We can observe distinct patterns for individual genes, such as EOMES (important during EPS but not PSM transition), or small regulatory circuits (i.e., day 2.5 shows anticorrelated networks that are related with lineage segregation). (E) Early iPSC to iCM differentiation model. Each cell state (stable or transitional) can be marked by specific transcription factors.
Fig. S3.
Fig. S3.
Robustness of the IC values using bootstrap analysis. (A) Time point-specific matrices—X(t)—were generated based on the Log2Ex gene expression values (columns correspond to genes, and rows correspond to cells). After bifurcation, we generated time- and lineage-specific matrices (i.e., cells that cluster as M lineage on day 3). For each matrix, we calculated the critical transition index. (B) Dynamics of gene to gene (GxG) and cell to cell (CxC) correlations. Solid lines correspond to the density plot based on the correlation values of the X(t), whereas the gray regions show the confidence intervals (5 and 95%) computed from 1,000 permutations of 50 randomly selected cells for each population [X*(t) = 50 cells × 96 genes]. (C) Boxplots present the distribution of Pearson’s correlation values from 1,000 permutations of n randomly selected genes [X*(t) = n genes × M cells] or m randomly selected cells [X*(t) = N genes × m cells] for each time point. Blue lines indicate the mean values that are used for the IC(t) calculations. The graph shows that mean values for both GxG and CxC correlations, as a component of the IC index, are not affected by the number of selected variables. (D and E) Boxplots present the distribution of IC(t) values from 1,000 permutations with specific matrix sizes: X*(t) = 96 genes × 20 cells or X*(t) = 20 genes × 20 cells. As expected, the size of the vector (n = 96 vs. n = 20) influences the possible index value, although the trend (increasing during transitions) remains constant; the relative trend is there. *P value < 5e-10 for comparison between the time points (Kolmogorov–Smirnov test and Wilcoxon rank sum test); **P value < 2e-10 for comparison between the time points (Kolmogorov–Smirnov test and Wilcoxon rank sum test).
Fig. S4.
Fig. S4.
Transcription factor EOMES drives the E to PS transition. (A) Dynamics of the NANOG gene expression. Density plots of NANOG gene expression—a pluripotency marker for day 0 (pluripotency state) to 2 (PS state). (B) Dynamics of the regulatory relationships between NANOG and PS specifiers. Plots based on Log2Ex values for each pairwise comparison (i.e., NANOG vs. EOMES) illustrate the molecular noise during the transition (colored by cell population across time). Pearson’s correlations were calculated separately for each time point.
Fig. S5.
Fig. S5.
Consensus clustering to identify regulatory states and state specifiers. Heat map showing regulatory states based on consensus clustering of the gene expression data (Log2Ex values) for individual cells for all time points. Color bars indicate 17 robust clusters (>80% accuracy) and day of collection.
Fig. S6.
Fig. S6.
cKIT protein abundance correlates with anterior–posterior patterning factors. (A) Correlation plots for nine transcription factors and c-KIT for days 2 and 2.5 (prior bifurcation). The color corresponds to the phenotypic properties of the cells (more specifically, the protein abundance of cell surface marker cKIT; C). (B) Correlation plots for nine transcription factors and c-KIT for day 3 (postbifurcation). The color corresponds to the phenotypic properties of the cells (more specifically, the protein abundance of cell surface marker cKIT; C). (C) Flow cytometry analysis for cKIT protein. Boxes illustrate the fraction of populations that was analyzed as cKITLOW–cKIT(lo) or cKITHIGH—cKIT(hi). (D) A model for anterior–posterior patterning of PS. cKITHIGH correlates with En cell fates that are located in the most anterior part of PS and express high levels of SOX17 and GSC. The rest of the PS correlates with cKITLOW and associates with M cell fates.
Fig. S7.
Fig. S7.
Cell states during anterior–posterior mesoderm specification. (A) Model of the anterior–posterior patterning of PS. (B) Distribution of cell surface molecules in PS and collected phenotypic states that are related to En or M cell fates. For instance, KDR+ cells are primarily related to lateral mesoderm fate, whereas PDGFRa is mainly a paraxial mesoderm marker. The color scheme is used below to indicate how different transcription factors are distributed between each phenotype. (C) Plots of Log2Ex values for six transcriptions factors that define M or En cell fates: GATA4 and GATA6 indicate both cell fates; HAND1, ISL1, and MESP1 indicate cardiac cell fates/midposterior PS; and HNFA4 indicates En cell fates/anterior PS. (D) MIXL1 (a transcription factor) and DLL3 (a Notch ligand) have been recently reported (4) as paraxial mesoderm markers. They can be detected between days 3 and 5, but they correlate only during day 3 (correlation plot), suggesting that there might be a paraxial mesoderm population early during mesoderm specification process. (E) Correlation plots for days 3 and 5 gene expression between MIXL1 (a paraxial mesoderm regulator) and four other transcription factors. Notice that EOMES that is associated with anterior PS specification has a positive correlation with MIXL1, whereas ISL1 that is expressed in the most posterior parts is slightly anticorrelated with MIXL1. However, all correlations are lost by day 5.
Fig. 3.
Fig. 3.
cKIT distribution at the tipping point hides M–En primed states. (A) Dynamics of cKIT distribution from day 1 (activin A-induced cells) to 3 (postbranching event). The unimodal distribution before (day 1) and during the tipping point (days 2–2.5) slowly changes to the characteristic bimodal distribution after the branching event (day 3). The cKIT/HAND1+ cells will eventually commit to the cardiac cell fate. (B) Heat map of cell to cell correlations based on the cKITHigh, cKITMedium, and cKITLow single-cell gene expression vectors (30–50 cells per phenotypic state per time point). Cells have been sorted based on the phenotypic state [low (L) → average (M) → high (H)] and time collected (day 0 → day 3). By day 2.5, cKITHigh and cKITLow cells are presented as two distinct states that expressed SOX17 or HAND1, respectively (side bar). These results are supported by consensus clustering analysis (Fig. S5).
Fig. 4.
Fig. 4.
Cell-state diversity at the tipping point predicts differentiation efficiency. (A) Perturbation scheme to influence the M–En branching event on day 3. In total, we tested 15 BMP4/GSK3 inhibitor combinations highlighted with a unique color or number in a circle across all panels herein. (B) Dynamics of the cKIT distribution during early differentiation reflect the effect of each small molecule combination. We observed different cKIT distributions on days 2 and 3 for each treatment (flow cytometry data shown in Fig. S8), which inform predictions about protocol efficiency as measured by the proportion of cTNNT2+ cells—the most commonly used molecules to show the cardiac fate—on day 28 (shown in striped boxes). (C) Projections of the 100-cell pool cKITHigh, cKITMedium, and cKITLow gene expression profiles onto the diffusion map (DM). The single-cell gene expression profiles are shown in gray, and combination-specific, population-specific pooled gene expression vectors are represented with the corresponding colors from A. The position in the trajectory at day 2 as well as the variable distribution of cKIT outlier fractions (shown as numbers in boxes above histograms) can explain huge variation in the efficiencies of the protocols (measured as cTNNT2+ cells at day 28). (D) Random Forest analysis to identify transcripts or cell subpopulations that predict high- vs. low-efficiency protocols. We classified every combination that produces >60% iCMs as high efficiency (dark blue), whereas any combination with efficiency <60% was classified as low efficiency (orange). (E) The cKITHigh, cKITMedium, and cKITLow concatenated gene expression vectors outperform the cKITMedium vector classification. HAND1 gene expression in cKITHigh and cKITLow populations discriminates between three different combinations with different efficiencies (marked by asterisks), whereas SOX17 and HAND1 gene expression in cKITMedium population is the same. (F) Correlation plots for signaling molecules and combination class (low vs. high efficiency). Low-efficiency protocols are marked by lower dosages of exogenous BMP4 (<2.5 μM), but it seems that there is no correlation between exogenous administration and endogenous BMP4 levels (measured as gene expression; no correlation). However, higher dosages of exogenous BMP4 are highly correlated with the expression levels of DKK1 and Wnt5B in the cKITLow population that will commit to the cardiac cell fate. Again, cKITHigh or cKITLow gene expression vectors perform better than cKITMedium.
Fig. S8.
Fig. S8.
Cell population dynamics during early iCM differentiation based on individual protein markers. (A) A model of M–En bifurcation after the PS-like state on day 2 helps to navigate the cell population dynamics (i.e., bimodality of certain markers after day 3). Cell state abbreviations: CPC, cardiac progenitor cell; En, endoderm; M, mesoderm; PS, primitive streak. (B) Representation of the perturbation matrix used to explore the effect of exogenous cues during early cardiomyocyte differentiation. Each color represents a unique BMP4–GSK3 inhibitor combination (GSK3 inhibitor: 0, 0.5, and 1 μM; BMP4, 0, 1.25, 2.5, 5, and 10 ng/mL). In total, there are 15 combinations, and each combination is assigned to a number (1–15) that is used in C. (C) Individual columns represent days during differentiation postinduction with Activin. Each panel in the columns represents three concentrations of GSK3 inhibitor for each BMP4 concentration. FACS plots are marked as in B for each BMP4–GSK3 inhibitor combination and represent expression for (A) cKIT, (B) CD34, and (C) CXCR4.

References

    1. Avior Y, Sagi I, Benvenisty N. Pluripotent stem cells in disease modelling and drug discovery. Nat Rev Mol Cell Biol. 2016;17(3):170–182. - PubMed
    1. Nelson TJ, Martinez-Fernandez A, Terzic A. Induced pluripotent stem cells: Developmental biology to regenerative medicine. Nat Rev Cardiol. 2010;7(12):700–710. - PubMed
    1. Scialdone A, et al. Resolving early mesoderm diversification through single-cell expression profiling. Nature. 2016;535(7611):289–293. - PMC - PubMed
    1. Loh KM, et al. Mapping the pairwise choices leading from pluripotency to human bone, heart, and other mesoderm cell types. Cell. 2016;166(2):451–467. - PMC - PubMed
    1. Semrau S, et al. 2016. Dynamics of lineage commitment revealed by single-cell transcriptomics of differentiating embryonic stem cells. bioRxiv:10.1101/068288.

Publication types

MeSH terms