

Geographical differentiation of the Euchiloglanis fish complex (Teleostei: Siluriformes) in the Hengduan Mountain Region, China: Phylogeographic evidence of altered drainage patterns
- PMID: 28168029
- PMCID: PMC5288251
- DOI: 10.1002/ece3.2715
Geographical differentiation of the Euchiloglanis fish complex (Teleostei: Siluriformes) in the Hengduan Mountain Region, China: Phylogeographic evidence of altered drainage patterns
Abstract
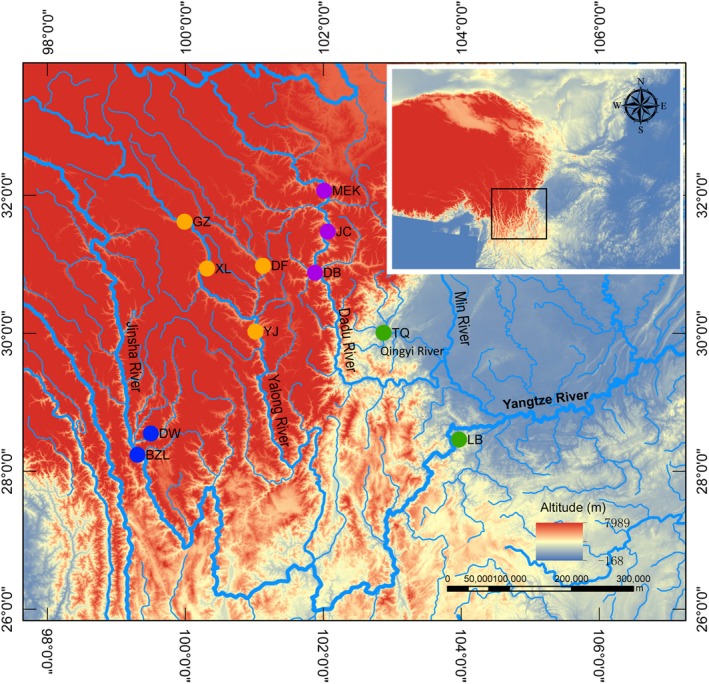
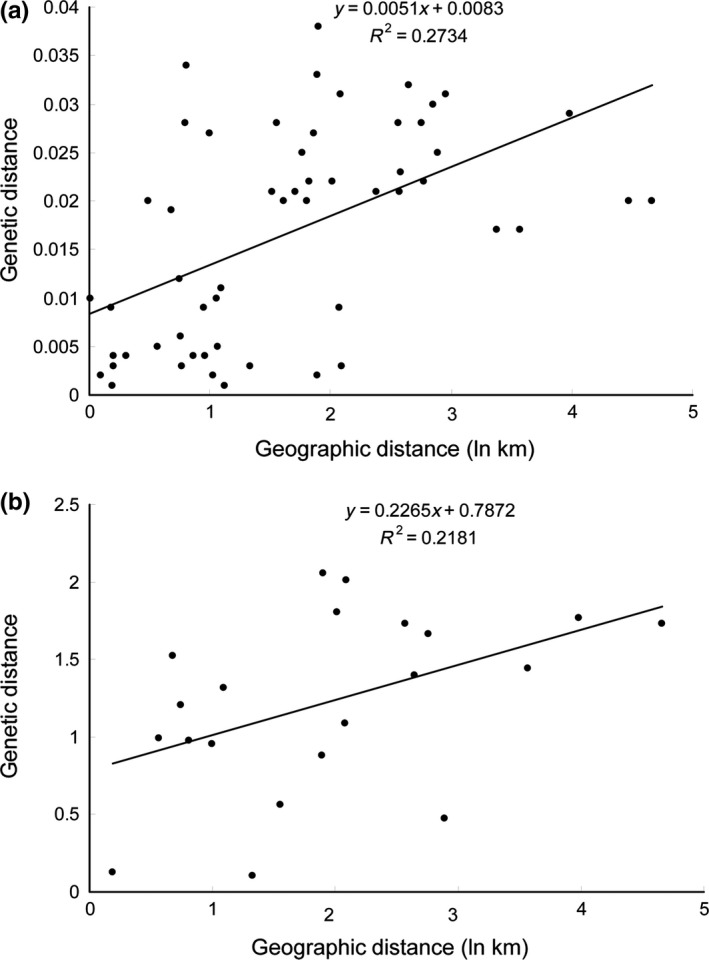
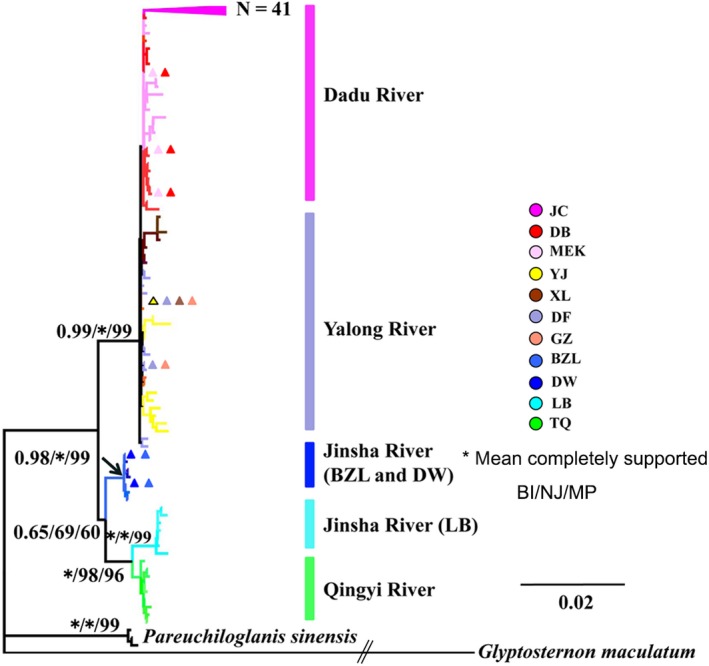
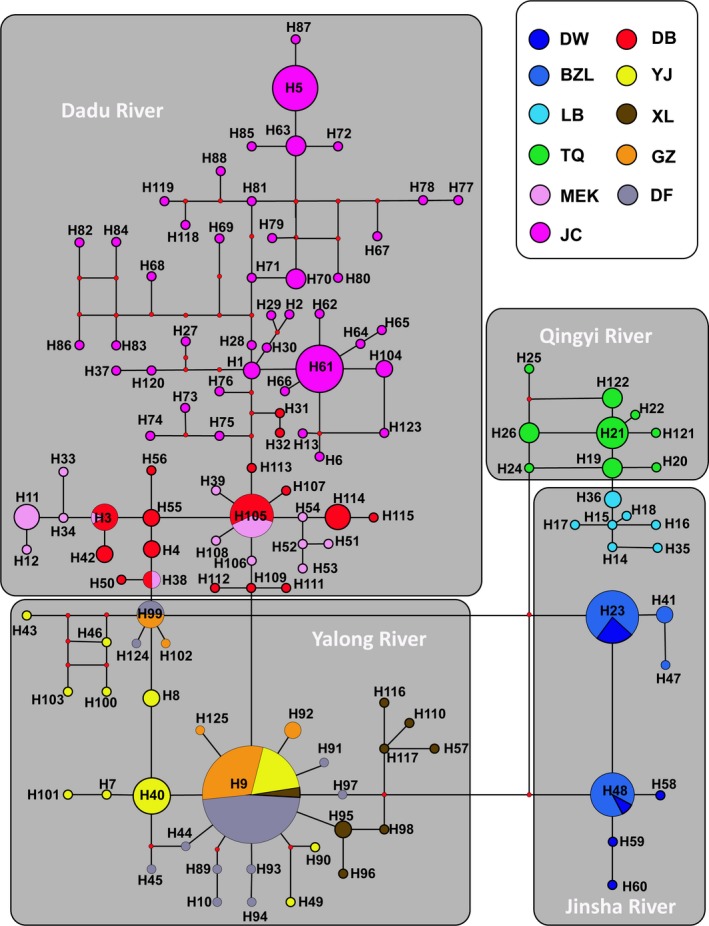
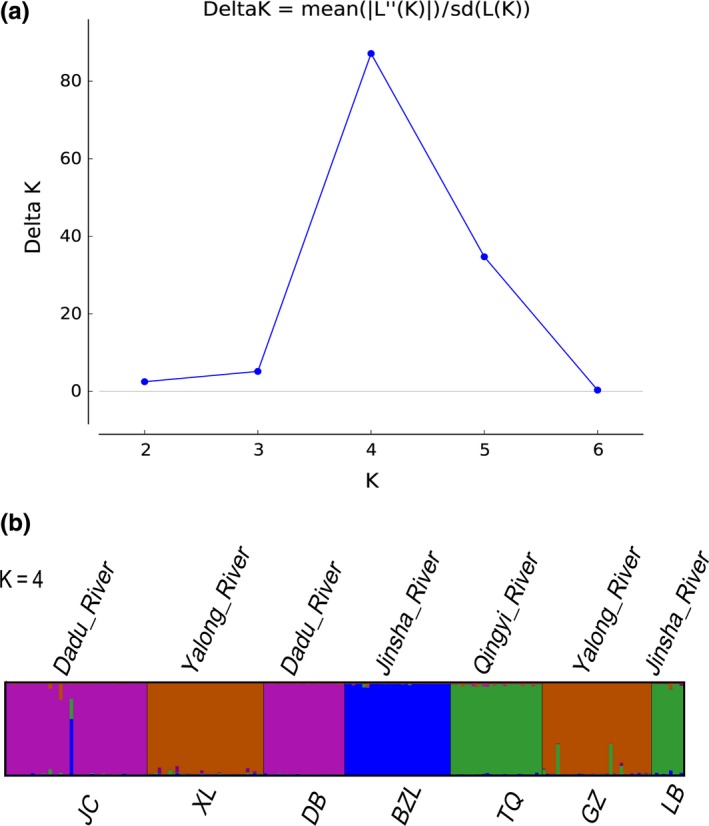
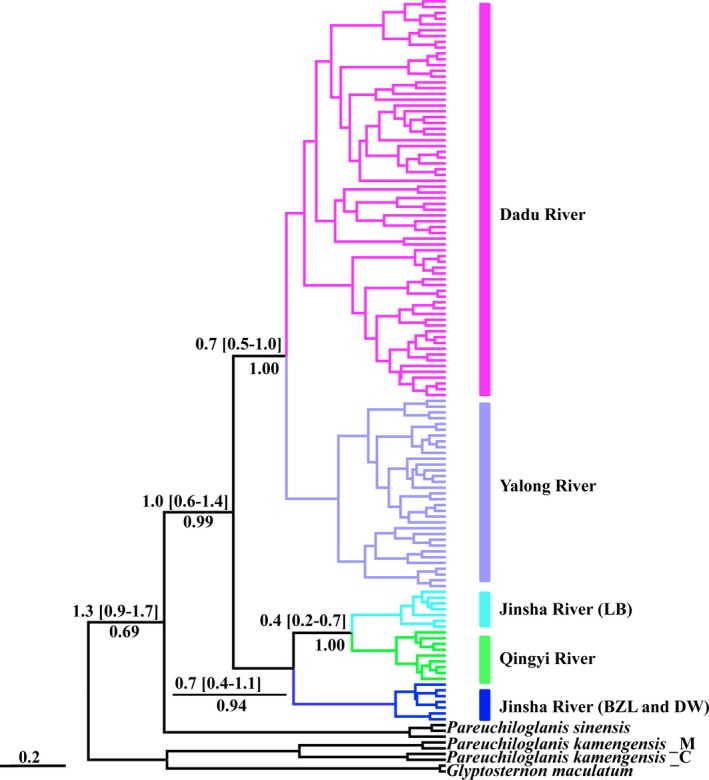
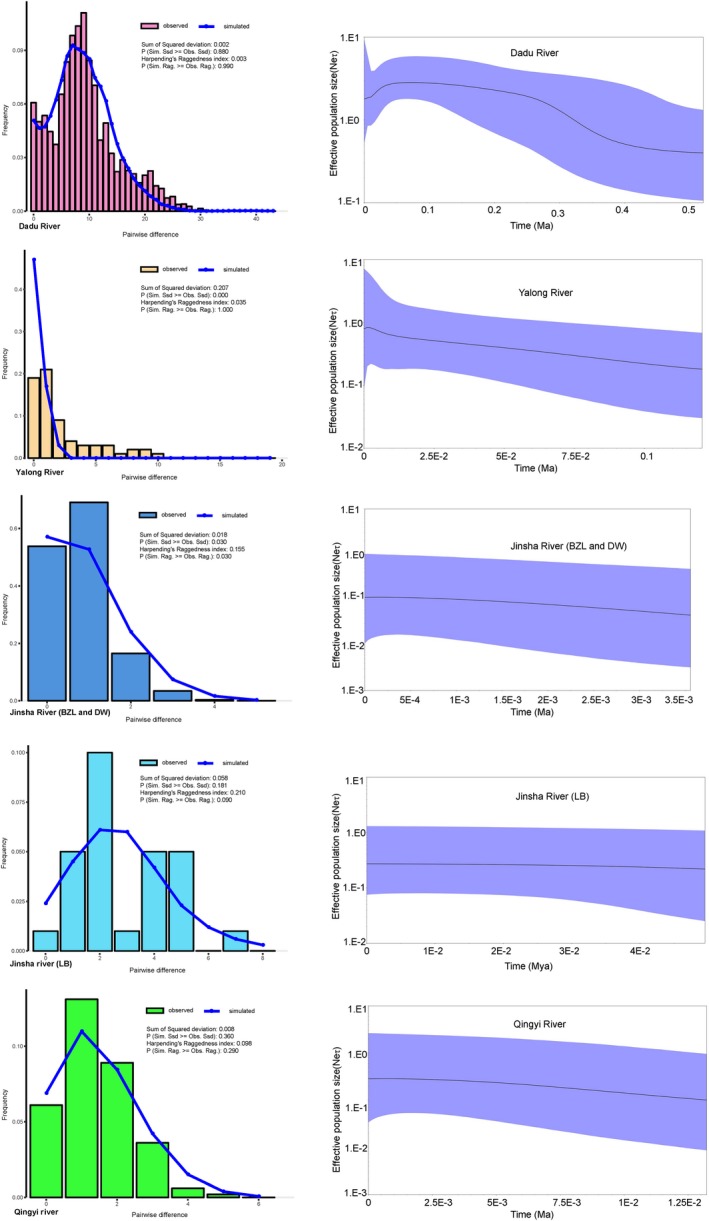
The uplift of the Tibetan Plateau caused significant ecogeographical changes that had a major impact on the exchange and isolation of regional fauna and flora. Furthermore, Pleistocene glacial oscillations were linked to temporal large-scale landmass and drainage system reconfigurations near the Hengduan Mountain Region and might have facilitated speciation and promoted biodiversity in southwestern China. However, strong biotic evidence supporting this role is lacking. Here, we use the Euchiloglanis fish species complex as a model to demonstrate the compound effects of the Tibetan Plateau uplift and Pleistocene glacial oscillations on species formation in this region. The genetic structure and geographical differentiation of the Euchiloglanis complex in four river systems within the Hengduan Mountain Region were deduced using the cytochrome b (cyt b) gene and 10 microsatellite loci from 360 to 192 individuals, respectively. The results indicated that the populations were divided into four independently evolving lineages, in which the populations from the Qingyi River and Jinsha River formed two sub-lineages. Phylogenetic relationships were structured by geographical isolation, especially near drainage systems. Divergence time estimation analyses showed that the Euchiloglanis complex diverged from its sister clade Pareuchiloglanis sinensis at around 1.3 Million years ago (Ma). Within the Euchiloglanis complex, the divergence time between the Dadu-Yalong and Jinsha-Qingyi River populations occurred at 1.0 Ma. This divergence time was in concordance with recent geological events, including the Kun-Huang Movement (1.2-0.6 Ma) and the lag time (<2.0 Ma) of river incision in the Hengduan Mountain Region. Population expansion signals were detected from mismatched distribution analyses, and the expansion times were concurrent with Pleistocene glacier fluctuations. Therefore, current phylogeographic patterns of the Euchiloglanis fish complex in the Hengduan Mountain Region were influenced by the uplift event of the Tibetan Plateau and were subsequently altered by paleo-river transitions during the late Pleistocene glacial oscillations.
Keywords: Euchiloglanis; Hengduan Mountain Region; Pleistocene glacial oscillations; genetic structure; phylogeny; phylogeography.
Figures
Similar articles
-
Phylogeography of Schizopygopsis malacanthus Herzenstein (Cypriniformes, Cyprinidae) in relation to the tectonic events and Quaternary climatic oscillations in the Shaluli Mountains Region.Zoology (Jena). 2020 Dec;143:125835. doi: 10.1016/j.zool.2020.125835. Epub 2020 Aug 29. Zoology (Jena). 2020. PMID: 32949977
-
Phylogeography of Sophora davidii (Leguminosae) across the 'Tanaka-Kaiyong Line', an important phytogeographic boundary in Southwest China.Mol Ecol. 2013 Aug;22(16):4270-4288. doi: 10.1111/mec.12388. Mol Ecol. 2013. PMID: 23927411
-
Phylogeography of the South China field mouse (Apodemus draco) on the southeastern Tibetan Plateau reveals high genetic diversity and glacial refugia.PLoS One. 2012;7(5):e38184. doi: 10.1371/journal.pone.0038184. Epub 2012 May 30. PLoS One. 2012. PMID: 22666478 Free PMC article.
-
Diversification and historical demography of the rapid racerunner (Eremias velox) in relation to geological history and Pleistocene climatic oscillations in arid Central Asia.Mol Phylogenet Evol. 2019 Jan;130:244-258. doi: 10.1016/j.ympev.2018.10.029. Epub 2018 Oct 26. Mol Phylogenet Evol. 2019. PMID: 30393185
-
Mountains as Evolutionary Arenas: Patterns, Emerging Approaches, Paradigm Shifts, and Their Implications for Plant Phylogeographic Research in the Tibeto-Himalayan Region.Front Plant Sci. 2019 Mar 18;10:195. doi: 10.3389/fpls.2019.00195. eCollection 2019. Front Plant Sci. 2019. PMID: 30936883 Free PMC article. Review.
Cited by
-
Gene Flow and Diversification in Himalopsyche martynovi Species Complex (Trichoptera: Rhyacophilidae) in the Hengduan Mountains.Biology (Basel). 2021 Aug 23;10(8):816. doi: 10.3390/biology10080816. Biology (Basel). 2021. PMID: 34440048 Free PMC article.
-
Genetic structure of two sympatric gudgeon fishes (Xenophysogobio boulengeri and X. nudicorpa) in the upper reaches of Yangtze River Basin.PeerJ. 2019 Aug 6;7:e7393. doi: 10.7717/peerj.7393. eCollection 2019. PeerJ. 2019. PMID: 31404431 Free PMC article.
-
Telomere-to-telomere gap-free genome assembly of Euchiloglanis kishinouyei.Sci Data. 2025 May 7;12(1):757. doi: 10.1038/s41597-025-05068-8. Sci Data. 2025. PMID: 40335534 Free PMC article.
-
Pleistocene Landscape Dynamics Drives Lineage Divergence of a Temperate Freshwater Fish Gobio rivuloides in Coastal Drainages of Northern China.Genes (Basel). 2023 Nov 27;14(12):2146. doi: 10.3390/genes14122146. Genes (Basel). 2023. PMID: 38136969 Free PMC article.
-
Phylogeography of Triplophysa stenura (Nemacheilidae): Responded to the Mid-Pleistocene Climate Transition in the Qinghai-Tibetan Plateau.Zool Stud. 2020 Nov 30;59:e67. doi: 10.6620/ZS.2020.59-67. eCollection 2020. Zool Stud. 2020. PMID: 34140984 Free PMC article.
References
-
- Bandelt, H. J. , Forster, P. , & Rohl, A. (1999). Median‐joining networks for inferring intraspecific phylogenies. Molecular Biology and Evolution, 16, 37–48. - PubMed
-
- Barbour, G. B. (1936). Physiographic history of the Yangtze. Geographical Journal, 87, 17–34.
-
- Che, J. , Zhou, W. W. , Hu, J. S. , Yan, F. , Papenfuss, T. J. , Wake, D. B. , & Zhang, Y. P. (2010). Spiny frogs (Paini) illuminate the history of the Himalayan region and Southeast Asia. Proceedings of the National Academy of Sciences of the United States of America, 107, 13765–13770. - PMC - PubMed
-
- Clark, M. K. , House, M. A. , Royden, L. H. , Whipple, K. X. , Burchfiel, B. C. , Zhang, X. , & Tang, W. (2005). Late Cenozoic uplift of southeastern Tibet. Geology, 33, 525–528.
-
- Clark, M. K. , Schoenbohm, L. M. , Royden, L. H. , Whipple, K. X. , Burchfiel, B. C. , Zhang, X. , ··· Chen, L. (2004). Surface uplift, tectonics, and erosion of eastern Tibet from large‐scale drainage patterns. Tectonics, 23, 241–262.
LinkOut - more resources
Full Text Sources
Other Literature Sources
