. 2017 Feb 3;3(2):e1602350.
doi: 10.1126/sciadv.1602350. eCollection 2017 Feb.

The structurally disordered paramyxovirus nucleocapsid protein tail domain is a regulator of the mRNA transcription gradient

Affiliations

The structurally disordered paramyxovirus nucleocapsid protein tail domain is a regulator of the mRNA transcription gradient

Robert M Cox et al. Sci Adv. .

Abstract

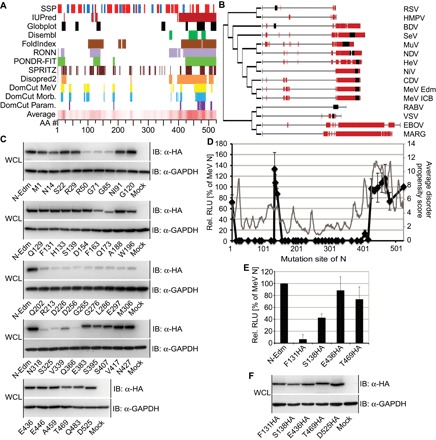
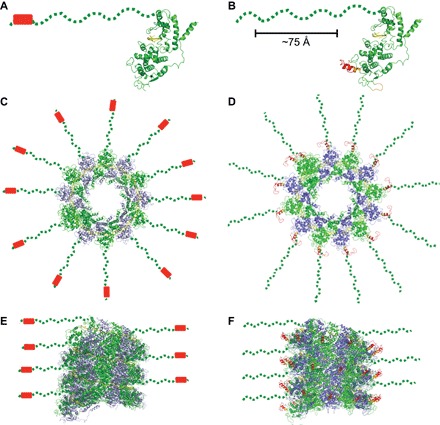
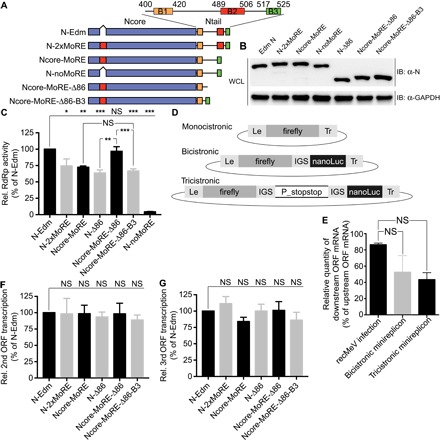
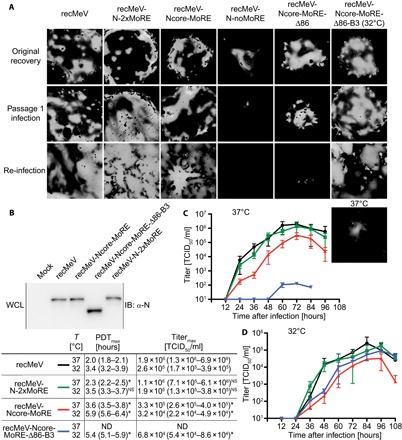
The paramyxovirus RNA-dependent RNA-polymerase (RdRp) complex loads onto the nucleocapsid protein (N)-encapsidated viral N:RNA genome for RNA synthesis. Binding of the RdRp of measles virus (MeV), a paramyxovirus archetype, is mediated through interaction with a molecular recognition element (MoRE) located near the end of the carboxyl-terminal Ntail domain. The structurally disordered central Ntail section is thought to add positional flexibility to MoRE, but the functional importance of this Ntail region for RNA polymerization is unclear. To address this question, we dissected functional elements of Ntail by relocating MoRE into the RNA-encapsidating Ncore domain. Linker-scanning mutagenesis identified a microdomain in Ncore that tolerates insertions. MoRE relocated to Ncore supported efficient interaction with N, MoRE-deficient Ntails had a dominant-negative effect on bioactivity that was alleviated by insertion of MoRE into Ncore, and recombinant MeV encoding N with relocated MoRE grew efficiently and remained capable of mRNA editing. MoRE in Ncore also restored viability of a recombinant lacking the disordered central Ntail section, but this recombinant was temperature-sensitive, with reduced RdRp loading efficiency and a flattened transcription gradient. These results demonstrate that virus replication requires high-affinity RdRp binding sites in N:RNA, but productive RdRp binding is independent of positional flexibility of MoRE and cis-acting elements in Ntail. Rather, the disordered central Ntail section independent of the presence of MoRE in Ntail steepens the paramyxovirus transcription gradient by promoting RdRp loading and preventing the formation of nonproductive polycistronic viral mRNAs. Disordered Ntails may have evolved as a regulatory element to adjust paramyxovirus gene expression.

Keywords: Nucleocapsid; Paramyxovirus; RNA-dependent RNA polymerase; Virus replication; measles virus.


Figures

Fig. 1
Fig. 1. Identification of an interdomain linker region in MeV N that tolerates peptide insertions.
(A) Top: Distinct algorithms to predict unstructured regions in the MeV N protein; candidate unstructured regions are color-coded. Bottom: Heat map of the quantitative average of all predictors used; numbers correspond to amino acid counts. (B) Phylogenetic tree of the N proteins of representatives of all five families of the mononegavirales. Candidate structurally disordered domains are highlighted in red, and known high-affinity binding sites for P-L are shown as black boxes. (C) Steady-state levels of N mutants generated through 4–amino acid linker-scanning mutagenesis. Whole-cell lysates (WCL) of cells transfected with N expression plasmids were gel-fractionated, and N proteins were detected using specific antibodies directed against a C-terminally inserted HA epitope. Cellular glyceraldehyde-3-phosphate dehydrogenase (GAPDH) was detected for loading control. IB, immunoblots. (D) Bioactivity of the linker scanning mutants, assessed in minireplicon assays (black curve) using a monocistronic MeV minigenome reporter. Values represent averages of four independent experiments ± SD. The gray curve shows average disorder propensity scores determined in (A). RLU, relative light units. (E) Minireplicon analysis of N mutants harboring insertions of an HA epitope tag at the specified residues in Ncore and Ntail. Averages of three independent experiments ± SD are shown. (F) Steady-state levels of the N mutants analyzed in (E). Immunoblots were generated and developed as in (C).
Fig. 2
Fig. 2. Structural models of standard MeV N and N featuring MoRE relocated into Ncore.
MoRE is shown as red cylinder or ribbon, respectively. (A and B) Side view of monomers of MeV N (A) [Protein Data Bank (PDB) ID: 4UFT] and MeV Ncore-MoRE (B) showing the predicted positions of MoRE in red. Residues shown in orange are predicted to be disordered in native MeV N. Compared to its position in a fully extended Ntail, relocation shifts MoRE approximately 75 Å toward Ncore. (C and D) Top views of a single rung of the helical MeV N:RNA assemblies featuring standard N (C) and Ncore-MoRE (D). N protomers are colored, alternating in green and slate; RNA is shown in yellow. Dashed lines represent fully extended Ntails, shown in straight radial extension from the helix. (E and F) Side views of internal sections of assembled N:RNA helices featuring standard N and Ncore-MoRE, as shown in (C) and (D), respectively. All images were rendered with MacPyMOL.
Fig. 3
Fig. 3. Activity characterization of transiently expressed MeV N mutants.
(A) Schematic of the MeV N protein domain organization. Conserved boxes 1 to 3 in Ntail (B1 to B3) are highlighted, and the position of MoRE inserted into Ncore (red box) is indicated. Numbers represent amino acid positions. (B) Steady-state levels of transiently expressed MeV N mutants schematically shown in (A). Immunoblots were prepared and analyzed as in Fig. 1C. (C) Minireplicon analysis of the MeV N mutants depicted in (A) using a monocistronic firefly luciferase minigenome reporter schematically shown in (D). Values represent averages of at least three independent experiments, determined in nonuplets each ± SEM. Experimental variation was assessed through one-way analysis of variance (ANOVA) combined with Sidak’s multiple comparison post test (*P < 0.05; **P < 0.01; ***P < 0.001; NS, not significant). (D) Schematics of the bi- and tricistronic minigenome plasmids generated (firefly, firefly luciferase; nanoLuc, nanoluciferase; IGS, intergenic segment; Le, leader sequence; Tr, trailer sequence; P_stopstop, MeV P protein–encoding ORF harboring a tandem stop codon after the 21st triplet). (E) qRT-PCR–based comparison of transcription gradients experienced with polycistronic minireplicons versus virus infection. qRT-PCR analysis of the RNA panel shown in (C) to determine the ratios of N- and L-encoding mRNAs. Values represent the percentage of downstream ORF mRNA relative to upstream ORF mRNA in each sample (recMeV infection upstream ORF, N mRNA; downstream ORF, P mRNA; minireplicons upstream ORF, firefly luciferase mRNA; downstream ORF, nanoluciferase mRNA). Averages ± SEM of three independent experiments are shown, analyzed in duplicate each. Experimental variations were assessed through one-way ANOVAs combined with Sidak’s multiple comparison post tests. (F and G) Assessment of the relative efficiency with which the downstream reporter ORF was transcribed in the presence of the different N mutants using the bicistronic (F) and tricistronic (G) minigenomes shown in (D). Relative reporter expression ratios represent averages of at least five independent experiments, determined in nonuplets each ± SEM. Experimental variation was assessed through one-way ANOVA combined with Sidak’s multiple comparison post test.
Fig. 4
Fig. 4. Interaction of transiently expressed N protein mutants with the MeV P protein.
(A to C) Coimmunoprecipitation analysis of standard MeV P protein (A) or C-terminal (B) and N-terminal (C) fragments of the MeV P protein only (PCT and PNT, respectively) with the different N constructs. Western blots (WB) of WCL and immunoprecipitation (IP) results are shown. Cellular GAPDH was detected as internal standard. Graphs depict densitometric quantitation of the relative coimmunoprecipitation efficiencies. Values represent averages of three independent experiments ± SD. Experimental variation was assessed through one-way ANOVA combined with Sidak’s multiple comparison post test (*P < 0.05; **P < 0.01; ***P < 0.001; NS, not significant; ND, not determined).
Fig. 5
Fig. 5. Growth profiles of recombinant MeV harboring N mutants with relocated MoRE.
(A) Recovery of recMeV strains with modified N proteins in exchange of standard N and expressing eGFP from an additional transcription unit. Fluorescence microphotographs show cells transfected with virus recovery plasmids (Original recovery), after the first passage of infectious centers (Passage 1 infection), and after infection with cell-associated virus stocks (Re-infection). Images of fluorescent syncytia show representative fields of view. All viruses were grown at physiological temperature, with the exception of recMeV-Ncore-MoRE-Δ86-B3, which was recovered and amplified at 32°C. Cells infected with this recombinant and incubated at 37°C are shown for comparison in the bottom-most panel. (B) Immunoblot analysis of WCL of cells infected with the specified recMeV strains. Cells infected with recMeV-Ncore-MoRE-Δ86-B3 were incubated at 32°C. (C and D) Growth curves of the viable recMeV mutant strains in comparison with standard recMeV. Cells were infected at a multiplicity of infection (MOI) of 0.01, followed by incubation at 37°C (C) or 32°C (D), respectively. Values show titers of cell-associated progeny virus particles and represent averages of three independent repeats ± SD. For regression modeling, Bindslev’s population growth four-parameter variable slope model was applied (PDTmax, maximal population doubling time; Titermax, titer corresponding to the top plateau of the regression models; values in parentheses specify 95% confidence intervals; * denotes nonoverlapping 95% confidence intervals relative to standard recMeV; NS, overlapping 95% confidence intervals; ND, not determined).
Fig. 6
Fig. 6. Functional characterization of RdRp activity of the recMeV mutants with modified N proteins.
(A) Next-generation sequencing analysis of P transcripts of the recMeV mutants and standard recMeV. All strains displayed identical ratios of P-, V-, and W-encoding mRNAs, indicating unchanged mRNA editing activity. Values represent a minimum of 27,469 reads each and are expressed as percentage of the differentially edited mRNAs relative to the total transcripts from the P ORF. (B) TaqMan-based quantitation of the N mRNA transcription rates in cells infected with standard recMeV or the specified mutant strains and incubated at 37°C. RNA extracts were normalized for 18S ribosomal RNA (rRNA), and N mRNA copy numbers are expressed relative to those present 1 hour after infection. The inset magnifies fold changes experienced in the initial 12-hour window after spin inoculation of cells. Values represent averages ± SEM of three independent experiments, analyzed in duplicate each. Shaded areas flanking the curves show 95% confidence intervals of the regression models. (C) TaqMan quantitation of MeV antigenome and N mRNA copy numbers in cells infected with standard recMeV or the specified mutant strains at 72 hours after infection. recMeV-Ncore-MoRE-Δ86-B3 was analyzed after incubation at both permissive and restrictive temperature. (D and E) qRT-PCR analyses of the RNA panel shown in (C) after first-strand synthesis using oligo(dT) primers to determine ratios of N- and L-encoding mRNAs (D), N- and P-encoding mRNAs (E), and the relative amount of intergenic sequence (IGS) containing polycistronic mRNAs relative to the IGS-preceding ORF (E). Values represent the percentage of L mRNA relative to N mRNA in each sample (D) or the percentage of the specified target mRNA relative to the specified reference mRNA (E). For (C) to (E), averages ± SEM of three independent experiments are shown, analyzed in duplicate each. Experimental variations were assessed through one-way ANOVAs combined with Sidak’s multiple comparison post tests (*P < 0.05; ***P < 0.001; NS, not significant).

Similar articles

Cited by

References

    1. R. A. Lamb, D. Kolakofsky, Paramyxoviridae: The viruses and their replication, in Fields Virology, D. M. Knipe, P. M. Howley, D. E. Griffin, R. A. Lamb, M. A. Martin, B. Roizman, S. E. Straus, Eds. (Lippincott Williams & Wilkins, ed. 4, 2001), pp. 1305–1340.
    1. G. Enders, in Medical Microbiology, S. Baron, Ed. (The University of Texas Medical Branch at Galveston, 1996). - PubMed
    1. Heggeness M. H., Scheid A., Choppin P. W., Conformation of the helical nucleocapsids of paramyxoviruses and vesicular stomatitis virus: Reversible coiling and uncoiling induced by changes in salt concentration. Proc. Natl. Acad. Sci. U.S.A. 77, 2631–2635 (1980). - PMC - PubMed
    1. Finch J. T., Gibbs A. J., Observations on the structure of the nucleocapsids of some paramyxoviruses. J. Gen. Virol. 6, 141–150 (1970). - PubMed
    1. Longhi S., Nucleocapsid structure and function. Curr. Top. Microbiol. Immunol. 329, 103–128 (2009). - PubMed

MeSH terms

LinkOut - more resources