. 2017 Jul 1;27(7):3806-3817.
doi: 10.1093/cercor/bhx027.

Global and Local Connectivity Differences Converge With Gene Expression in a Neurodevelopmental Disorder of Known Genetic Origin

Affiliations

Global and Local Connectivity Differences Converge With Gene Expression in a Neurodevelopmental Disorder of Known Genetic Origin

Joe Bathelt et al. Cereb Cortex. .

Abstract

Knowledge of genetic cause in neurodevelopmental disorders can highlight molecular and cellular processes critical for typical development. Furthermore, the relative homogeneity of neurodevelopmental disorders of known genetic origin allows the researcher to establish the subsequent neurobiological processes that mediate cognitive and behavioral outcomes. The current study investigated white matter structural connectivity in a group of individuals with intellectual disability due to mutations in ZDHHC9. In addition to shared cause of cognitive impairment, these individuals have a shared cognitive profile, involving oromotor control difficulties and expressive language impairment. Analysis of structural network properties using graph theory measures showed global reductions in mean clustering coefficient and efficiency in the ZDHHC9 group, with maximal differences in frontal and parietal areas. Regional variation in clustering coefficient across cortical regions in ZDHHC9 mutation cases was significantly associated with known pattern of expression of ZDHHC9 in the normal adult human brain. The results demonstrate that a mutation in a single gene impacts upon white matter organization across the whole-brain, but also shows regionally specific effects, according to variation in gene expression. Furthermore, these regionally specific patterns may link to specific developmental mechanisms, and correspond to specific cognitive deficits.

Keywords: atypical brain development; cognitive development; human genetics; structural connectome.


Conflict of interest statement

Conflict of Interest: None declared.

Figures

Figure 1
Figure 1
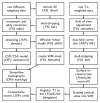
Overview of the processing steps to derive the diffusion-weighted structural connectome.
Figure 2
Figure 2
Illustration of the FA-weighted structural connectome in the ZDHHC9 and control group. The connection matrix was thresholded at a high cut-off at FA > 0.15 for illustration purposes.
Figure 3
Figure 3
Comparison of node strength between the ZDHHC9 and control group for left and right hemisphere connections, subcortical–cortical connections, and interhemisphere connections. The line indicates the median in each group. The error bars indicate the bootstrapped 95% confidence interval around the median. The area under the curve across thresholds was used for statistical comparison between the groups to avoid the potential biasing effects of an arbitrarily selected threshold (Wijk et al. 2010).
Figure 4
Figure 4
Comparison of global graph metrics between the ZDHHC9 (orange) and control group (blue) across a range of streamline thresholds for (a) mean node degree, (b) mean node strength, (c) clustering coefficient, and (d) global efficiency. The line indicates the median value for each group. The error bars indicate the bootstrapped 95% confidence interval around the median. Panels (c and d) solid lines show the result for the native networks and dashed lines show results for networks after group consensus thresholding.
Figure 5
Figure 5
Comparison between the ZDHHC9 and control group in node measures of (a) node degree, (b) node strength, (c) clustering coefficient, and (d) local efficiency. The maps show P-values of paired-sample t-tests corrected for multiple comparison using false discovery rate (FDR).
Figure 6
Figure 6
(a) Normalized expression of ZDHHC9 across the cortex (b) Relationship between average node clustering coefficient in the ZDHHC9 and control group and normalized regional expression of ZDHHC9. Regression analysis indicated a significant positive relationship between clustering coefficient and ZDHHC9 expression in the ZDHHC9 group (Bonferroni-corrected: P = 0.003), but not the control group (Bonferroni-corrected, P = 0.444)

References

    1. Alexander AL, Hurley SA, Samsonov AA, Adluru N, Hosseinbor AP, Mossahebi P, Tromp do PM, Zakszewski E, Field AS. Characterization of cerebral white matter properties using quantitative magnetic resonance imaging stains. Brain Connect. 2011;1(6):423–446. doi: 10.1089/brain.2011.0071. - DOI - PMC - PubMed
    1. Andersson JL, Sotiropoulos SN. An integrated approach to correction for off-resonance effects and subject movement in diffusion MR imaging. NeuroImage. 2016;125:1063–1078. doi: 10.1016/j.neuroimage.2015.10.019. - DOI - PMC - PubMed
    1. Avants BB, Tustison N, Song G. Advanced Normalization Tools (ANTS) Insight J. 2009 Retrieved from http://www.insight-journal.org/browse/publication/681.
    1. Baker K, Astle DE, Scerif G, Barnes J, Smith J, Moffat G, Raymond FL. Epilepsy cognitive deficits and neuroanatomy in males with ZDHHC9 mutations. Ann Clin Transl Neurol. 2015;2(5):559–569. doi: 10.1002/acn3.196. - DOI - PMC - PubMed
    1. Bathelt J, Astle D, Barnes J, Raymond FL, Baker K. Structural brain abnormalities in a single gene disorder associated with epilepsy, language impairment and intellectual disability. Neuroimage Clin. 2016 doi: 10.1016/j.nicl.2016.07.016. - DOI - PMC - PubMed

Publication types

MeSH terms