. 2017 Feb 7:7:41970.
doi: 10.1038/srep41970.

Visualization of tumor-related blood vessels in human breast by photoacoustic imaging system with a hemispherical detector array

Affiliations

Visualization of tumor-related blood vessels in human breast by photoacoustic imaging system with a hemispherical detector array

M Toi et al. Sci Rep. .

Abstract

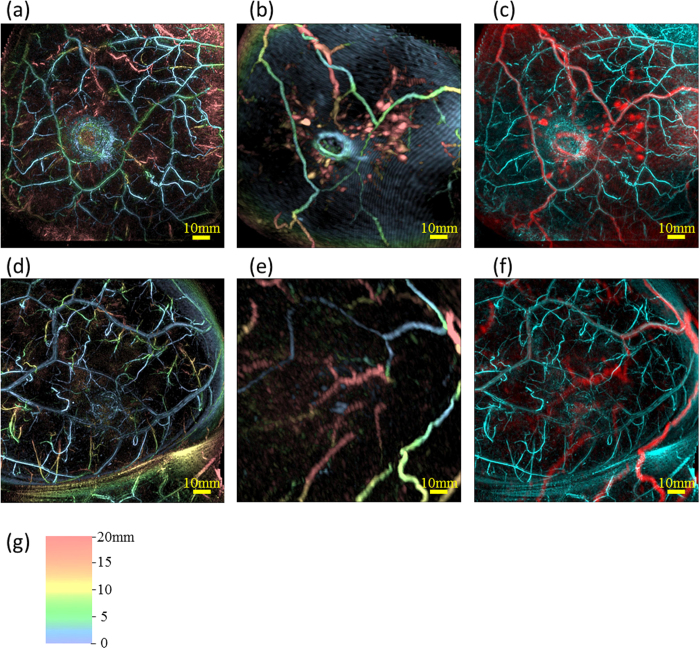
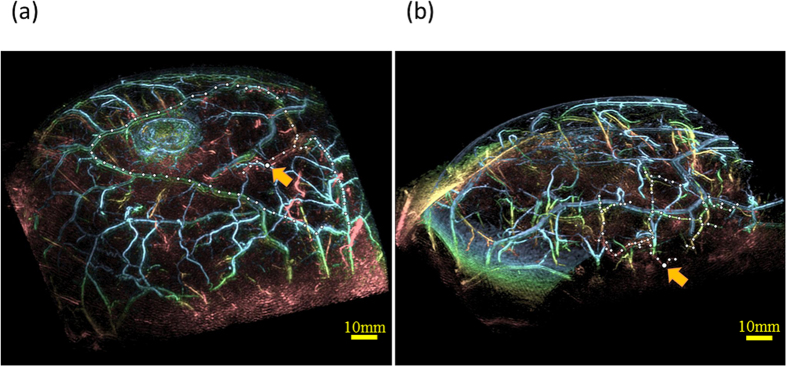
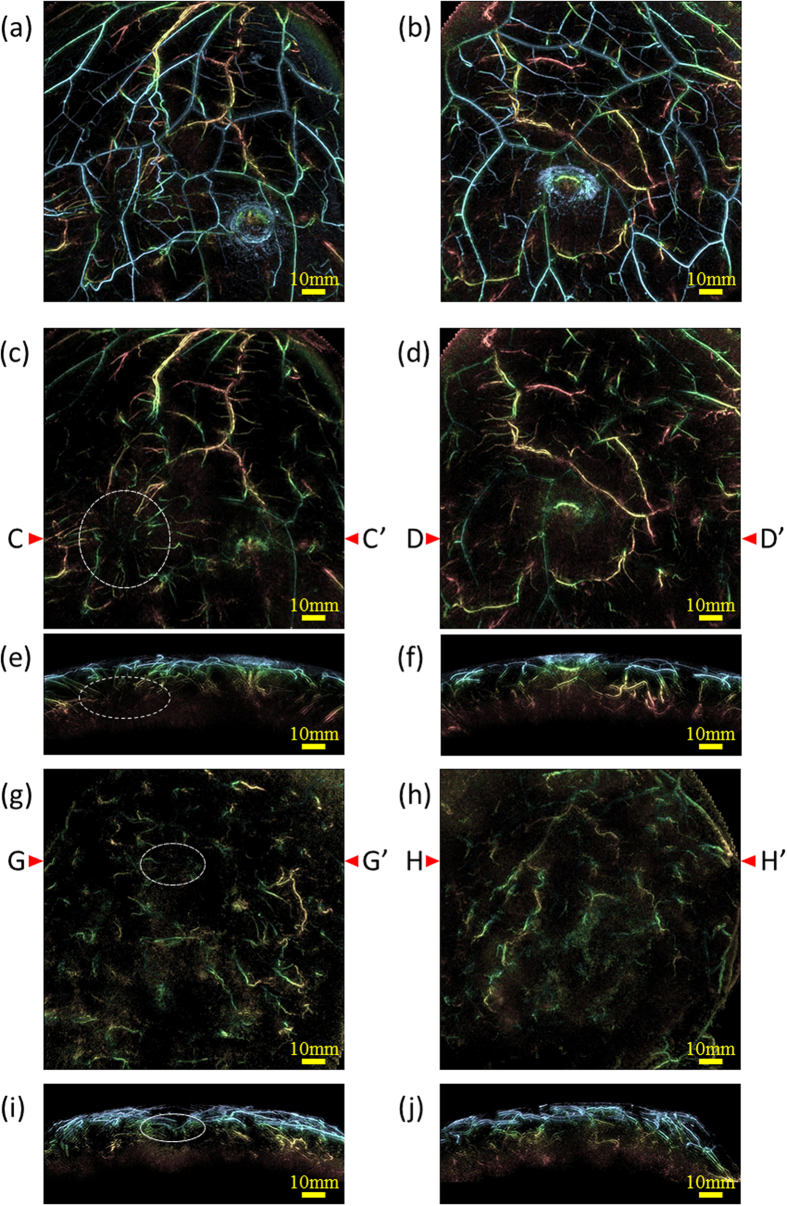
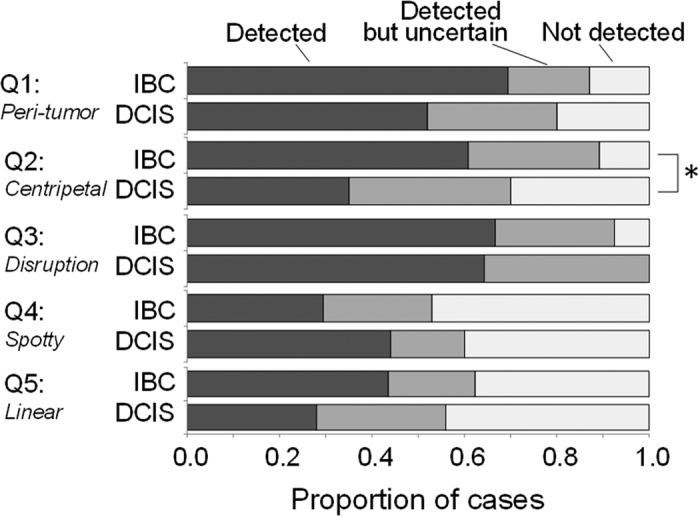
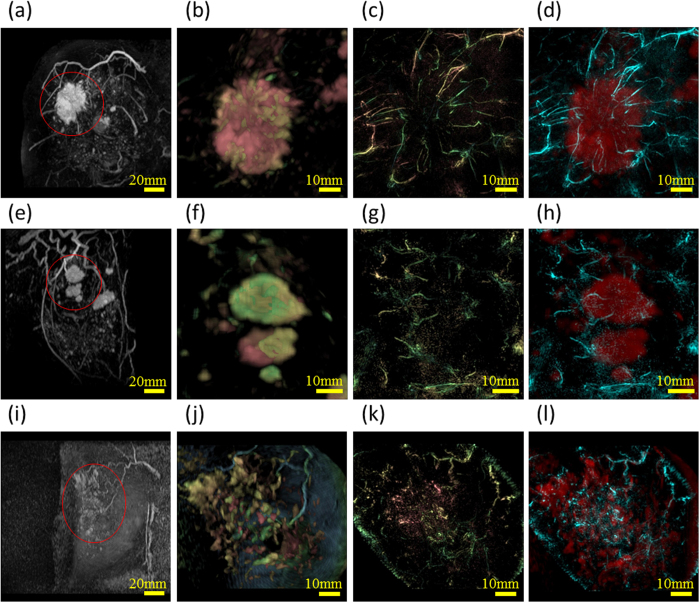
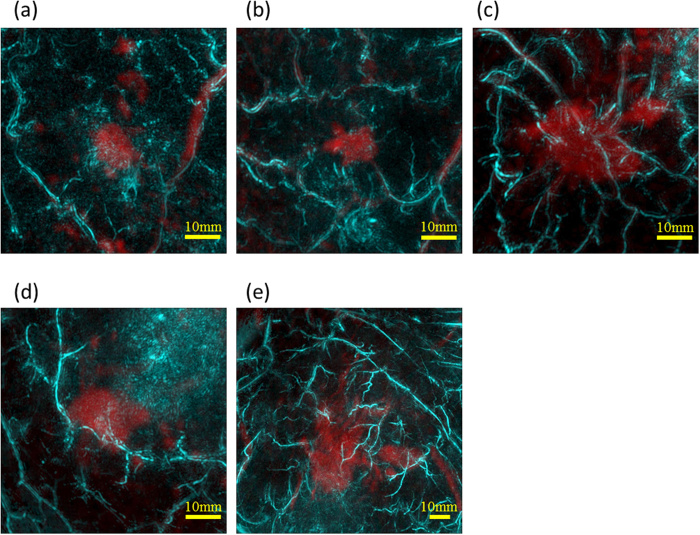
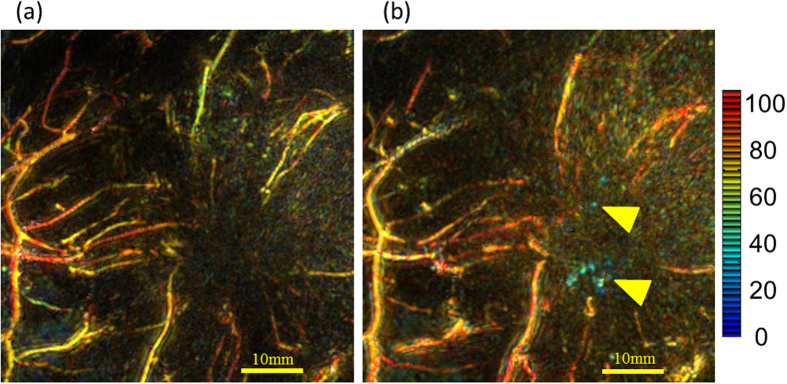
Noninvasive measurement of the distribution and oxygenation state of hemoglobin (Hb) inside the tissue is strongly required to analyze the tumor-associated vasculatures. We developed a photoacoustic imaging (PAI) system with a hemispherical-shaped detector array (HDA). Here, we show that PAI system with HDA revealed finer vasculature, more detailed blood-vessel branching structures, and more detailed morphological vessel characteristics compared with MRI by the use of breast shape deformation of MRI to PAI and their fused image. Morphologically abnormal peritumoral blood vessel features, including centripetal photoacoustic signals and disruption or narrowing of vessel signals, were observed and intratumoral signals were detected by PAI in breast cancer tissues as a result of the clinical study of 22 malignant cases. Interestingly, it was also possible to analyze anticancer treatment-driven changes in vascular morphological features and function, such as improvement of intratumoral blood perfusion and relevant changes in intravascular hemoglobin saturation of oxygen. This clinical study indicated that PAI appears to be a promising tool for noninvasive analysis of human blood vessels and may contribute to improve cancer diagnosis.


Conflict of interest statement

Yasufumi Asao, Takaaki Endo, and Takayuki Yagi are employees of Canon Inc., Japan. Canon Inc. designed and invented the photoacoustic mammography device used in this study. The other authors have no conflict of interest.

Figures

Figure 1
Figure 1. Examples of breast deformation of MRI and comparison of visibilities of blood vessels between PAI and MRI using maximum intensity projection (MIP) images on the healthy breast.
Case 1 (Fig. 1(a–c)): (a) PA image, (b) MR image deformed to correspond to the PA image, and (c) fusion image of PA (cyan) and MR (red). Case 2 (Fig. 1(d–f)): (d) PA image, (e) MR image deformed to correspond to the PA image, and (f) fusion image of PA (cyan) and MR (red). All images are coronal views. In Fig. 1(a), (b), (d) and (e), we colored the signals according to the depth using the color chart shown in Fig. 1(g). This color chart for depth information is also used in Figs 2, 4 and 5.
Figure 2
Figure 2. Examples of MIP images of the bird view illustrating depth performance.
The color of PA signal corresponded to the depth scaled by Fig. 1(g). The linear PA signal marked by white filled circles was considered to be the identical blood vessel judging from the continuity of the PA signal. Slightly bigger white filled circle indicated by the orange arrow was the deepest point from the skin surface in these circles. Estimated depths from skin were (a) 24 mm in Case 1 and (b) 27 mm in Case 2. (See Supplemental Multimedia Files).
Figure 3
Figure 3. Examples of MIP images of PAI for comparison of amounts of blood vessels between the affected side and the contralateral side.
The color of PA signal corresponded to the depth scaled by Fig. 1(g). Case 3 (Fig. 3(a–f)): A 40-year-old woman with IBC in upper-outer area of right breast. The tumor was 47 mm in diameter. (a) MIP image of the affected side and (b) MIP image of the contralateral side. Significant difference of blood vessel amounts was hardly seen between (a) and (b) due to many signals in both pictures. MIP image of (c) the affected side and (d) the contralateral side after eliminating the PA signals from subcutaneous blood vessels by a depth of 4 mm. The position of the tumor was indicated by a white dashed circle. Specific structure of blood vessels could be seen around the tumor in (c), whereas not in (d). Tumor-related blood vessels were made more visible by eliminating subcutaneous signals in coronal view. (e) and 3 (f) are slab MIP images observed from the Axial plane of (c) and (d). The section line was set on C - C’ corresponding to the tumor position and on D - D’ on the contralateral side. The width of each slab was set to 38 mm around the cross section line. Case 4 (Fig. 3(g–j)): A 44-year-old woman with multiple IBCs in upper area in left breast. MIP image of (g) the affected side and (h) the contralateral side after eliminating the PA signals from subcutaneous blood vessels by a depth of 4 mm. The position of the tumor was indicated by a white dashed-dotted circle. More signals were seen in the affected side than the contralateral side and centripetal blood vessel toward the tumor could be seen in (g). (i) and (j) are slab MIP images of the axial views of (g) and (h), of which the cross-section line was G-G’ and H-H’, respectively. The width of each slab was set to 38 mm around the cross section line.
Figure 4
Figure 4. Comparison of clinical findings between IBC and DCIS cases.
The following five questions (Q) were assessed. Q1: Are peritumoral PA vasculature signals present? Q2: Is there centripetal vasculature directed toward the tumor? Q3: Is vessel disruption or rapid narrowing present at the boundary of the tumor? Q4: Is a spotty signal present inside the tumor? Q5: Is a vascular-like linear signal present inside the tumor? A statistically significant difference between DCIS and IBC was denoted by an asterisk.
Figure 5
Figure 5. Examples of peritumoral images from three cases.
Figures of the first column from the left are the original MR images. Each lesion is indicated by a red circle. Those of the second column are the enlarged MR images around the lesion after deforming into the shape to PA images. The third and the fourth are original PA images, and fusion images of PA (cyan) and MR (red), respectively. These figures are after eliminating the PA signals from subcutaneous blood vessels by a depth of 4 mm. Case 3 (a) –(d): A 40-year-old woman with IBC. The tumor is 47 mm in diameter. Tumor-related blood vessels seem to converge from the normal breast tissue toward the center of the tumor, becoming drastically narrower at the tumor edge and nearly vanishing near the center. Case 4 (e) – (h): A 44-year-old woman with multiple IBCs. Tumor-related blood vessels seem to converge toward the center of the tumor in several masses. Case 5 (i) – (l): A 46-year-old woman with DCIS in upper-outer area in right breast. Non-mass enhancement was seen by MRI almost in the center of the breast. Centripetal blood vessels are hardly evident around the tumor. Spotty signals are seen in the PAI.
Figure 6
Figure 6. The other examples of peritumoral images from five cases.
All figures are fusion images of PA (cyan) and MR (red). Case 6 (a): A 65-year-old woman with IBC in upper area of left breast. The tumor was 13 mm in diameter. Case 7 (b): A 82-year-old woman with IBC in upper area of left breast. The tumor was 14 mm in diameter. Case 8 (c): A 65-year-old woman with IBC in lower-outer area of right breast. The tumor was 28 mm in diameter. Case 9 (d): A 45-year-old woman with IBC in lower-inner area of left breast. The tumor was 13 mm in diameter. Case 6 (e): A 36-year-old woman with IBC in upper area of left breast. The tumor was 30 mm in diameter. The centripetal blood vessels were observed in all cases.
Figure 7
Figure 7. Enlarged images of the peritumoral region in Case 3 from Figure 5.
The image intensity represents the measured absorbance coefficient at 795 nm, which corresponds to the amount of Hb present. S-factor values corresponding to the SO2 value of Hb are indicated according to the color bar on the right; red indicates close to 100% Hb saturation, whereas blue indicates close to 0%. (a) Peritumoral S-factor image obtained by PAM-03 before chemotherapy and (b) after chemotherapy. The amount and intensity of intratumoral signal increased after chemotherapy, and the S-factor values were low, indicating hypoxia. Yellow arrows indicate hypoxic spotty signals in the tumor.

References

    1. Peter Carmeliet. Angiogenesis in life, disease and medicine. Nature 438, 932–936 (2005). - PubMed
    1. Benjamin J. Vakoc et al.. Three-dimensional microscopy of the tumor microenvironment in vivo using optical frequency domain imaging. Nat. Med. 15, 1219–1223 (2009). - PMC - PubMed
    1. Brian W. Pogue et al.. Implicit and explicit prior information in near-infrared spectral imaging: accuracy, quantification and diagnostic value. Phil. Trans. R. Soc. A. 369, 4531–4557 (2011). - PMC - PubMed
    1. Giovanna Quarto et al.. Estimate of tissue composition in malignant and benign breast lesions by time-domain optical mammography. Biomed. Opt. Express. 5, 3684–3688 (2014). - PMC - PubMed
    1. Ruixin Jiang et al.. Phase-contrast diffuse optical tomography for in vivo breast imaging: a two-step method. Appl. Opt. 48, 4749–4755 (2009). - PubMed

Publication types

MeSH terms