. 2017 Feb 7:7:42248.
doi: 10.1038/srep42248.

RNA-Seq analysis of nodule development at five different developmental stages of soybean (Glycine max) inoculated with Bradyrhizobium japonicum strain 113-2

Affiliations

RNA-Seq analysis of nodule development at five different developmental stages of soybean (Glycine max) inoculated with Bradyrhizobium japonicum strain 113-2

Song L Yuan et al. Sci Rep. .

Abstract

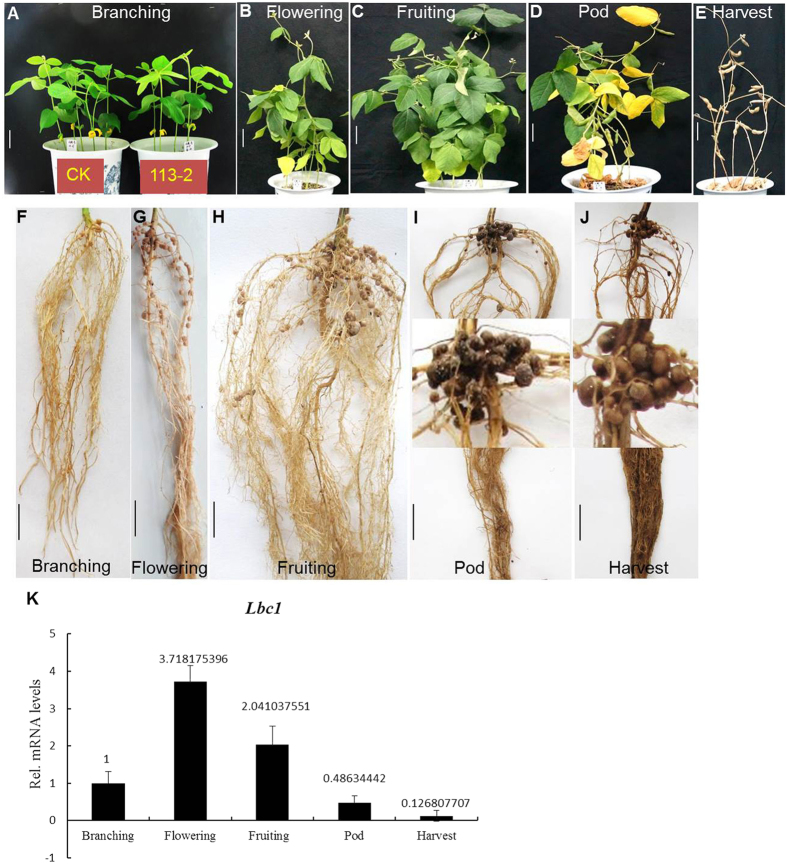
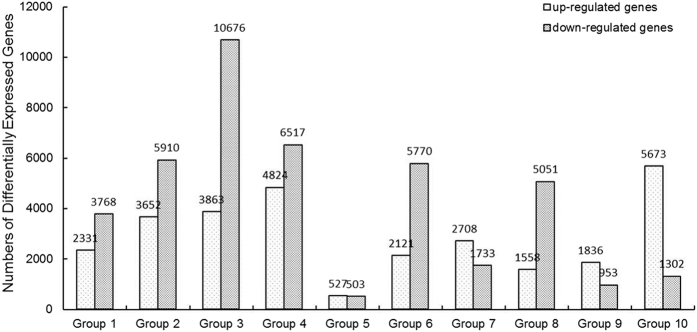
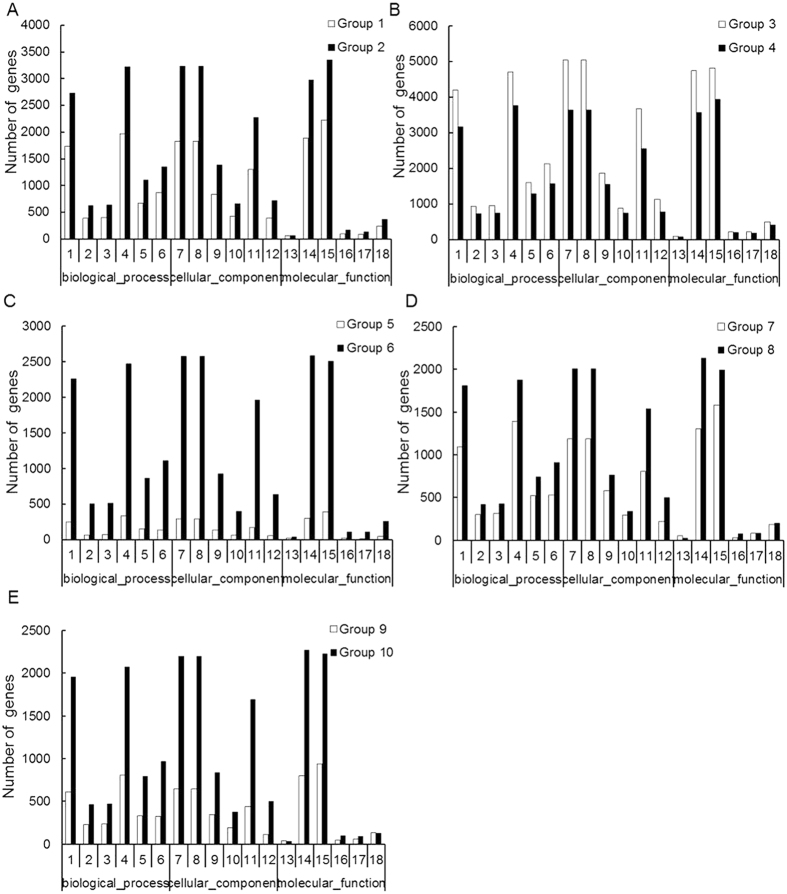
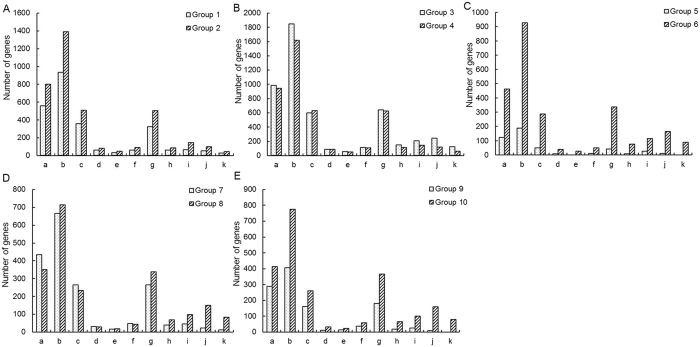
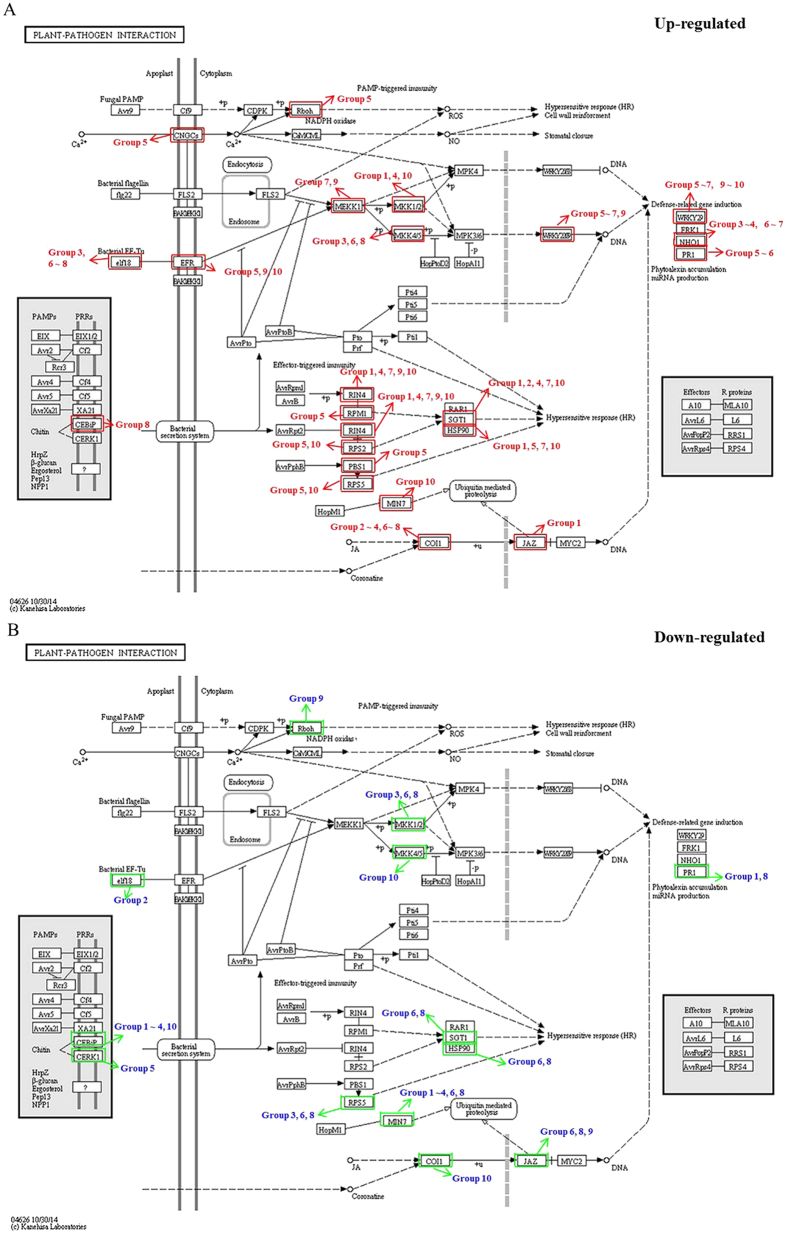
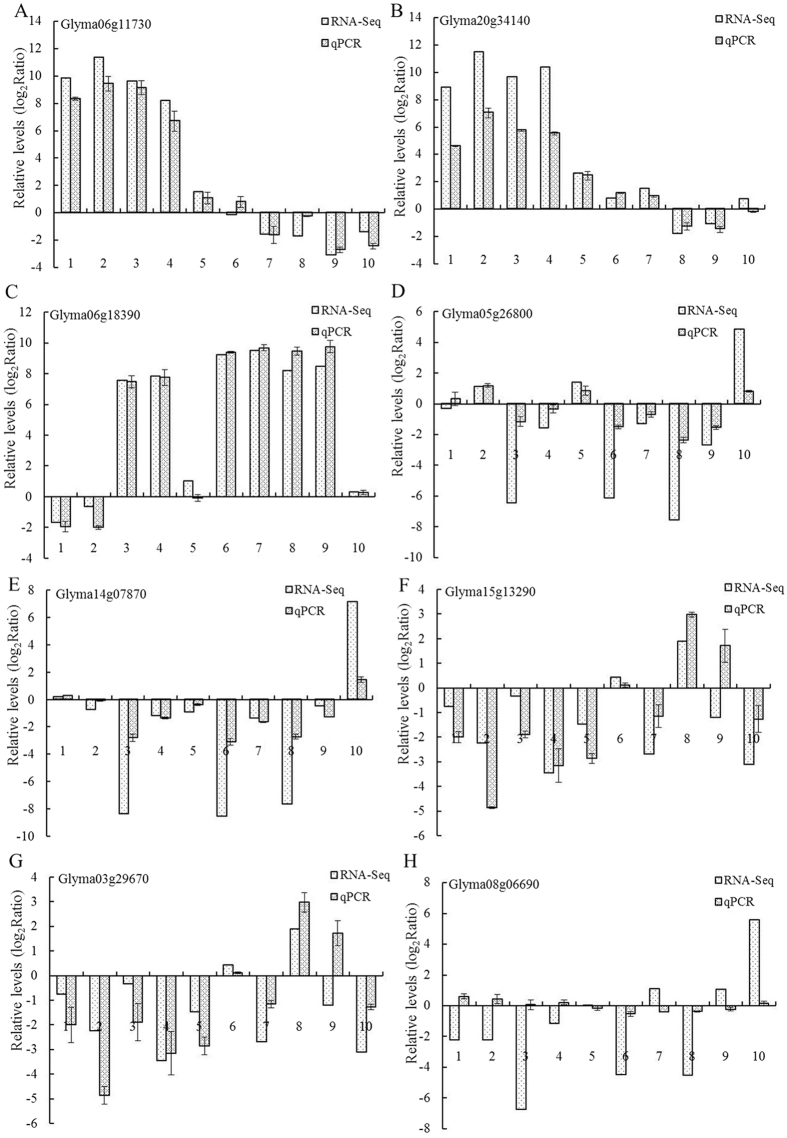
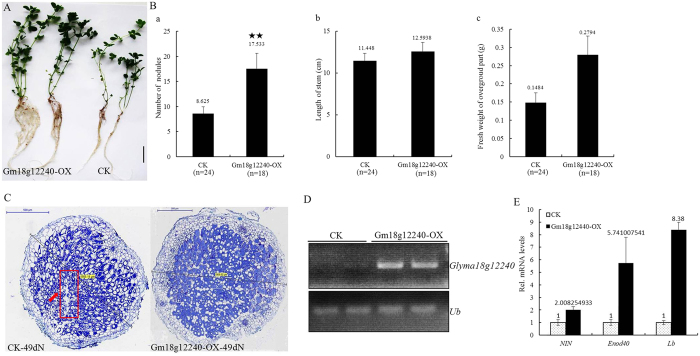
Nodule development directly affects nitrogen fixation efficiency during soybean growth. Although abundant genome-based information related to nodule development has been released and some studies have reported the molecular mechanisms that regulate nodule development, information on the way nodule genes operate in nodule development at different developmental stages of soybean is limited. In this report, notably different nodulation phenotypes in soybean roots inoculated with Bradyrhizobium japonicum strain 113-2 at five developmental stages (branching stage, flowering stage, fruiting stage, pod stage and harvest stage) were shown, and the expression of nodule genes at these five stages was assessed quantitatively using RNA-Seq. Ten comparisons were made between these developmental periods, and their differentially expressed genes were analysed. Some important genes were identified, primarily encoding symbiotic nitrogen fixation-related proteins, cysteine proteases, cystatins and cysteine-rich proteins, as well as proteins involving plant-pathogen interactions. There were no significant shifts in the distribution of most GO functional annotation terms and KEGG pathway enrichment terms between these five development stages. A cystatin Glyma18g12240 was firstly identified from our RNA-seq, and was likely to promote nodulation and delay nodule senescence. This study provides molecular material for further investigations into the mechanisms of nitrogen fixation at different soybean developmental stages.


Conflict of interest statement

The authors declare no competing financial interests.

Figures

Figure 1
Figure 1. Symbiotic phenotype features of five important soybean developmental stages.
(A–E) Soybean growth at five important developmental stages, including the branching stage, flowering stage, fruiting stage, pod stage and harvest stage. (F–J) Nodulation phenotypes were examined at five developmental stages after inoculation with 113-2. (K) qPCR analysis of the transcript levels of Lbc1 (Glyma10g34280) at five developmental stages. Bars, 4 cm (A,B); 5 cm (C–E); 3 cm (F–J). d, days.
Figure 2
Figure 2. Differentially expressed genes (DEGs) between different developmental periods of soybean.
Group 1: branching stage vs. flowering stage; Group 2: branching stage vs. fruiting stage; Group 3: branching stage vs. pod stage; Group 4: branching stage vs. harvest stage; Group 5: flowering stage vs. fruiting stage; Group 6: flowering stage vs. pod stage; Group 7: flowering stage vs. harvest stage; Group 8: fruiting stage vs. pod stage; Group 9: fruiting stage vs. harvest stage; Group 10: pod stage vs. harvest stage.
Figure 3
Figure 3. Gene Ontology - based functional annotation of DEGs between different developmental periods of soybean.
The three GO domains - biological process, cellular components, and molecular function - are shown. The numbers of genes in each term are shown in histograms. Eighteen GO function terms are indicated: 1, metabolic process; 2, cellular process; 3, response to stimulus; 4, single-organism process; 5, establishment of localization; 6, localization; 7, cell; 8, cell part; 9, membrane; 10, organelle; 11, membrane part; 12, organelle part; 13, catalytic activity; 14, binding; 15, transporter activity; 16, nucleic acid binding transcription factor activity; 17, molecular transducer activity; 18, antioxidant activity. (A) Group 1 (branching stage vs. flowering stage) and Group 2 (branching stage vs. fruiting stage). (B) Group 3 (branching stage vs. pod stage) and Group 4 (branching stage vs. harvest stage). (C) Group 5 (flowering stage vs. fruiting stage) and Group 6 (flowering stage vs. pod stage). (D) Group 7 (flowering stage vs. harvest stage) and Group 8 (fruiting stage vs. pod stage). (E) Group 9 (fruiting stage vs. harvest stage) and Group 10 (pod stage vs. harvest stage).
Figure 4
Figure 4. Results of KEGG pathway enrichment analyses of DEGs for 11 KEGG pathways.
The x- and y-axes represent pathway categories and the number of genes in each pathway, respectively. a, Biosynthesis of secondary metabolites; b, Metabolic pathways; c, Plant hormone signal transduction; d, Cysteine and methionine metabolism; e, Nitrogen metabolism; f, ABC transporters; g, Plant-pathogen interaction; h, Ubiquitin mediated proteolysis; i, Protein processing in endoplasmic reticulum; j, RNA transport; k, mRNA surveillance pathway. (A) Group 1 (branching stage vs. flowering stage) and Group 2 (branching stage vs. fruiting stage). (B) Group 3 (branching stage vs. pod stage) and Group 4 (branching stage vs. harvest stage). (C) Group 5 (flowering stage vs. fruiting stage) and Group 6 (flowering stage vs. pod stage). (D) Group 7 (flowering stage vs. harvest stage) and Group 8 (fruiting stage vs. pod stage). (E) Group 9 (fruiting stage vs. harvest stage) and Group 10 (pod stage vs. harvest stage).
Figure 5
Figure 5. DEGs associated with the plant-pathogen interaction pathways between different developmental periods of soybean.
(A) Up-regulated genes are boxed in red, and the red arrows point out the up-regulation of DEGs in Groups of nodule development. (B) Down-regulated genes are boxed in green, and the green arrows point out the down-regulation of DEGs in Groups. Group 1: branching stage vs. flowering stage; Group 2: branching stage vs. fruiting stage; Group 3: branching stage vs. pod stage; Group 4: branching stage vs. harvest stage; Group 5: flowering stage vs. fruiting stage; Group 6: flowering stage vs. pod stage; Group 7: flowering stage vs. harvest stage; Group 8: fruiting stage vs. pod stage; Group 9: fruiting stage vs. harvest stage; Group 10: pod stage vs. harvest stage.
Figure 6
Figure 6. Comparison of expression rates determined by RNA-Seq and qPCR on 8 genes in soybean nodules.
Three biological replica samples were used, and all qPCR reactions were repeated three times and the data are presented as the mean ± SD. (A) Glyma06g11730. (B) Glyma20g34140. (C) Glyma06g18390. (D) Glyma05g26800. (E) Glyma14g07870. (F) Glyma15g13290. (G) Glyma03g29670. (H) Glyma08g06690. QACT was the reference gene for these qPCR experiments.
Figure 7
Figure 7. Effect of Glyma18g12240 overexpression on symbiosis in L. japonicus.
(A) Symbiotic phenotypes of transgenic plants 49 days after inoculation with M. loti. MAFF303099. Hairy roots expressing vector pU1301 served as controls. Two independent transgenic plants were chosen for Photography. Bars = 5 mm. (B) Mean numbers of nodules per plant, lengths of stem per plant and fresh weights of the aboveground tissues per plant with a standard deviation (SD) of L. japonicus expressing pMUb: Glyma18g12240 (Gm18g12240-OX) or the empty vector pU1301 (CK) 49 days after inoculation with M. loti. The numbers of nodules in the scored plants is indicated in parentheses; “★★” indicates a significant difference between them. P-Values, 0.026 (a); 0.362 (b); 0.184 (c). (C) Paraffin-embedded slides stained with toluidine blue in the control and Gm18g12240-OX 49 day post-inoculation (dpi) nodules. The lengths of the two nodules were measured by Pannoramic viewer. The red box and the red arrow indicate a small senescent zone in the control 49 dpi nodules. (D) Semi-quantitative RT-PCR analysis of the transcript levels of Glyma18g12240 in the control and Gm18g12240-OX hairy roots. (E) qPCR analysis of the transcript levels of NIN, Enod40 and Lb in the control and Gm18g12240-OX hairy roots. Total RNA isolated from the root system was used for qPCR. Relative expression levels of NIN, Enod40 and Lb transcripts in Gm18g12240-OX hairy roots were calculated with reference to those of the control hairy roots.

Similar articles

Cited by

References

    1. Murray J. D. Invasion by invitation: rhizobial infection in legumes. Molecular plant-microbe interactions: MPMI 24, 631–639, doi: 10.1094/mpmi-08-10-0181 (2011). - DOI - PubMed
    1. Oldroyd G. E. Speak, friend, and enter: signalling systems that promote beneficial symbiotic associations in plants. Nature reviews. Microbiology 11, 252–263, doi: 10.1038/nrmicro2990 (2013). - DOI - PubMed
    1. Oldroyd G. E. & Downie J. A. Calcium, kinases and nodulation signalling in legumes. Nature reviews. Molecular cell biology 5, 566–576, doi: 10.1038/nrm1424 (2004). - DOI - PubMed
    1. Oldroyd G. E. & Downie J. A. Nuclear calcium changes at the core of symbiosis signalling. Current opinion in plant biology 9, 351–357, doi: 10.1016/j.pbi.2006.05.003 (2006). - DOI - PubMed
    1. Hayashi S. et al.. Transient Nod factor-dependent gene expression in the nodulation-competent zone of soybean (Glycine max [L.] Merr.) roots. Plant biotechnology journal 10, 995–1010, doi: 10.1111/j.1467-7652.2012.00729.x (2012). - DOI - PubMed

Publication types

MeSH terms

LinkOut - more resources