. 2017 Feb 7:8:14238.
doi: 10.1038/ncomms14238.

Clustering of 770,000 genomes reveals post-colonial population structure of North America

Affiliations

Clustering of 770,000 genomes reveals post-colonial population structure of North America

Eunjung Han et al. Nat Commun. .

Abstract

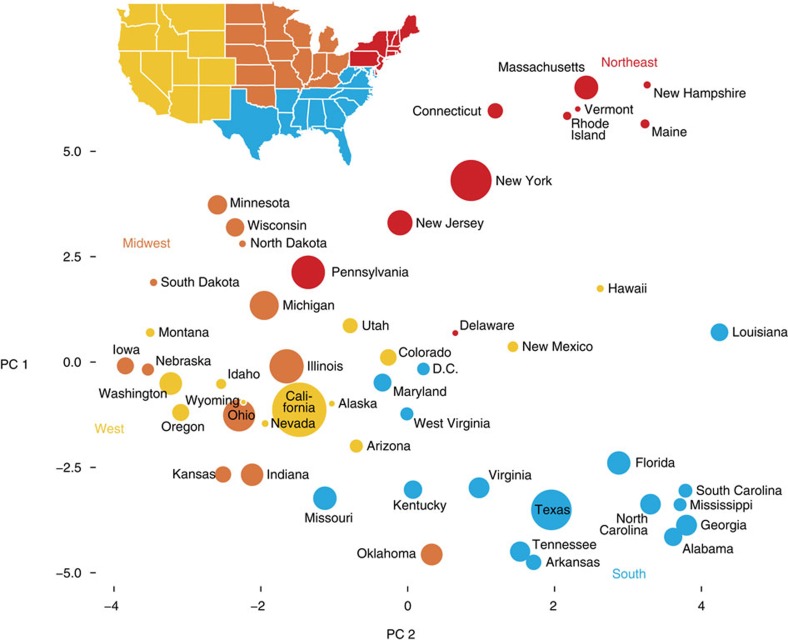
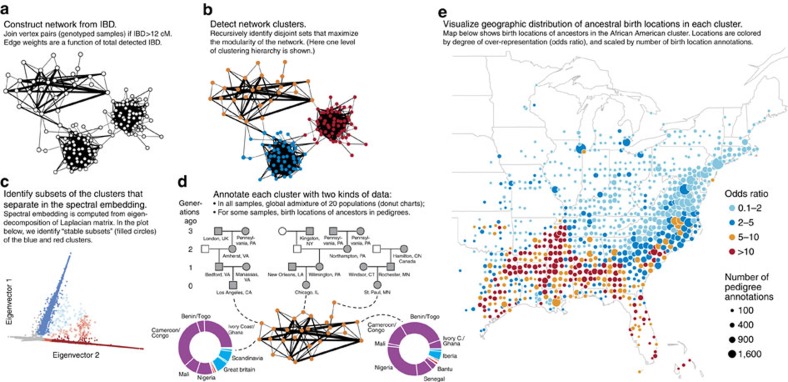
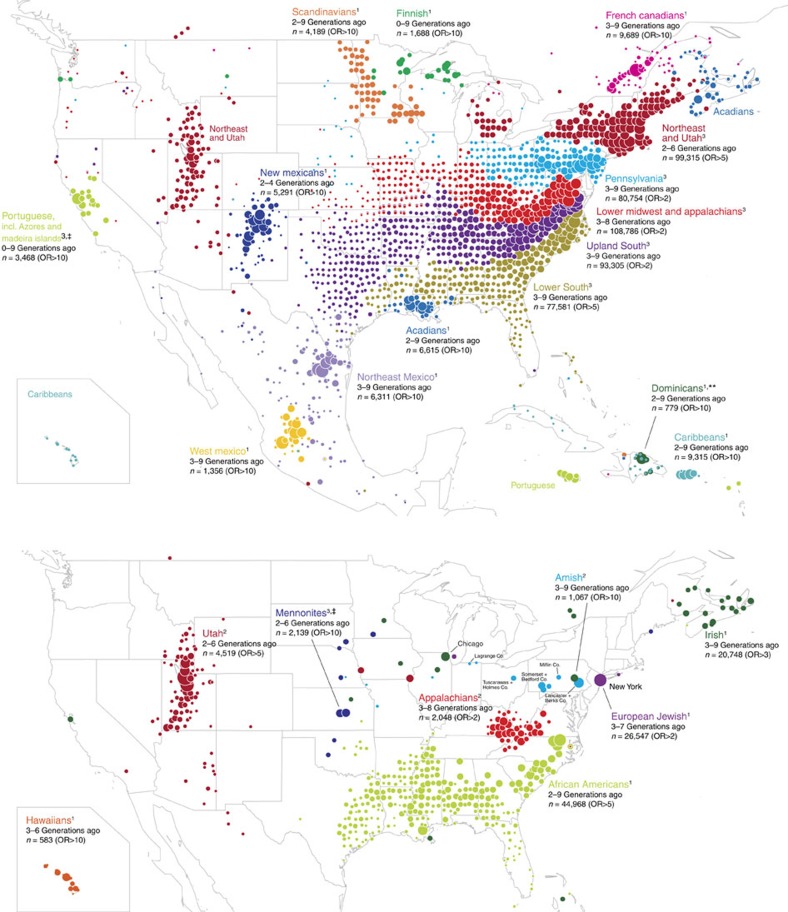
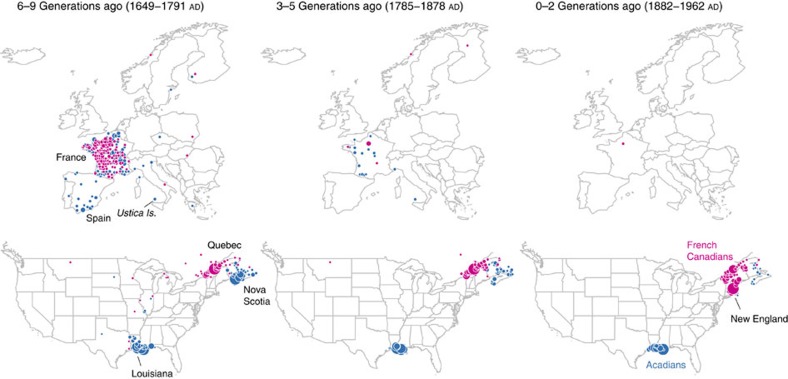
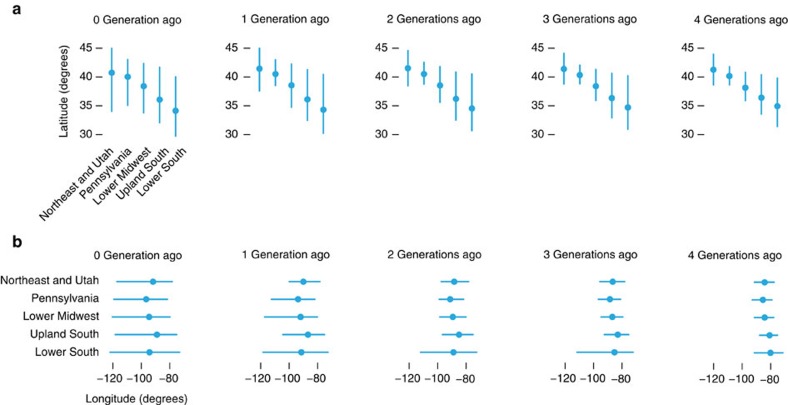
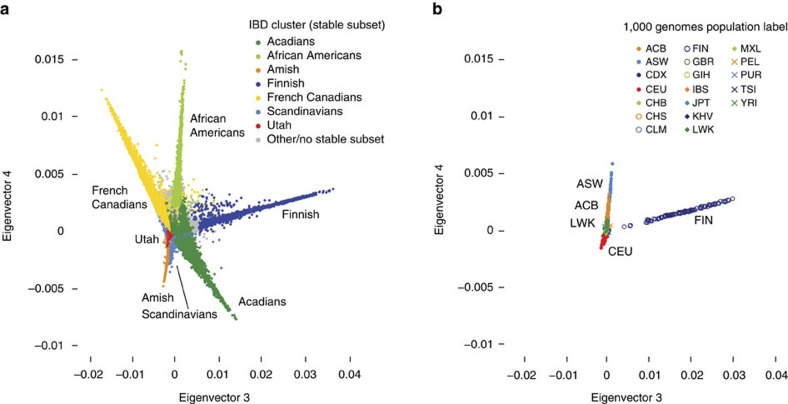
Despite strides in characterizing human history from genetic polymorphism data, progress in identifying genetic signatures of recent demography has been limited. Here we identify very recent fine-scale population structure in North America from a network of over 500 million genetic (identity-by-descent, IBD) connections among 770,000 genotyped individuals of US origin. We detect densely connected clusters within the network and annotate these clusters using a database of over 20 million genealogical records. Recent population patterns captured by IBD clustering include immigrants such as Scandinavians and French Canadians; groups with continental admixture such as Puerto Ricans; settlers such as the Amish and Appalachians who experienced geographic or cultural isolation; and broad historical trends, including reduced north-south gene flow. Our results yield a detailed historical portrait of North America after European settlement and support substantial genetic heterogeneity in the United States beyond that uncovered by previous studies.


Conflict of interest statement

The authors declare competing financial interests: authors affiliated with AncestryDNA may have equity in Ancestry; T.R. and S.S. were summer interns at Ancestry when they contributed to this work; E.B. received consultant fees from Ancestry; and a provisional patent application has been filed relating to this work (Application #15/168,011).

Figures

Figure 1
Figure 1. Two-dimensional projection of US states based on cross-state IBD.
Principal components (PCs) are computed using kernel PCA, in which the kernel matrix is defined by total IBD between pairs of states, normalized to remove the effect of variation in within-state IBD. US states that share high levels of IBD on average are placed closer to each other in the projection onto the first two principal components. The area of each circle is scaled by number of self-reported birth locations in the state (Supplementary Fig. 1). US states are coloured by geographic region (Northeast, South, Midwest and West). Maps were generated with the maps R package using data from the Natural Earth Project (1:50 m world map, version 2.0). These data are made available in the public domain (Creative Commons CC0).
Figure 2
Figure 2. Schematic of workflow for identification and interpretation of clusters.
Parts a–c summarize the identification of clusters: a constructing network from IBD, b detecting network clusters, and c identifying subsets of clusters that separate in the spectral embedding. Part d summarizes the interpretation of clusters by annotating clusters with admixture and genealogical data. Part e summarizes the genealogical data—birth location annotations in pedigrees (shaded symbols in d)—for the ‘African American' cluster. In e, each birth location in the pedigree (here, in generations 0–9, in which generation 0 is the genotyped individual) is converted to the nearest coordinate on a grid, with grid points every 0.5° of latitude and longitude. Point size is scaled by number of birth location annotations in the cluster at the given location, and coloured by odds ratio (OR): the proportion of ancestral birth locations linked to cluster members at that map location over the proportion linked to non-cluster members at the same location. Points on the map with higher odds ratios indicate geographic locations that are more associated with cluster membership. Maps were generated with the maps R package using data from the Natural Earth Project (1:50 m world map, version 2.0). These data are made available in the public domain (Creative Commons CC0).
Figure 3
Figure 3. Distribution of ancestral birth locations in North America associated with IBD clusters.
Points show pedigree birth locations that are disproportionately assigned to each cluster. Only birth locations with OR>x within indicated generations yz are plotted, in which parameters x, y, z are chosen separately per cluster to better visualize the cluster's historical geographic concentration; full distributions of ancestral birth locations in the United States, Europe and worldwide are given in Supplementary Figs. 18–20. For each cluster, points are independently scaled by the number of pedigree annotations. See Fig. 2 and Table 1 for more details. Note that clusters are separated into two maps only for clarity. Also note that the concentration of Puerto Rican ancestors in Hawaii probably reflects their arrival there in the early 1900s (ref. 64). Maps were generated with the maps R package using data from the Natural Earth Project (1:50 m world map, version 2.0). These data are made available in the public domain (Creative Commons CC0).
Figure 4
Figure 4. Genealogical data traces origins of Cajuns/Acadians in Atlantic Canada (blue) and migration of French Canadians (magenta) to the US.
Map locations are plotted if OR>10 within the indicated range of pedigree generations (date ranges give the 5th and 95th percentiles of birth year annotations). Points are scaled by number of pedigree annotations, separately for each of the six maps. Note that not all current political borders are shown. See Fig. 2 for more details. Maps were generated with the maps R package using data from the Natural Earth Project (1:50 m world map, version 2.0). These data are made available in the public domain (Creative Commons CC0).
Figure 5
Figure 5. Five largest clusters predict North-South US geography across multiple generations.
In a, each circle gives the mean latitude (in degrees) of all pedigree birth location annotations within a given generation linked to genotypes assigned to each of the five clusters; end points of vertical bars represent 10th and 90th empirical percentiles. These statistics are compiled from pedigree annotations with US birth locations only. Note that ‘0 generations ago' refers to genotyped individuals. For contrast, b shows the same statistics, but for longitude instead of latitude. Each degree of longitude or latitude is roughly equivalent to 100 km. Examples of US cities by latitude and longitude include Boston, MA (42.4, −71.1), New Orleans, LA (30.0, −90.1) and Sacramento, CA (38.6, −121.5).
Figure 6
Figure 6. Illustration of spectral analysis in AncestryDNA and 1000 Genomes samples.
(a) Projection of AncestryDNA genotype panel onto two dimensions of the IBD network spectral embedding. Inferred assignments to some stable subsets are shown. Note that some of the stable subsets shown here project away from the origin in other dimensions of spectral embedding, and are sometimes more distinguishable in those dimensions; see Supplementary Figs 4,5. (b) Projection of 1000 Genomes samples onto same two dimensions of spectral embedding. Projection is computed from IBD estimated between all pairs of AncestryDNA and 1000 Genomes samples. Samples in b are coloured according to the expert-provided population label. Population labels include ACB, African Caribbean in Barbados; ASW, people with African Ancestry in Southwest USA; CEU, Utah residents with Northern and Western European ancestry; FIN, Finnish in Finland; LWK, Luhya in Webuye, Kenya. See Supplementary Data 3 for interpretation of other population labels. Note that most samples are concentrated near the origin, which explains why most population labels are not visible in b.

Similar articles

Cited by

References

    1. Raghavan M. et al.. Genomic evidence for the Pleistocene and recent population history of Native Americans. Science 349, aab3884 (2015). - PMC - PubMed
    1. Skoglund P. et al.. Genetic evidence for two founding populations of the Americas. Nature 525, 104–108 (2015). - PMC - PubMed
    1. Baharian S. et al.. The Great Migration and African-American genomic diversity. PLoS Genet. 12, e1006059 (2016). - PMC - PubMed
    1. Bryc K., Durand E. Y., Macpherson J. M., Reich D. & Mountain J. L. The genetic ancestry of African Americans, Latinos, and European Americans across the United States. Am. J. Hum. Genet. 96, 37–53 (2015). - PMC - PubMed
    1. Bryc K. et al.. Genome-wide patterns of population structure and admixture in West Africans and African Americans. Proc. Natl Acad. Sci. USA 107, 786–791 (2010). - PMC - PubMed

Publication types