. 2017 Jan;6(1):293-305.
doi: 10.5966/sctm.2016-0081. Epub 2016 Aug 15.

Protein-Induced Pluripotent Stem Cells Ameliorate Cognitive Dysfunction and Reduce Aβ Deposition in a Mouse Model of Alzheimer's Disease

Affiliations

Protein-Induced Pluripotent Stem Cells Ameliorate Cognitive Dysfunction and Reduce Aβ Deposition in a Mouse Model of Alzheimer's Disease

Moon-Yong Cha et al. Stem Cells Transl Med. 2017 Jan.

Abstract

Transplantation of stem cells into the brain attenuates functional deficits in the central nervous system via cell replacement, the release of specific neurotransmitters, and the production of neurotrophic factors. To identify patient-specific and safe stem cells for treating Alzheimer's disease (AD), we generated induced pluripotent stem cells (iPSCs) derived from mouse skin fibroblasts by treating protein extracts of embryonic stem cells. These reprogrammed cells were pluripotent but nontumorigenic. Here, we report that protein-iPSCs differentiated into glial cells and decreased plaque depositions in the 5XFAD transgenic AD mouse model. We also found that transplanted protein-iPSCs mitigated the cognitive dysfunction observed in these mice. Proteomic analysis revealed that oligodendrocyte-related genes were upregulated in brains injected with protein-iPSCs, providing new insights into the potential function of protein-iPSCs. Taken together, our data indicate that protein-iPSCs might be a promising therapeutic approach for AD. Stem Cells Translational Medicine 2017;6:293-305.

Keywords: 5XFAD mice; Alzheimer's disease; Oligodendrocyte; Protein-iPSC; Proteomic analysis.


Figures

Figure 1
Figure 1
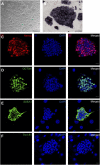
Characterization of mouse protein‐iPSCs. (A): Phase contrast morphology of protein‐induced pluripotent stem cell (iPSC) colonies. Scale bar = 500 μm. (B): Alkaline phosphatase staining of protein‐iPSC colonies. Scale bar = 200 μm. (C–F): Immunocytochemical staining shows that protein‐iPSCs express Nanog (C), Oct4 (D), SSEA1 (E), but not Tra1‐81 (F) (a known human embryonic stem cell marker). Scale bar = 20 μm. Abbreviations: DAPI, 4′,6‐diamidino‐2‐phenylindole; SSEA1, stage‐specific embryonic antigen 1.
Figure 2
Figure 2
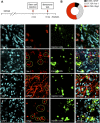
Protein‐induced pluripotent stem cells (iPSCs) differentiated into glial cells in the subiculum of 5XFAD mice. (A): Stereotaxic surgery was performed for injection of stem cells or saline. Two months after surgery, spatial learning and memory were assessed via Y‐maze and contextual fear conditioning test. Mice were sacrificed and brain sections analyzed by immunohistochemistry. (B): Confocal microscopy was used to investigate the fate of transplanted protein‐iPSCs, and quantitative analysis was performed. (C): Fluorescent nanoparticle‐tagged protein‐iPSCs were not colabeled with NeuN‐positive neurons but were found to surround other subiculum area. Scale bar = 10 μm. (D–F): Green fluorescent protein‐positive protein‐iPSCs colabeled with Iba‐1 (37.12%, D), GFAP (9.09%, E), and Olig2 (53.79%, F) (circles indicate colabeled cells). Scale bars = 10 μm. Abbreviations: DAPI, 4′,6‐diamidino‐2‐phenylindole; GFAP, glial fibrillary acidic protein.
Figure 3
Figure 3
Effect of transplanted stem cells to Alzheimer's disease pathology. (A): Coronal brain sections were stained with biotin‐4G8 antibody to detect Aβ deposition after saline or stem cell transplantation. Scale bars = 20 μm. (B): Bar graph shows quantification of 4G8‐positive area (n = 10 per group). ∗∗, p < .01; ∗∗∗, p < .001. (C): Levels of formic acid‐soluble Aβ 40 and Aβ 42 measured by using an enzyme‐linked immunosorbent assay kit for human‐specific Aβ level in brain homogenates from the protein‐iPSC‐injected 5XFAD mice versus the saline‐treated 5XFAD mice (n = 5 per group). ∗, p < .05; ∗∗, p < .01. (D, E): β‐secretase (D) and γ‐secretase (E) activities were measured by using an in vitro peptide cleavage assay (n = 5 per group). ∗, p < .05. (F): Representative images of NeuN‐positive neurons. Scale bar = 200 μm. (G): Bar graph shows quantification of NeuN‐positive cells (n = 10 per group). Error bars represent the mean ± SEM. ∗∗, p < .01. Abbreviations: ESC, embryonic stem cell; iPSC, induced pluripotent stem cell; LT, littermate; RFU, relative fluorescent unit.
Figure 4
Figure 4
Identification of differentially expressed proteins and integration of neural cell type specific genes. (A): Overview of global proteome analysis of subiculum tissues obtained 1 day and 2 months after vehicle and protein‐iPSC transplantation. (B): GOBPs and KEGG pathways represented by 1 day_DEPs, 2 month_DEPs, and 2 months/1 day_DEPs. For each GOBP or KEGG pathway, the table provides the enrichment p value and the number of DEPs (count) that belong to the GOBP or KEGG pathway. The GOBP or KEGG pathways significantly (p ≤ 0.1 and count ≤ 3) enriched by the DEPs in each condition are highlighted in background (red and green for the enrichment by up‐ and downregulated DEPs, respectively). (C): Bar graphs showing the significance of the overlapping DEPs with N‐, AS‐, and OD‐specific genes previously reported. The heights of each bar graph represent –log10(P), where the p value represents the significance of the overlaps between the DEPs and cell‐specific genes. The horizontal line indicates p = .05. (D): Heat map showing differential expression of the 20 DEPs with transcriptional regulation activities at 1 day and 2 months. Red and green represent up‐ and downregulation, respectively, in protein‐iPSC‐transplanted samples, compared with vehicle‐injected samples. The color bar shows the gradient of log‐two‐fold‐change between protein‐iPSC‐ and vehicle‐transplanted samples. The right heat map indicates whether each DEP belongs to the genes specific to N, AS, and OD. Abbreviations: AS, astrocyte; D, downregulated; DEP, differentially expressed proteins; FDR, false discovery rate; GOBP, gene ontology biological processes; iTRAQ, isobaric tags for relative and absolute quantitation; KEGG, Kyoto Encyclopedia of Genes and Genomes; N, neuron; OD, oligodendrocyte; U, upregulated.
Figure 5
Figure 5
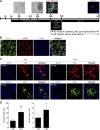
Transferrin promotes differentiation of protein‐induced pluripotent stem cells (iPSCs) into oligodendrocytes. (A): Timeline of differentiation of protein iPSCs into oligodendrocytes. Medium was replaced every other day. After day 22, transferrin was withdrawn from the medium until the end of differentiation. Phage‐contrast image: scale bar = 200 μm. Fluorescent image: scale bar = 20 μm. (B): Protein‐iPSC‐derived oligoprecursor cells were stained on day 22 with anti‐Nestin and anti‐A2B5. Nuclei were stained with DAPI. Scale bar = 20 μm. (C): Immunofluorescence images of differentiated oligodendrocytes in two different differentiation conditions. Oligodendrocytes differentiated in the absence of (−Trf) and in the presence of apotransferrin (+Trf). O4 was stained after 37 days of differentiation. Myelin basic protein‐positive cells were visualized by immunofluorescence staining 40 days after differentiation. Scale bar = 20 μm. (D): Quantification of the length and number of dendritic branches. ∗, p < .05; ∗∗∗, p < .001 (n = 8). Abbreviations: DAPI, 4′,6‐diamidino‐2‐phenylindole; MBP, myelin basic protein; PDGF, platelet‐derived growth factor; Trf, apotransferrin.
Figure 6
Figure 6
Stem cell transplantation improves cognitive impairment. (A): Cognitive function of the stem cell‐injected 5XFAD mice was assessed by using a Y‐maze task 2 months after surgery. The total number of arm entries did not differ between groups. In contrast, decreased spontaneous alteration was recovered in the stem cell‐injected 5XFAD mice compared with saline‐treated 5XFAD mice (n = 13 per group). ∗∗, p < .01 versus LT + sham; #, p < .05, ##, p < .01 versus Tg + Sham. (B): Cognitive function of the stem cell‐injected 5XFAD mice was assessed by using a contextual fear conditioning task 2 months after surgery (n = 13 per group). Error bars represent the mean ± SEM. ∗, p < .05 versus LT + sham. Error bars represent the mean ± SEM. Abbreviations: ESC, embryonic stem cell; iPSC, induced pluripotent stem cell; LT, littermate; n.s., not significant; Tg, transgenic mice.

References

    1. Huang Y, Mucke L. Alzheimer mechanisms and therapeutic strategies. Cell 2012;148:1204–1222. - PMC - PubMed
    1. Querfurth HW, LaFerla FM. Alzheimer's disease. N Engl J Med 2010;362:329–344. - PubMed
    1. Clarke JR, Lyra E Silva NM, Figueiredo CP et al. Alzheimer‐associated Aβ oligomers impact the central nervous system to induce peripheral metabolic deregulation. EMBO Mol Med 2015;7:190–210. - PMC - PubMed
    1. Citron M. Alzheimer's disease: Strategies for disease modification. Nat Rev Drug Discov 2010;9:387–398. - PubMed
    1. Benilova I, Karran E, De Strooper B. The toxic Aβ oligomer and Alzheimer's disease: An emperor in need of clothes. Nat Neurosci 2012;15:349–357. - PubMed

Publication types

MeSH terms