. 2017 Jan;6(1):316-329.
doi: 10.5966/sctm.2016-0087. Epub 2016 Aug 8.

Therapeutic Prospective of Infused Allogenic Cultured Mesenchymal Stem Cells in Traumatic Brain Injury Mice: A Longitudinal Proton Magnetic Resonance Spectroscopy Assessment

Affiliations

Therapeutic Prospective of Infused Allogenic Cultured Mesenchymal Stem Cells in Traumatic Brain Injury Mice: A Longitudinal Proton Magnetic Resonance Spectroscopy Assessment

Sushanta Kumar Mishra et al. Stem Cells Transl Med. 2017 Jan.

Abstract

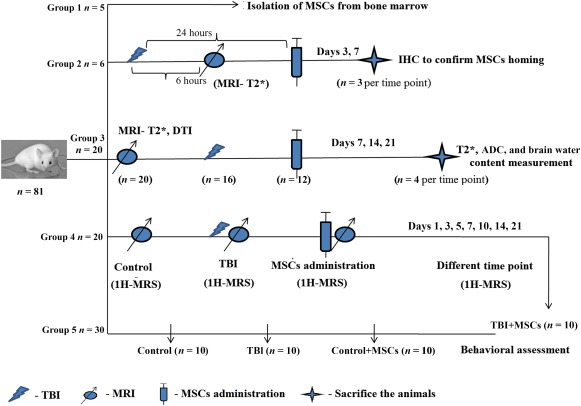
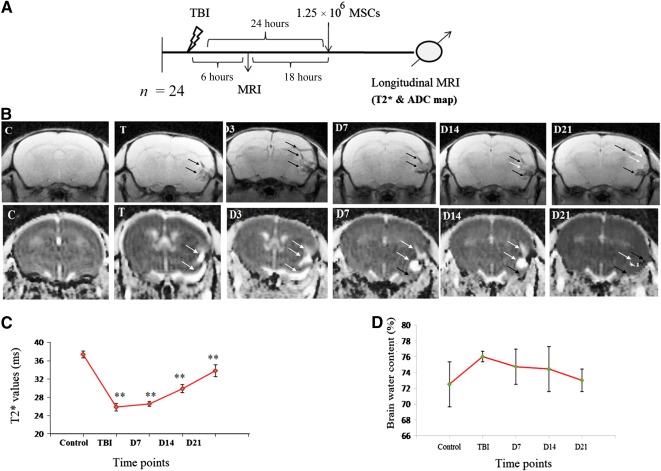
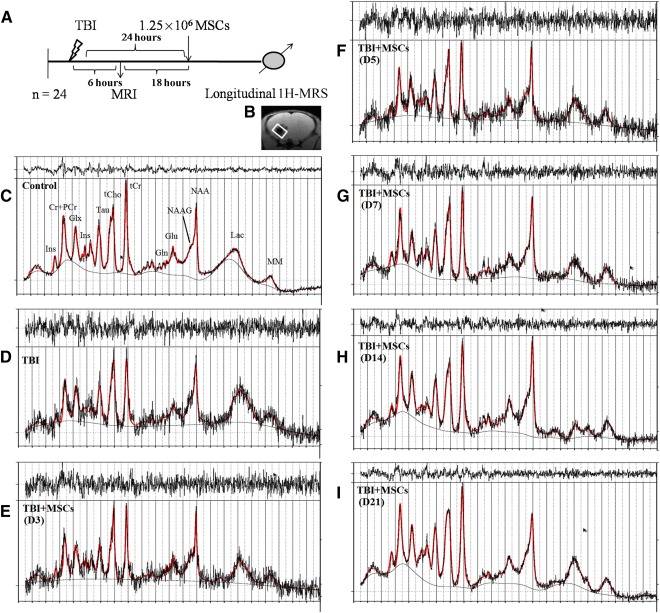
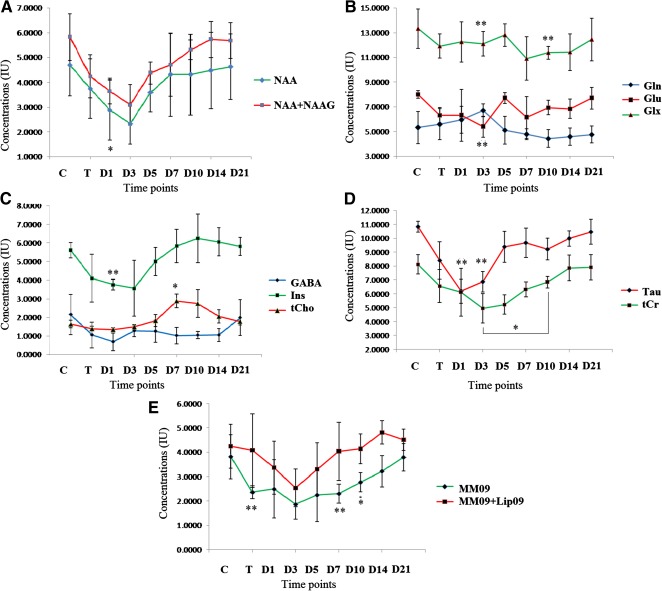
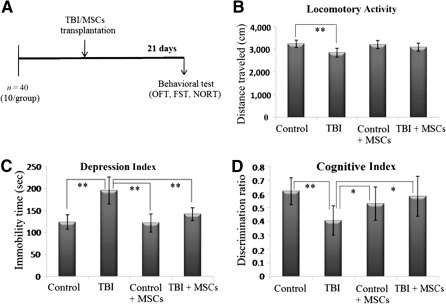
Improved therapeutic assessment of experimental traumatic brain injury (TBI), using mesenchymal stem cells (MSCs), would immensely benefit its therapeutic management. Neurometabolite patterns at injury site, measured with proton magnetic resonance spectroscopy (1H-MRS) after MSCs transplantation, may serve as a bio-indicator of the recovery mechanism. This study used in vivo magnetic resonance imaging and 1H-MRS to evaluate the therapeutic prospects of implanted MSCs at injury site in experimental mice longitudinally up to 21 days. Negative tissue contrast and cytotoxic edema formation were observed in susceptibility-based contrast (T2*) and an apparent diffusion coefficient map, respectively. Lesion site showed decreased N-acetylaspartate, total choline, myo-inositol, total creatine, glutamate-glutamine complex, and taurine neurometabolic concentrations by 1H-MRS investigation. There was a considerable decrease in locomotor activity, depression index, and cognitive index after TBI. It may, therefore, be inferred that MSC transplantation prompted recovery by decreasing negative signals and edema, restoring metabolites to baseline concentrations, and enhancing behavioral activity. Overall findings support the potential of MSC transplantation for the enhancement of endogenous neuroprotective responses, which may provide future clinical applications for translating laboratory research into therapeutic clinical advances. Stem Cells Translational Medicine 2017;6:316-329.

Keywords: Magnetic resonance imaging; Mesenchymal stem cells; Proton magnetic resonance spectroscopy; Stem cell therapy; Traumatic brain injury.


Figures

Figure 1
Figure 1
Schematic representation of mice distribution in different groups. Group 1 (5 mice) was used for isolation of stem cells from bone marrow; group 2 (6 mice) was utilized for IHC to confirm stem cell homing. Three mice were sacrificed on D3, and 3 on D7, after MSCs transplantation; group 3 (20 mice) was assigned for simultaneous MRI (T2* and ADC) and brain water content measurement at 5 time points (4 mice per time point); group 4 (20 mice) was investigated for longitudinal in vivo 1H‐MRS study in before injury, after injury, and at different time points after MSCs transplantation in the same mice. Ten mice from this group participated in the behavioral test after final 1H‐MRS study; group 5 (30 mice) was divided into 3 groups (control, injury, and stem cell‐transplanted control groups) to assess behavioral changes with the behavioral test. Abbreviations: ADC, apparent diffusion coefficient; D, day; IHC, immunohistochemistry; 1H‐MRS, proton magnetic resonance spectroscopy; MRI, magnetic resonance imagining; MSC, mesenchymal stem cell; TBI; traumatic brain injury.
Figure 2
Figure 2
Phenotypic and differential characterization study of mMSCs. Phenotypic surface antigens’ characterization of isolated mMSCs by immunocytochemistry: Sca1 (A), CD90.2 (B), CD34 (C), CD45(D), and CD11b (E). Blue fluorescent indicated Hoechst 33342 staining of nucleus, and green fluorescent indicated FITC conjugated antibodies. Scale bar: 50 µm. Osteogenic and adipogenic differentiation of mMSCs after incubation for 21 days in induction media: control MSCs (F), appearance of lipid vacuoles (G), alizarin staining for osteogenesis (H), and Oil Red O staining for adipogenesis (I). Scale bar = 100 µm. Abbreviations: DAPI, 4′,6‐diamidino‐2‐phenylindole; FITC, fluorescent isothiocyanate; mMSC, mice mesenchymal stem cell.
Figure 3
Figure 3
Stem cells homing to the lesion site in a brain injury model. (A): Systematic presentation of TBI induction, MSC administration, and sacrifice of animals for IHC. The black rectangle in MRI represents the injury site where IHC was carried out. Fluorescent figure represents stem cells homing to the site of injury on D3 (B) and D7 (C). Red fluorescence indicates PKH26 membrane dye of administered MSCs, and blue fluorescence indicates nuclear staining dye Hoechst 33342. Scale bar = 100 µm. Abbreviations: D, day; IHC, immunohistochemistry; MRI, magnetic resonance imagining; MSC, mesenchymal stem cell; TBI, traumatic brain injury.
Figure 4
Figure 4
Infused MSCs increases the T2* time and decreases the edema formation at the injury site. (A): Schematic presentation of TBI induction, MSC transplantation and longitudinal MRI (T2* map) of animals at different time points. (B): Upper MRI images indicating T2* map of mouse brain at different time points using MGE_T2* sequence, and lower images indicating ADC map of mouse brain at different time points using DTI sequence, C, T, D3, D7, D14, and D21 indicated imaging after administration of MSCs in TBI mouse. (C): The graph presents measurement of T2* relaxation time after acquisition of T2* map at different time points. (D): Ex vivo measurement of total brain water content in different time points. White arrow indicates the appearance of edema (hyperintense signal), and black arrow indicates the injury area (hypointense signal) in T2* and ADC map. Data were expressed as mean ± SE of mean. The level of significance (∗, p ≤ .05, ∗∗, p ≤ .001) was shown by comparing with control using one‐way ANOVA‐Bonferroni post hoc tests. Abbreviations: ADC, apparent diffusion coefficient; ANOVA, analysis of variance; C, control; D, day; DTI, diffusion tensor imaging; MGE, multigradient echo; MRI, magnetic resonance imaging; MSC, mesenchymal stem cell; T, after TBI induction.
Figure 5
Figure 5
Spectra represents the neurometabolic alteration after injury and its restoration after MSC administration. (A): Schematic presentation of TBI induction, MSC transplantation, and acquisition of 1H‐MRS at injury area of animals at different time points. (B): A representation of voxel placement with volume of interest at injury site for acquisition of spectra from corresponding brain area. (C): Representative 1H‐MRS spectra acquired in control mouse. (D): Spectra acquired after TBI and after MSCs transplantation on D3 (E), D5 (F), D7 (G), D14 (H), and D21 (I), with respective neurochemical peaks. The solid red line is a fit to the spectra calculated by the LC model. Abbreviations: Cr, creatine; D, day; Gln, glutamine; Glu, glutamate; Glx, glutamine complex; 1H‐MRS, proton magnetic resonance spectroscopy; Ins, myo‐inositol; Lac, lactate; LC, linear combination; MM, macromolecules; MRI, magnetic resonance imaging; MSC, mesenchymal stem cell; NAA, N‐acetylaspartate; NAAG, N‐acetylaspartatyl glutamate; PCr, phosphocreatine; Tau, taurine; TBI, traumatic brain injury; tCho, total choline; tCr, total creatine.
Figure 6
Figure 6
Changes in selected neurochemicals measured with 1H‐MRS. The change of metabolic concentrations of different metabolites such as NAA and NAA + NAAG (A), Gln, Glu and Glx (B); GABA, Ins, and tCho (C); Tau and tCr (D); and MM09 and MM09 + Lip09 (E) were evaluated with respect to different time points. Most of the metabolites decreased in concentration after TBI, but the levels remained recovered and moved toward baseline after MSC transplantation. Concentrations were expressed in institutional units and represented as mean ± SE of mean. The level of significance (∗, p ≤ .05, ∗∗, p ≤ .001) was shown by comparing with control by repeated measures of one‐way ANOVA‐Bonferroni post hoc tests. Abbreviations: ANOVA, analysis of variance; Cr, creatine; D, day; GABA, γ‐aminobutyric acid; Gln, glutamine; Glu, glutamate; Glx, glutamine complex; 1H‐MRS, proton magnetic resonance spectroscopy; Ins, myo‐inositol; MSC, mesenchymal stem cell; NAA, N‐acetylaspartate; NAAG, N‐acetylaspartatyl glutamate; T, after TBI induction; TBI, traumatic brain injury; tCho, total choline; Tau, taurine.
Figure 7
Figure 7
Improved functional outcomes in injury mice after MSC infusion. (A): Schematic presentation of behavioral test (OFT, FST, and NORT) in different groups. Behavioral test such as locomotor activity (B), depression index (C), and cognitive index (D) were carried out in the control group, TBI group, MSC‐induced control group, and MSC‐induced TBI group. Data were expressed as mean ± SE of mean. The level of significance (∗, p ≤ .05, ∗∗, p ≤ .001) was shown by multiple comparison with one‐way ANOVA‐Bonferroni post hoc tests. Abbreviations: ANOVA, analysis of variance; FST, forced swim test; MSC, mesenchymal stem cell; NORT, novel object recognition test; OFT, open field test; TBI, traumatic brain injury.

References

    1. Albert‐Weissenberger C, Sirén AL. Experimental traumatic brain injury. Exp Transl Stroke Med 2010;2:16. - PMC - PubMed
    1. Chen S, Pickard JD, Harris NG. Time course of cellular pathology after controlled cortical impact injury. Exp Neurol 2003;182:87–102. - PubMed
    1. Loane DJ, Faden AI. Neuroprotection for traumatic brain injury: translational challenges and emerging therapeutic strategies. Trends Pharmacol Sci 2010;31:596–604. - PMC - PubMed
    1. Jain KK. Neuroprotection in traumatic brain injury. Drug Discov Today 2008;13:1082–1089. - PubMed
    1. Harting MT, Jimenez F, Xue H et al. Intravenous mesenchymal stem cell therapy for traumatic brain injury. J Neurosurg 2009;110:1189–1197. - PMC - PubMed

Publication types