. 2017 Feb 7;12(2):e0170622.
doi: 10.1371/journal.pone.0170622. eCollection 2017.

Longitudinal assessment of sputum microbiome by sequencing of the 16S rRNA gene in non-cystic fibrosis bronchiectasis patients

Affiliations

Longitudinal assessment of sputum microbiome by sequencing of the 16S rRNA gene in non-cystic fibrosis bronchiectasis patients

Michael J Cox et al. PLoS One. .

Abstract

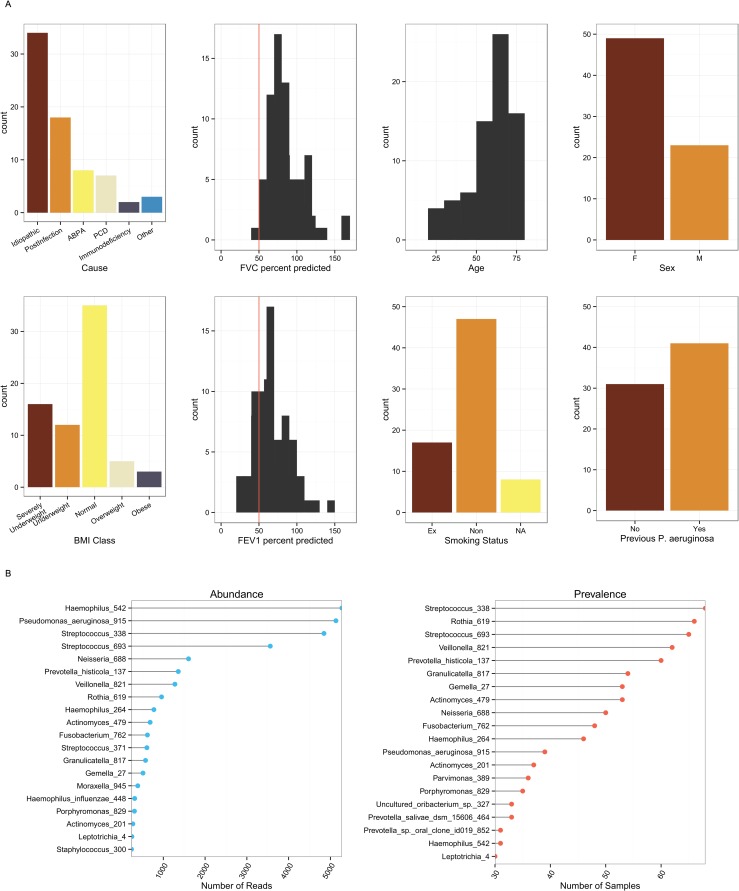
Background: Bronchiectasis is accompanied by chronic bronchial infection that may drive disease progression. However, the evidence base for antibiotic therapy is limited. DNA based methods offer better identification and quantification of microbial constituents of sputum than standard clinical culture and may help inform patient management strategies. Our study objective was to determine the longitudinal variability of the non-cystic fibrosis (CF) bronchiectasis microbiome in sputum with respect to clinical variables. Eighty-five patients with non-CF bronchiectasis and daily sputum production were recruited from outpatient clinics and followed for six months. Monthly sputum samples and clinical measurements were taken, together with additional samples during exacerbations. 16S rRNA gene sequencing of the sputum microbiota was successful for 381 samples from 76 patients and analysed in conjunction with clinical data.

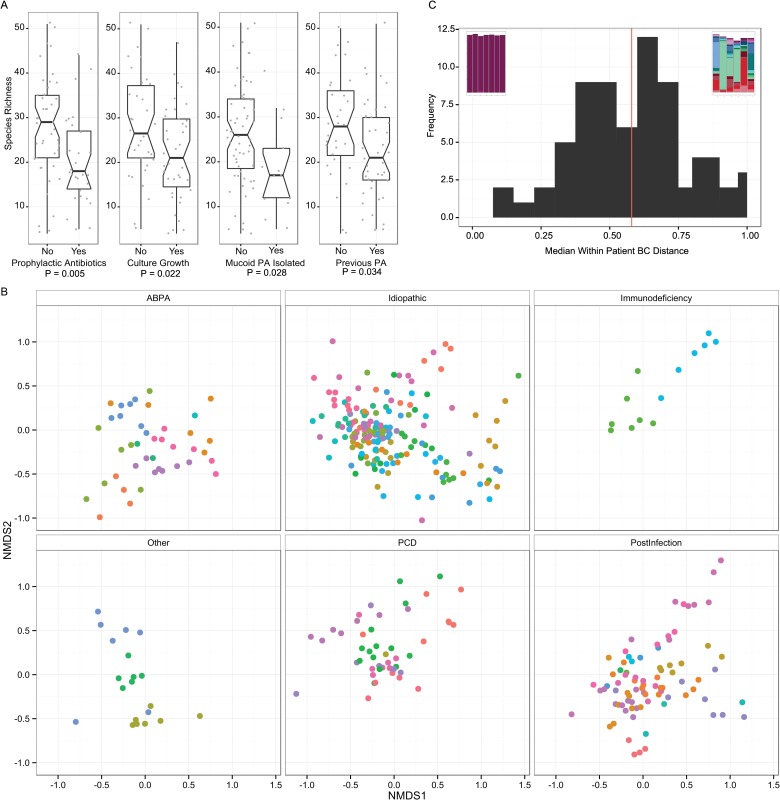
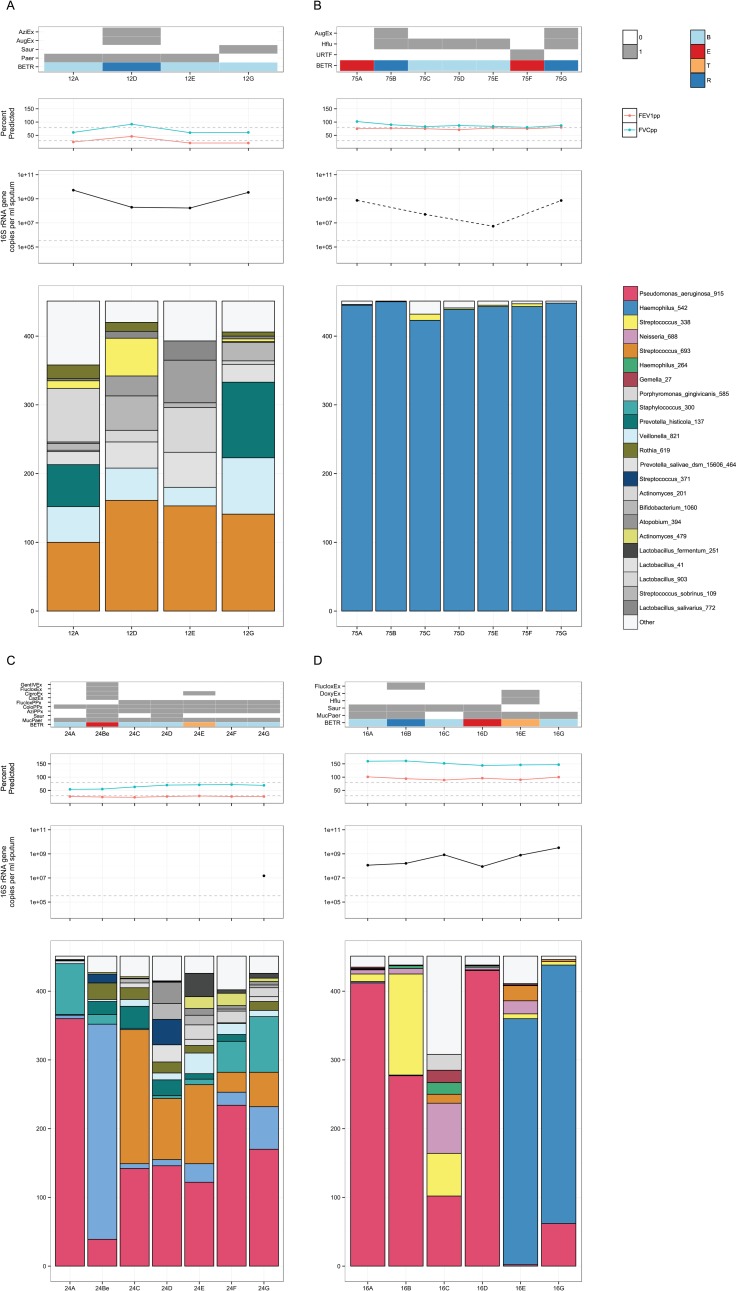
Results: Microbial communities were highly individual in composition and stability, usually with limited diversity and often containing multiple pathogens. When compared to DNA sequencing, microbial culture had restricted sensitivity in identifying common pathogens such as Pseudomonas aeruginosa, Haemophilus influenzae, Moraxella catarrhalis. With some exceptions, community characteristics showed poor correlations with clinical features including underlying disease, antibiotic use and exacerbations, with the subject showing the strongest association with community structure. When present, the pathogens mucoid Pseudomonas aeruginosa and Haemophilus influenzae may also shape the structure of the rest of the microbial community.

Conclusions: The use of microbial community analysis of sputum added to information from microbial culture. A simple model of exacerbations driven by bacterial overgrowth was not supported, suggesting a need for revision of principles for antibiotic therapy. In individual patients, the management of chronic bronchial infection may be improved by therapy specific to their microbiome, taking into account pathogen load, community stability, and acute and chronic community responses to antibiotics.


Conflict of interest statement

DB received a grant from Novartis UK for sequencing costs. The funder had no involvement in study design, collection or analysis of data, or in the decision to publish. This does not alter our adherence to PLOS ONE policies on sharing data and materials.

Figures

Fig 1
Fig 1
1A. Demographics of the non-CF bronchiectasis cohort. Indicating distribution of (from left to right, top to bottom): the cause of bronchiectasis; FVC percent predicted (red line indicates 50%); subject age; subject sex; BMI class; FEV1 percent predicted (red line indicates 50%); smoking status; and whether subject has previously cultured P. aeruginosa. 1B. Distribution of OTUs within the cohort. Abundance is the total number of reads assigned to an OTU from any sample. Prevalence is how often an OTU is detected in samples. Haemophilus_542 was most abundant, contributing 16% of all reads in the dataset. Streptococcus_338 was most prevalent and was found to some degree in every sample.
Fig 2
Fig 2
2A. Boxplots of species richness for cross-sectional baseline samples comparing clinical categories. Notches indicate 95% confidence interval. P values were calculated using Welch’s T test. 2B. Non-metric multi-dimensional scaling plot of Bray-Curtis dissimilarity. This ordination plot visually represents the Adonis results. The plot has been split by underlying cause of non-CF bronchiectasis to reduce over-plotting and to enable clearer visualisation of clustering of points, although each panel can be considered to be directly overlaid upon one another. Each point represents a sample and the larger the distance between points the larger the difference in community structure of those samples. Samples from the same patient have the same colour. Samples from the same patient tend to cluster together, illustrating the high individuality. There is some separation of points evident in the underlying diseases, e.g. Post-infectious samples tend to be present in the bottom right of the plot, PCD top right, ABPA central bottom and idiopathic more widely distributed. 2C. Histogram of the median per patient Bray Curtis dissimilarity. Bray Curtis dissimilarity was calculated for each patient with more than 3 samples and ranged from 0·12 to 0·98. The embedded stacked bar plots illustrate the patients at the two extremes, least diverse and most stable to most diverse and variable.
Fig 3
Fig 3. Selected subject plots.
Each subject is represented by four plots, from top to bottom: clinical variables including antibiotic treatment, growth of microorganisms on clinical culture and B,E,T,R category; Lung function as FEV1% predicted (red), FVC % predicted (green) with 30% and 80% represented by the grey dotted line; bacterial load as measured by 16S rRNA gene qPCR in copies per ml of sputum with the detection limit of the assay indicated by the grey dotted line; stacked barplots of the OTUs present in each sample. Colour coding for top 26 OTUs consistent between plots, with greyscale used for the remaining OTUs. Rare OTUs in each plot are summed as “Other”. 3A Subject 12: 68 yr old male with ABPA, normal BMI and 2 exacerbations during the study period. The patient had the highest median Bray-Curtis dissimilarity. Streptococcus_693 was the most abundant OTU in every sample (although not dominant) but other OTUs changed in relative abundance from sample to sample. Bacterial load changed substantially over the sampling period. 3B Subject 75: 64 yr old female, post-infectious, underweight and 2 exacerbations during the study period. The patient had the lowest median Bray-Curtis dissimilarity and most stable microbial community, dominated by Haemophilus_542, despite two clinical exacerbations and treatment with Augmentin. Bacterial load varied by two orders of magnitude from 107 to 109 copies per ml of sputum. 3C Subject 24: 60 yr old male, unknown bronchiectasis cause, normal body mass index (BMI) and 2 exacerbations during the study period. The patient did show changes in bacterial community that coincided with clinical states, such as an exacerbation at time point Be associated with a large increase in abundance of Stenotrophomonas_401. Antibiotic treatment resolved the exacerbation and Stenotrophomonas_401 proportions returned to lower levels. 3D Subject 16: 65 yr old male with ABPA, normal BMI and 2 exacerbations during the study period. The patient had an exacerbation at samples D and E, with Pseudomonas_aeruginosa_915 initially dominant being replaced by Haemophilus_542. The proportion of Haemophilus_542 and bacterial load in the samples increased, suggesting active growth of Haemophilus_542 that was supported by coincident clinical culture of H. influenzae.

References

    1. Seitz AE. Trends and Burden of Bronchiectasis-Associated Hospitalizations in the United States, 1993–2006. Chest. 2010. October 1;138(4):944 10.1378/chest.10-0099 - DOI - PMC - PubMed
    1. Pasteur MC, Bilton D, Hill AT, on behalf of the British Thoracic Society Bronchiectasis (non-CF) Guideline Group. British Thoracic Society guideline for non-CFbronchiectasis. Thorax. 2010. July 13;65(Suppl 1):i1–i58. - PubMed
    1. Huang YJ, Kim E, Cox MJ, Brodie EL, Brown R, Wiener-Kronish JP, et al. A persistent and diverse airway microbiota present during chronic obstructive pulmonary disease exacerbations. OMICS. 2010. February;14(1):9–59. 10.1089/omi.2009.0100 - DOI - PMC - PubMed
    1. Erb-Downward JR, Thompson DL, Han MK, Freeman CM, Mccloskey L, Schmidt LA, et al. Analysis of the Lung Microbiome in the “Healthy” Smoker and in COPD. PLoS ONE. 2011. February 22;6(2):e16384 10.1371/journal.pone.0016384 - DOI - PMC - PubMed
    1. Tunney MM, Klem ER, Fodor AA, Gilpin DF, Moriarty TF, McGrath SJ, et al. Use of culture and molecular analysis to determine the effect of antibiotic treatment on microbial community diversity and abundance during exacerbation in patients with cystic fibrosis. Thorax. 2011. June 15;66(7):579–84. 10.1136/thx.2010.137281 - DOI - PubMed

Substances