

Association of Sickle Cell Trait With Hemoglobin A1c in African Americans
- PMID: 28170479
- PMCID: PMC5713881
- DOI: 10.1001/jama.2016.21035
Association of Sickle Cell Trait With Hemoglobin A1c in African Americans
Abstract
Importance: Hemoglobin A1c (HbA1c) reflects past glucose concentrations, but this relationship may differ between those with sickle cell trait (SCT) and those without it.
Objective: To evaluate the association between SCT and HbA1c for given levels of fasting or 2-hour glucose levels among African Americans.
Design, setting, and participants: Retrospective cohort study using data collected from 7938 participants in 2 community-based cohorts, the Coronary Artery Risk Development in Young Adults (CARDIA) study and the Jackson Heart Study (JHS). From the CARDIA study, 2637 patients contributed a maximum of 2 visits (2005-2011); from the JHS, 5301 participants contributed a maximum of 3 visits (2000-2013). All visits were scheduled at approximately 5-year intervals. Participants without SCT data, those without any concurrent HbA1c and glucose measurements, and those with hemoglobin variants HbSS, HbCC, or HbAC were excluded. Analysis of the primary outcome was conducted using generalized estimating equations (GEE) to examine the association of SCT with HbA1c levels, controlling for fasting or 2-hour glucose measures.
Exposures: Presence of SCT.
Main outcomes and measures: Hemoglobin A1c stratified by the presence or absence of SCT was the primary outcome measure.
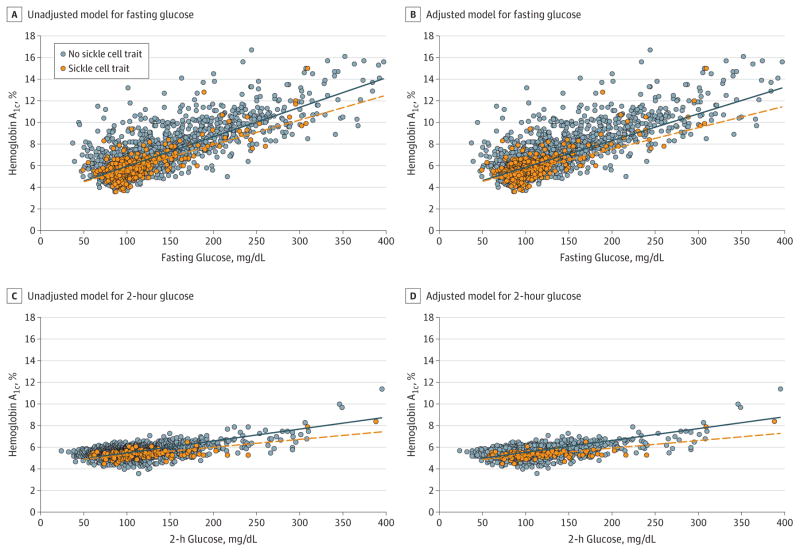
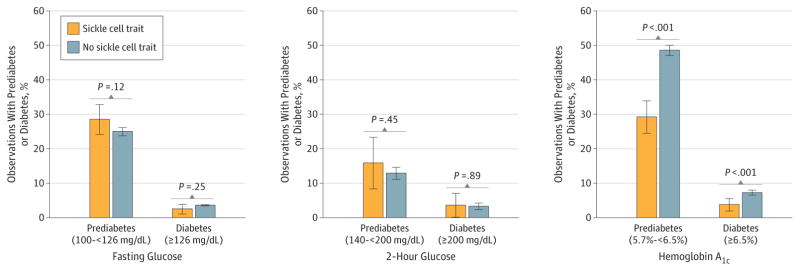
Results: The analytic sample included 4620 participants (mean age, 52.3 [SD, 11.8] years; 2835 women [61.3%]; 367 [7.9%] with SCT) with 9062 concurrent measures of fasting glucose and HbA1c levels. In unadjusted GEE analyses, for a given fasting glucose, HbA1c values were statistically significantly lower in those with (5.72%) vs those without (6.01%) SCT (mean HbA1c difference, -0.29%; 95% CI, -0.35% to -0.23%). Findings were similar in models adjusted for key risk factors and in analyses using 2001 concurrent measures of 2-hour glucose and HbA1c concentration for those with SCT (mean, 5.35%) vs those without SCT (mean, 5.65%) for a mean HbA1c difference of -0.30% (95% CI, -0.39% to -0.21%). The HbA1c difference by SCT was greater at higher fasting (P = .02 for interaction) and 2-hour (P = .03) glucose concentrations. The prevalence of prediabetes and diabetes was statistically significantly lower among participants with SCT when defined using HbA1c values (29.2% vs 48.6% for prediabetes and 3.8% vs 7.3% for diabetes in 572 observations from participants with SCT and 6877 observations from participants without SCT; P<.001 for both comparisons).
Conclusions and relevance: Among African Americans from 2 large, well-established cohorts, participants with SCT had lower levels of HbA1c at any given concentration of fasting or 2-hour glucose compared with participants without SCT. These findings suggest that HbA1c may systematically underestimate past glycemia in black patients with SCT and may require further evaluation.
Conflict of interest statement
Figures
Comment in
-
Sickle Cell Trait and Interpretation of Hemoglobin A1c Levels.JAMA. 2017 Feb 7;317(5):481-482. doi: 10.1001/jama.2016.20994. JAMA. 2017. PMID: 28170462 No abstract available.
-
Measurement of Hemoglobin A1c in Patients With Sickle Cell Trait.JAMA. 2017 Jun 6;317(21):2237. doi: 10.1001/jama.2017.4643. JAMA. 2017. PMID: 28586882 No abstract available.
References
-
- Selvin E, Crainiceanu CM, Brancati FL, Coresh J. Short-term variability in measures of glycemia and implications for the classification of diabetes. Arch Intern Med. 2007;167(14):1545–1551. - PubMed
Publication types
MeSH terms
Substances
Grants and funding
- K08 HL125100/HL/NHLBI NIH HHS/United States
- HHSN268201300026C/HL/NHLBI NIH HHS/United States
- R01 HL107816/HL/NHLBI NIH HHS/United States
- HHSN268201300025C/HL/NHLBI NIH HHS/United States
- HHSN268201300028C/HL/NHLBI NIH HHS/United States
- K01 DK095928/DK/NIDDK NIH HHS/United States
- HHSN268201300046C/HL/NHLBI NIH HHS/United States
- HHSN268201300029C/HL/NHLBI NIH HHS/United States
- F31 DK105791/DK/NIDDK NIH HHS/United States
- HHSN268201300048C/HL/NHLBI NIH HHS/United States
- HHSN268201300027C/HL/NHLBI NIH HHS/United States
- HHSN268201300049C/HL/NHLBI NIH HHS/United States
- HHSN268201300047C/HL/NHLBI NIH HHS/United States
- HHSN268201300050C/HL/NHLBI NIH HHS/United States
LinkOut - more resources
Full Text Sources
Other Literature Sources
Medical
Miscellaneous
