. 2016 Nov 15;25(22):4856-4869.
doi: 10.1093/hmg/ddw309.

Influence of prenatal EGCG treatment and Dyrk1a dosage reduction on craniofacial features associated with Down syndrome

Affiliations

Influence of prenatal EGCG treatment and Dyrk1a dosage reduction on craniofacial features associated with Down syndrome

Samantha D McElyea et al. Hum Mol Genet. .

Abstract

Trisomy 21 (Ts21) affects craniofacial precursors in individuals with Down syndrome (DS). The resultant craniofacial features in all individuals with Ts21 may significantly affect breathing, eating and speaking. Using mouse models of DS, we have traced the origin of DS-associated craniofacial abnormalities to deficiencies in neural crest cell (NCC) craniofacial precursors early in development. Hypothetically, three copies of Dyrk1a (dual-specificity tyrosine-(Y)-phosphorylation regulated kinase 1A), a trisomic gene found in most humans with DS and mouse models of DS, may significantly affect craniofacial structure. We hypothesized that we could improve DS-related craniofacial abnormalities in mouse models using a Dyrk1a inhibitor or by normalizing Dyrk1a gene dosage. In vitro and in vivo treatment with Epigallocatechin-3-gallate (EGCG), a Dyrk1a inhibitor, modulated trisomic NCC deficiencies at embryonic time points. Furthermore, prenatal EGCG treatment normalized some craniofacial phenotypes, including cranial vault in adult Ts65Dn mice. Normalization of Dyrk1a copy number in an otherwise trisomic Ts65Dn mice normalized many dimensions of the cranial vault, but did not correct all craniofacial anatomy. These data underscore the complexity of the gene–phenotype relationship in trisomy and suggest that changes in Dyrk1a expression play an important role in morphogenesis and growth of the cranial vault. These results suggest that a temporally specific prenatal therapy may be an effective way to ameliorate some craniofacial anatomical changes associated with DS.


Figures

Figure 1.
Figure 1.
Dysregulation of RNA expression from Hsa21 homologous genes found in three copies in Ts65Dn mice occurs in the PA1 and NT early in development. (A) Dyrk1a RNA expression was significantly downregulated in the E9.25 PA1 and NT of trisomic embryos, whereas Rcan1 RNA expression was significantly upregulated in both the E9.25 PA1 and NT in trisomic embryos (N = 5 euploid, 5 Ts65Dn PA1; 5 euploid, 5 Ts65Dn NT). (B) Conversely, Dyrk1a RNA expression was upregulated in the E9.5 PA1 and NT in trisomic embryos relative to euploid littermates, whereas Rcan1 RNA expression was downregulated in these tissues (N = 7 euploid, 7 Ts65Dn PA1; 5 euploid, 5 Ts65Dn NT). For statistical analysis, two-tailed Student’s t-tests were performed. Statistical significance is annotated as * for P ≤ 0.05. Error bars indicate standard error of the mean.
Figure 2.
Figure 2.
Ts65Dn PA1 cells displayed a proliferation deficit which can be overcome with EGCG treatment. Cells from the PA1 of E9.5 Ts65Dn embryos displayed impaired proliferation compared with euploid cells (P ≤ 0.01) (N = 8 euploid, 7 Ts65Dn). A significant cellular proliferation occurred with 25 µm EGCG treatment for 4 h (P ≤ 0.001) (N = 10 euploid, 10 Ts65Dn). Addition of 100 µm EGCG led to an increase in proliferation above euploid levels (P ≤ 0.001). Cells derived from the NT displayed no deficit in proliferation, but were still affected by EGCG treatment. A dose of 10 µM (N = 10 euploid, 10 Ts65Dn) appeared to adversely affect proliferation of cells from NT (P ≤ 0.01), whereas 25 µM EGCG produced no change from untreated trisomic cells (P = 0.89). A significant increase in cells was seen, however, in cells treated with 100 µM EGCG (N = 10 euploid, 10 Ts65Dn) to above euploid levels (P ≤ 0.001). For statistical analysis, a two-tailed Student’s t-test was performed. Statistical significance is annotated as * for P ≤ 0.05 and ** for P ≤ 0.001 with respect to the untreated cells by tissue type. Error bars indicate standard error of the mean.
Figure 3.
Figure 3.
Ts65Dn PA1 and NT cells displayed migration deficits at E9.5 which can be overcome with EGCG treatment. (A) Cells from the PA1 of Ts65Dn E9.5 embryos displayed an initial cellular migration deficit (average number of cells traveling into the space made by the scratch, P ≤ 0.001) which was not overcome through the progression of the scratch assay (N = 11 euploid, 8 Ts65Dn). However, treatment with both 10 µM (P ≤ 0.01) (N = 8 euploid, 8 Ts65Dn) and 25 µM EGCG (P ≤ 0.01) (N = 7 euploid, 7 Ts65Dn) was sufficient to rescue this cellular migration deficit within 24 h. Migration trends were maintained in the PA1 at 48 and 72 h (P ≤ 0.01 for all conditions). (B) Cellular migration in the NT was deficient at 24 h postassay initiation, but appeared to reach euploid levels of migration by the completion of the assay. Treatment with 10 µM (P ≤ 0.05) and 25 µM (P ≤ 0.05) rescued this initial migration deficit by 24 h through the termination of the assay. For statistical analysis, two-tailed Student’s t-tests were performed. Statistical significance is annotated as * for P ≤ 0.05 and ** for P ≤ 0.01 with respect to untreated cells by tissue type. Error bars indicate standard error of the mean.
Figure 4.
Figure 4.
Effects of EGCG treatment given at E7–E8 on E9.5 PA1 volume, NCC number and embryo volume. (A) Ts65Dn embryos receiving PBS in utero displayed a smaller PA1 volume than euploid embryos receiving PBS (P ≤ 0.001). Treatment of Ts65Dn embryos with EGCG improved PA1 volume to above baseline trisomic PA1 volume (P ≤ 0.001), but not to PBS-treated euploid PA1 volume. Treatment of euploid embryos with EGCG led to increased PA1 over non-treated euploid PA1 volume (P ≤ 0.05). (B) Treatment of trisomic embryos with EGCG ameliorated the NCC deficit to euploid levels (P = 0.082). Treatment of euploid embryos with EGCG, led to an increase in NCC above euploid levels (P ≤ 0.05). (C). Treatment of trisomic embryos with EGCG did not lead to a significant increase in volume compared euploid embryos, but did increase embryonic volume in comparison to PBS-treated trisomic embryos. Euploid embryos treated with EGCG displayed increased embryo volume compared with euploid-treated PBS embryos, but this value was not significant (P = 0.092) (Ts65Dn N = 4, Ts65Dn + EGCG N = 4, euploid N = 4, euploid + PBS N= 4). For statistical analysis, two-tailed Student’s t-tests were performed. Statistical significance is annotated as ** for P ≤ 0.001 for untreated trisomic versus euploid, †P ≤ 0.05 and ††P ≤ 0.001 for EGCG-treated versus -untreated of the same genotype, and #P ≤ 0.05 and ##P ≤ 0.001 for trisomic EGCG-treated versus euploid-untreated comparisons. Error bars indicate standard error of the mean.
Figure 5.
Figure 5.
EGCG exposure leads to alterations of RNA expression from genes involved in pathways impacting craniofacial development E9.5 PA1. Baseline expression of RNA encoded by Dyrk1a, Rcan1, Shh, Gli1, Ptch1 and Ets2 quantified as cDNA by qRT-PCR revealed alterations in expression from euploid values (equivalent to a relative expression value of 1). RNA expression from these genes was altered in several cases in E9.5 trisomic PA1 receiving EGCG treatment in utero with most achieving near euploid values of relative expression. For statistical analysis, two-tailed Student’s t-tests were performed. Statistical significance is annotated as * for P ≤ 0.05 for Ts65Dn + PBS versus Ts65Dn + EGCG, †P ≤ 0.05 for Ts65Dn + PBS untreated versus euploid + EGCG and #P ≤ 0.05 for Ts65Dn + EGCG versus euploid + EGCG. Error bars indicate standard error of the mean.
Figure 6.
Figure 6.
Effects of EGCG treatment given at E0–E9.5 on E9.5 PA1 volume, NCC number and embryo volume. Ts/(Ts), trisomic embryos from Ts65Dn mothers; Eu/(Ts), euploid embryos from Ts65Dn mothers; Eu/(Eu), euploid embryos from euploid B6C3F1 mothers. Ts/(Ts) + H20: n = 9; Ts/(Ts) + EGCG: N = 5; Eu/(Ts) + H20: N = 6; Eu/(Ts) + EGCG: N = 9; Eu/(Eu) + H20: N = 8; Eu/(Eu) + EGCG: N = 7. (A) No significant differences were seen in the PA1 volume of EGCG-treated trisomic Ts/(Ts) or euploid Eu/(Eu) embryos compared with untreated embryos (P = 0.058). PA1 volume was significantly increased in EGCG-treated euploid embryos [Eu/(Ts)] compared with untreated embryos [Eu/(Ts)]. (B) EGCG treatment from E0 to E9.5 at ∼12 mg/kg/day did not significantly alter the number of NCC in any treatment groups compared with untreated embryos. The slight but non-significant decrease in NCC in EGCG-treated Ts/(Ts) embryos was likely due to a lower average somite number in this group compared with water treated embryos (P = 0.0613). (C) No differences were found between treated and untreated embryo volume of any trisomic or euploid embryos. Statistical significance is annotated as * for P ≤ 0.05. Error bars indicate standard error of the mean.
Figure 7.
Figure 7.
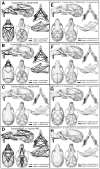
Craniofacial measurements of 6-week-old Ts65Dn and euploid mice with or without EGCG treatment or Dyrk1a genetic reduction. Linear distances that significantly differ by confidence interval testing (α = 0.10) from two-sample EDMA comparisons of mouse cohorts are shown on lateral, superior and inferior views of the mouse cranium and superior and lateral views of the mandible. Linear distances that were significantly smaller or larger are depicted for each comparison as dashed or solid lines. (A) Euploid + PBS compared with Ts65Dn + PBS: significant cranial base differences were found that include anterioposterior dimensions of the palatine, basisphenoid and occipital bones. Numerous rostrocaudal, mediolateral and superioinferior differences were found across the face that include the nasal, premaxillae and maxillae bones. Many height, width and length measurements of the mandible significantly differed. Several anterioposterior, mediolateral and superioinferior measures of the cranial vault were also significant. (B) Euploid + PBS compared with Ts65Dn + EGCG: significant cranial base differences were found that include anterioposterior dimensions of the basisphenoid and occipital bones. Numerous length, width and height significant differences were found across the face that include the nasal, premaxillae and maxillae bones. Many anterioposterior, mediolateral and superioinferior measurements of the mandible significantly differed. Mediolateral differences in skull width were localized to the anterior portion of the cranial vault including the zygomatic arches and frontal bone and to the posterior cranial vault including the parietal bones. (C) Ts65Dn + EGCG compared with Ts65Dn + PBS: significant superioinferior and mediolateral facial differences including the premaxillae and nasal bones and significant cranial vault width differences localized to the interparietal bone were smaller, whereas a mandibular measure of incisor height was larger in Ts65Dn + EGCG relative to Ts65Dn + PBS mice. (D) Euploid + EGCG compared with euploid + PBS: differences were found across the craniofacial skeleton and localized to the nasal, premaxillae, maxillae, frontal, parietal, interparietal, occipital, basisphenoid and mandibular bones. (E) Euploid compared with Ts65Dn: significant differences were present along the rostrocaudal and mediolateral axes of the face including the malar process and the nasal, premaxillae and maxillae bones. Numerous significant differences were present across the cranial vault along the mediolateral and anterioposterior axes including the frontal, parietal and interparietal bones. There were significant anterioposterior differences in condylar process and coronoid process depth and significant mediolateral differences in mandibular width. (F) Euploid compared with Ts65Dn,Dyrk1a+/−: significant facial aspects along the superioinferior–rostrocaudal dimensions including the maxillae bones were larger in euploid mice, whereas significant cranial vault dimensions along the anterioposterior and mediolateral axes including the parietal and interparietal bones and a significant mandibular measure of incisor height were smaller in euploid relative to Ts65Dn,Dykr1a+/− mice. (G) Ts65Dn,Dyrk1a+/− compared with Ts65Dn: significant mediolateral differences in palatine bone width were found. One superioinferior–rostrocaudal facial measure of the maxillary bone significantly differed between samples. A measure of incisor width was significant. There were numerous significant differences in mediolateral and anterioposterior cranial vault dimensions crossing the zygomatic, frontal, parietal, interparietal and squamosal bones. (H) Euploid compared with euploid,Dyrk1a+/−: significant facial dimensions along the superioinferior and rostrocaudal dimensions including the premaxillae and maxillae bones were larger, whereas a mandibular measure of incisor width was smaller in euploid relative to euploid,Dyrk1a+/− mice.

Similar articles

Cited by

References

    1. Borenstein M., Persico N., Kaihura C., Sonek J., Nicolaides K.H. (2007) Frontomaxillary facial angle in chromosomally normal fetuses at 11 + 0 to 13 + 6 weeks. Ultrasound Obstet. Gynecol., 30, 737–741. - PubMed
    1. Cicero S., Curcio P., Rembouskos G., Sonek J., Nicolaides K.H. (2004) Maxillary length at 11–14 weeks of gestation in fetuses with trisomy 21. Ultrasound Obstet. Gynecol., 24, 19–22. - PubMed
    1. Sonek J., Borenstein M., Dagklis T., Persico N., Nicolaides K.H. (2007) Frontomaxillary facial angle in fetuses with trisomy 21 at 11–13(6) weeks. Am. J. Obstet. Gynecol., 196, 271.e1–271.e4. - PubMed
    1. Starbuck J.M., Cole T.M. 3rd, Reeves R.H., Richtsmeier J.T. (2013) Trisomy 21 and facial developmental instability. Am. J. Phys. Anthropol., 151, 49–57. - PMC - PubMed
    1. Allanson J.E., O'Hara P., Farkas L.G., Nair R.C. (1993) Anthropometric craniofacial pattern profiles in Down syndrome. Am. J. Med. Genet., 47, 748–752. - PubMed

MeSH terms