. 2016 Oct 15;25(20):4577-4589.
doi: 10.1093/hmg/ddw287.

Mouse Dux is myotoxic and shares partial functional homology with its human paralog DUX4

Affiliations

Mouse Dux is myotoxic and shares partial functional homology with its human paralog DUX4

Jocelyn O Eidahl et al. Hum Mol Genet. .

Abstract

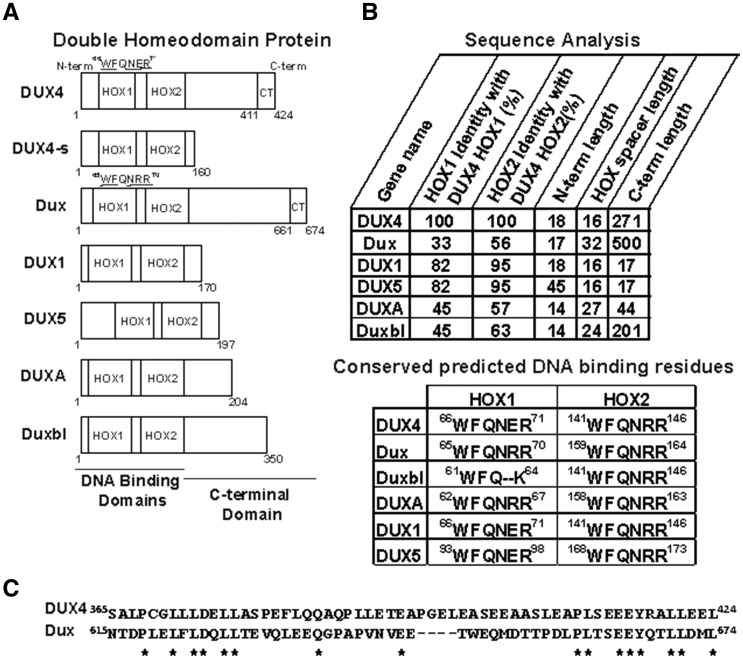
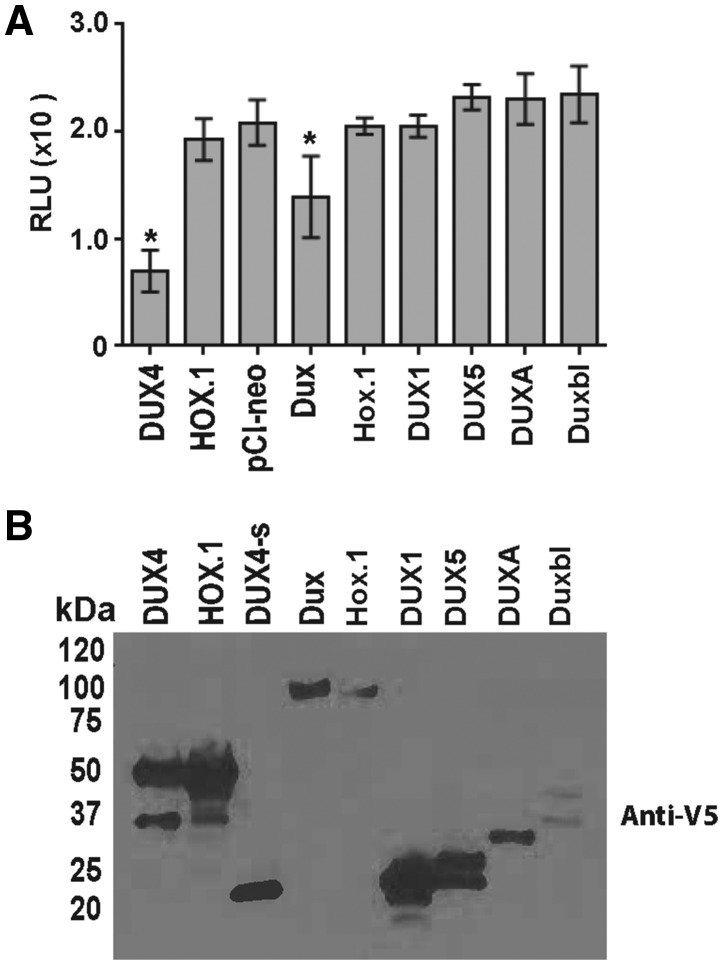
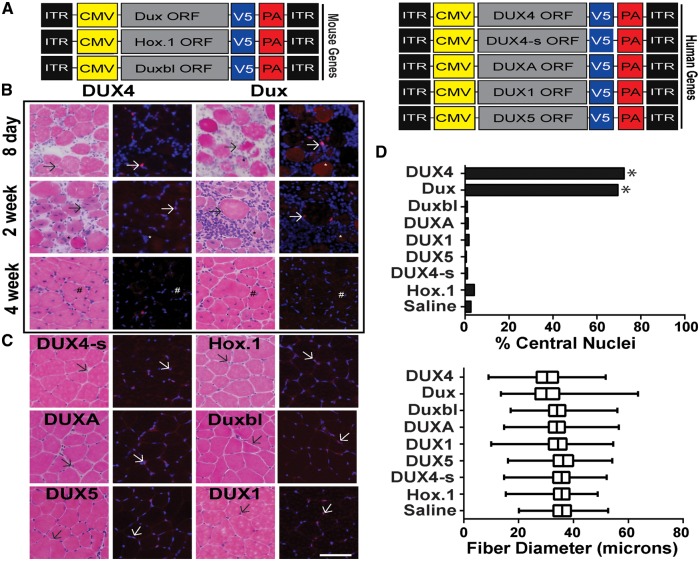
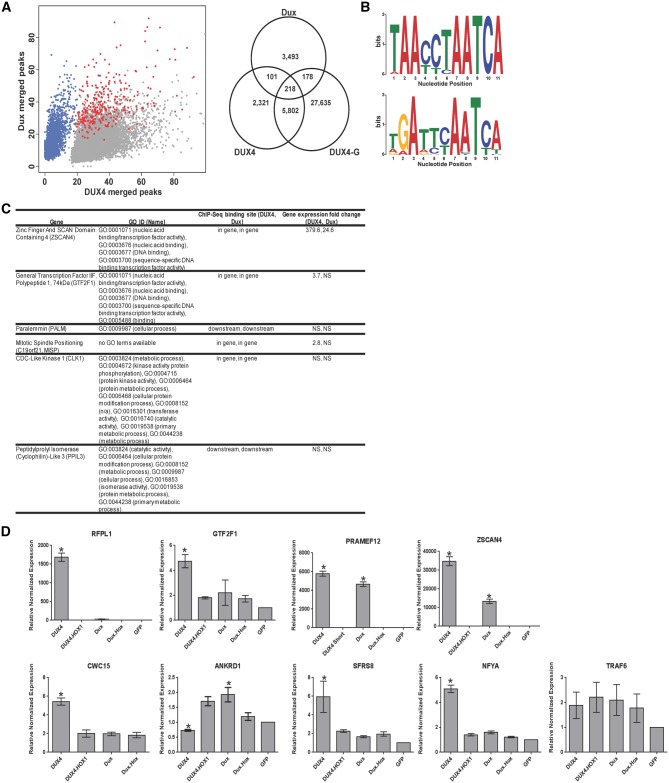
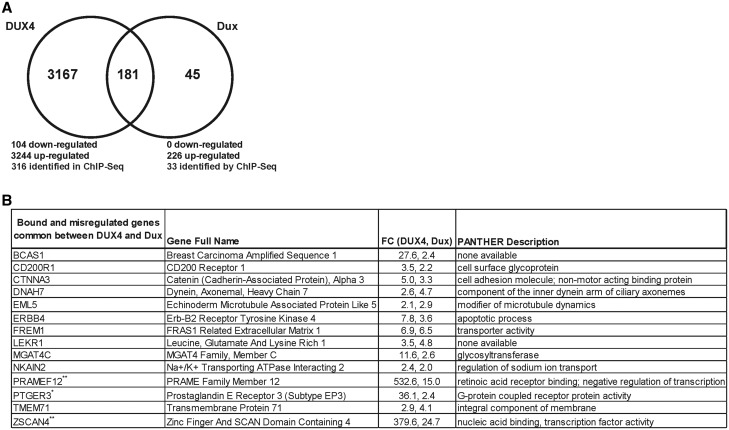
D4Z4 repeats are present in at least 11 different mammalian species, including humans and mice. Each repeat contains an open reading frame encoding a double homeodomain (DUX) family transcription factor. Aberrant expression of the D4Z4 ORF called DUX4 is associated with the pathogenesis of Facioscapulohumeral muscular dystrophy (FSHD). DUX4 is toxic to numerous cell types of different species, and over-expression caused dysmorphism and developmental arrest in frogs and zebrafish, embryonic lethality in transgenic mice, and lesions in mouse muscle. Because DUX4 is a primate-specific gene, questions have been raised about the biological relevance of over-expressing it in non-primate models, as DUX4 toxicity could be related to non-specific cellular stress induced by over-expressing a DUX family transcription factor in organisms that did not co-evolve its regulated transcriptional networks. We assessed toxic phenotypes of DUX family genes, including DUX4, DUX1, DUX5, DUXA, DUX4-s, Dux-bl and mouse Dux. We found that DUX proteins were not universally toxic, and only the mouse Dux gene caused similar toxic phenotypes as human DUX4. Using RNA-seq, we found that 80% of genes upregulated by Dux were similarly increased in DUX4-expressing cells. Moreover, 43% of Dux-responsive genes contained ChIP-seq binding sites for both Dux and DUX4, and both proteins had similar consensus binding site sequences. These results suggested DUX4 and Dux may regulate some common pathways, and despite diverging from a common progenitor under different selective pressures for millions of years, the two genes maintain partial functional homology.


Figures

Figure 1
Figure 1
DUX family proteins used in this study. (A) Schematic of 7 DUX family proteins showing location of DNA binding homeodomains (HOX1 and HOX2) and variable carboxyl-terminal domains. Numbers indicate amino acid residues. In the DUX4.HOX1 and Dux.Hox1 DNA binding mutants, underlined residues were mutated to alanines. CT, conserved extreme C-terminus in DUX4 and Dux proteins, shown in (C). (B) (Top) Comparison of amino acid sequence homology in DUX family proteins. Columns 1 and 2 show amino acid identity in the HOX1 and HOX2 domains of indicated proteins, relative to the same domains in DUX4. ‘N-term length’ indicates the amino acid length from residue 1 to the beginning of the first homeodomain. ‘C-term length’ indicates the length from the end of the second homeodomain to C-terminus of the protein. ‘HOX spacer length’ indicates the number of amino acids between the first and second homeodomains. (Bottom) Alignment of conserved DNA binding residues within HOX1 and HOX2. In DUX4 and Dux, 5 of these were mutated to alanines to construct DUX4.HOX1 and Dux.Hox1, as shown in (A). (C) Alignment of extreme C-terminal residues of DUX4 (residues 365-424) and Dux (residues 615-674). Asterisks indicate residue identity. Note high identity in the last 14 amino acids.
Figure 2
Figure 2
In vitro analysis of DUX family proteins. (A) Luminescence-based ATP assay. C2C12s were transfected with indicated plasmids and abundance of ATP was monitored 48 h later. Data are reported in relative luminescent units (RLU) with background removed (cells only), and each condition was performed in triplicate in two independent experiments. * indicates significant difference from “pCI-neo” empty vector control, P < 0.05, ANOVA. (B) Western blot. Protein extracts from cells transfected with expression plasmids encoding V5-epitope tagged DUX family ORFs were visualized using an HRP-coupled anti-V5 antibody. Predicted molecular weights of each protein: DUX4 and DUX4.HOX1, 52 kDa; DUX4s, 22 kDa; Dux and Dux.Hox1, 76 kDa; DUX1, 22 kDa; DUXA, 24 kDa; Duxbl, 38 kDa; DUX5, 22 kDa.
Figure 3
Figure 3
Dux and DUX4 cause myotoxicity in vivo. (A) Schematic of adeno-associated viral vector constructs (AAV6). Each DUX family ORF was driven by the cytomegalovirus (CMV) promoter and contained a carboxyl-terminal V5-epitope tag followed by an SV40 poly-adenylation signal (PA). Each construct was flanked by AAV2 inverted terminal repeats (ITR). (B) Photomicrographs of mouse muscle cryosections stained with hematoxylin and eosin (H&E) staining and anti-V5 immunofluorescence at indicated times following AAV.DUX4 or AAV.Dux delivery. (C) DUX4s, Dux.Hox1, DUXA, Duxbl, DUX5, and DUX1 are shown at 4 weeks post-injection. Arrows indicate positive V5-stained (red) nuclei. Blue, DAPI stain to identify nuclei. * denotes degenerating fibres positive for V5 staining and # show examples of regenerated myofibres with central nuclei. Scale bar = 100 μm. (D) (Top) Percent central nuclei in muscle cryosections 4 weeks post-injection. Central nuclei from fibres of 5 independent animals were counted per treatment. * denote significantly increased numbers of centralized nuclei (P < 0.0001, chi-square) (Bottom) Distribution of fibre diameter (microns) as a percentage of total fibres counted during sampling at 4 weeks post-injection for each construct (n = 5 muscles per group; 5 representative x20 photomicrographs per section).
Figure 4
Figure 4
Characterization of DUX4 and Dux DNA binding sites in myoblasts. (A) (Left) Scatter plot of merged peak regions for DUX4 and Dux in human myoblasts. Gray dots correspond to DUX4 specific peaks, blue dots correspond to Dux specific peaks and red dots correspond to peaks in common between DUX4 and Dux. The XY axes denote the number of alignments (“tag”) within each of the peak regions. (Right) Venn diagram showing the overlap of peak regions for DUX4, Dux and DUX4-G in human myoblasts. DUX4-G refers to a published dataset of DUX4 ChIP-seq data by Geng, et al (33). Additional readout of the merged peak regions (heatmap and density plot) to visualize the unique peak populations for DUX4 and Dux can be found in Supplementary Figure 3. (B) Conserved sequence motifs identified by MEME (http://meme.nbcr.net/meme/) in the DUX4 (top) and Dux (bottom) top 1,000 ChIP-Seq peak sequences (37). Nucleotides (measured in bits) of the identified consensus motif are displayed in a sequence logo representation (62). X-axis corresponds to the 11 nucleotide positions (Supplementary Material, Table 2). (C) Table listing genes annotated to DUX4 and Dux overlapping DNA binding sites and their corresponding Gene Ontology IDs. The peak values associated with these DNA binding sites are within the top 100 values for both DUX4 and Dux samples. Columns indicate genomic binding sites identified by ChIP-Seq and gene expression fold change identified by RNA-Seq. (D) Twenty-four hours after transfection of DUX4, DUX4.HOX1, Dux, Dux.Hox1, and GFP in human myoblasts, quantitative RT-PCR was performed to measure expression of the indicated genes containing ChIP-seq binding sites for DUX4 and Dux. Expression was normalized to GFP transfected cells with human RPL13A used as the reference gene, with means +/- SEM shown. * indicates significant difference from GFP control, P < 0.05, ANOVA. Each individual assay was performed in triplicate from n = 3 samples for each condition. In addition, ZSCAN4 and PRAMEF12 experiments were performed three independent times; RFPL1, GTF2F1 and SFRS8 experiments were performed two independent times; and ANKRD1, CWC15, TRAF6, SFRS8 and NFYA expression levels were determined in one experiment. The graphs here show representative data from one experiment each.
Figure 5
Figure 5
Common expression changes in DUX4- and Dux-expressing myoblasts (A) Venn diagram of genes up- or down-regulated in human myoblasts transfected with DUX4 and Dux identified by RNA-seq. (B) Compilation of ChIP-seq and RNA-seq data. The fourteen genes listed were significantly upregulated by both DUX4 and Dux and contained ChIP-seq binding sites for both proteins within 10,000 bp upstream or downstream of the corresponding gene’s TSS. FC, fold-change. PANTHER description (http://pantherdb.org/). Asterisks indicate genes with identical binding sites in our ChIP-seq experiments. One asterisks (*) indicates the presence of one consensus binding site sequence, and two asterisks (**) indicates the presence of more than one consensus binding site sequences.

References

    1. INSERM, French Ministry of Health. (2008), In Orphanet Report. Orphanet, Vol. 2008.
    1. Deenen J.C., Arnts H., van der Maarel S.M., Padberg G.W., Verschuuren J.J., Bakker E., Weinreich S.S., Verbeek A.L., van Engelen B.G. (2014) Population-based incidence and prevalence of facioscapulohumeral dystrophy. Neurology, 83, 1056–1059. - PMC - PubMed
    1. Flanigan K.M., Harper S.Q. (2013) John Wiley & Sons, L; (ed.), In Muscle Disease, in press., pp. 288–297.
    1. Tawil R., Van Der Maarel S.M. (2006) Facioscapulohumeral muscular dystrophy. Muscle & Nerve, 34, 1–15. - PubMed
    1. Wijmenga C., Hewitt J.E., Sandkuijl L.A., Clark L.N., Wright T.J., Dauwerse H.G., Gruter A.M., Hofker M.H., Moerer P., Williamson R., et al. (1992) Chromosome 4q DNA rearrangements associated with facioscapulohumeral muscular dystrophy. Nat. Genet., 2, 26–30. - PubMed