Review
. 2017 Jan 1;66(1):e47-e65.
doi: 10.1093/sysbio/syw054.

Emerging Concepts of Data Integration in Pathogen Phylodynamics

Affiliations
Review

Emerging Concepts of Data Integration in Pathogen Phylodynamics

Guy Baele et al. Syst Biol. .

Abstract

Phylodynamics has become an increasingly popular statistical framework to extract evolutionary and epidemiological information from pathogen genomes. By harnessing such information, epidemiologists aim to shed light on the spatio-temporal patterns of spread and to test hypotheses about the underlying interaction of evolutionary and ecological dynamics in pathogen populations. Although the field has witnessed a rich development of statistical inference tools with increasing levels of sophistication, these tools initially focused on sequences as their sole primary data source. Integrating various sources of information, however, promises to deliver more precise insights in infectious diseases and to increase opportunities for statistical hypothesis testing. Here, we review how the emerging concept of data integration is stimulating new advances in Bayesian evolutionary inference methodology which formalize a marriage of statistical thinking and evolutionary biology. These approaches include connecting sequence to trait evolution, such as for host, phenotypic and geographic sampling information, but also the incorporation of covariates of evolutionary and epidemic processes in the reconstruction procedures. We highlight how a full Bayesian approach to covariate modeling and testing can generate further insights into sequence evolution, trait evolution, and population dynamics in pathogen populations. Specific examples demonstrate how such approaches can be used to test the impact of host on rabies and HIV evolutionary rates, to identify the drivers of influenza dispersal as well as the determinants of rabies cross-species transmissions, and to quantify the evolutionary dynamics of influenza antigenicity. Finally, we briefly discuss how data integration is now also permeating through the inference of transmission dynamics, leading to novel insights into tree-generative processes and detailed reconstructions of transmission trees. [Bayesian inference; birth–death models; coalescent models; continuous trait evolution; covariates; data integration; discrete trait evolution; pathogen phylodynamics.


Figures

Figure 1.
Figure 1.
Temporal signal in pathogen genomes sampled through time. A) Plot of the probability of observing no changes between two genomes of length (formula image) separated by the given number of days (formula image) for a given rate of evolution per site per year (formula image). We used formula image and formula image for Influenza A/H1N1 (Stadler et al. 2013), formula image and formula image for MERS-CoV (Cotten et al. 2014), formula image and formula image for EBOV (Park et al. 2015), formula image and formula image for CHIK, formula image and formula image for Salmonella Typhimurium DT104 (Mather et al. 2013), and formula image and formula image for Smallpox. An online application to plot such probabilities is available at http://epidemic.bio.ed.ac.uk/node/79. B. Root-to-tip divergences as a function of sampling time based on publicly available Influenza A/H1N1, MERS-CoV and EBOV genomes as well as for an unpublished CHIK data set. The regression plots were rescaled for each virus such that the oldest genome in each dataset was set at time = 0 and the regression line has zero divergence at time = 0.
Figure 2.
Figure 2.
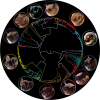
The multihost transmission dynamics of rabies in American bat species. Streicker et al. (2010) identified 18 phylogenetic lineages of rabies virus that were statistically compartmentalized to particular bat taxa. These lineages are represented by differently colored clades in the phylogeny, along with a selection of bat species involved. CSTs are defined as jumps to bat species different from the dominant species within each lineage or clade. These dynamics have been quantified though structured coalescent approaches (Streicker et al. 2010). Host switches on the other hand are defined as the jumps along internal branches to new hosts followed by successful transmission in the new host species. Inferring the history of host jumping along the branches (mostly represented by white branches) has been the subject of discrete trait reconstruction (Streicker et al. 2010). We thank Daniel Streicker for providing the tree and MerlinTuttle.org for granting permission to use the bat portraits.
Figure 3.
Figure 3.
Antigenic cartography meets Brownian phylogenetic diffusion. A) Conceptual representation of the integration of genetic and antigenic evolution through a Bayesian MDS approach. In the HI assay (on the right), the antigenic phenotype is investigated by measuring the cross-reactivity of a virus (A, B, C, or D) strain to serum (formula image) raised against another strain. Based on these HI measurements, MDS approaches allow to position viruses in lower-dimensional space such that the distances in this space best fit the HI assay titres. A probabilistic interpretation of MDS assumes that the observed differences are centered around their cartographic expectation, in which case the virus locations are estimable parameters. We refer to Bedford et al. (2014) for more information on how these locations are estimated in an integrated Bayesian phylogenetic framework. B) Visualization of antigenic drift dynamics reconstructed using Bayesian MDS in a two-dimensional map. These patterns are inferred from the 2002 to 2011 subset of the influenza A/H3N2 dataset analyzed by Bedford et al. (2014). X and Y represent the first and second antigenic dimensions. The contours represent the 80% HPD region for the node locations (both internal and external nodes). The colors range from green to blue for the lines, points and contours reflects the age between 2002 and 2011. This figure was made using SpreadD3 (Bielejec et al. 2016).
Figure 4.
Figure 4.
Contrasting models with completely linked and unlinked parameters to hierarchical modeling without and with fixed effects. Traditionally, two competing approaches were used when performing Bayesian inference to estimate parameters from a potentially large number of partitions, strata, or individuals: total evidence, where all the data across strata are pooled or shared to estimate a single parameter of interest, and unconditionally independent partitioning, where each stratum requires the estimation of a completely independent set of parameters. The latter is associated with independent prior specification on every parameter. Hierarchical phylogenetic models (HPMs) offer a middle ground between these two extremes by sharing a hierarchical prior distribution over all parameters with estimable mean and variance, which are drawn from hyperpriors. Edo-Matas et al. (2011) propose an HPM that employs a Bayesian mixed effects model that pools information across patients, affording more precise individual-patient parameter estimates when the data are sparse for a patient, but also allowing estimation of the effect of patient groups or continuous covariates.
Figure 5.
Figure 5.
GLM extension of discrete phylogenetic diffusion and examples of covariates or predictors (formula image) in a spatial context. The GLM parameterizes each rate of among-location movement in the phylogeographic model as a log linear function of various potential predictors. For each predictor formula image (formula image; formula image), the GLM parameterization includes a coefficient formula image, which quantifies the contribution or effect size of the predictor (in log space), and a binary indicator variable formula image, that allows the predictor to be included or excluded from the model. Since predictors are essentially matrices of pairwise measurements, location-specific measurements such as population size or density are separated into origin or destination size.

References

    1. Alizon S., Fraser C. 2013.. Within-host and between-host evolutionary rates across the HIV-1 genome. Retrovirology 10:49. - PMC - PubMed
    1. Alizon S., von Wyl V., Stadler T., Kouyos R.D., Yerly S., Hirschel B., Boni J., Shah C., Klimkait T., Furrer H., Rauch A., Vernazza P.L., Bernasconi E., Battegay M., Bürgisser P., Telenti A., Günthard H.F., Bonhoeffer S. the Swiss Cohort Study. 2. Phylogenetic approach reveals that virus genotype largely determines HIV set-point viral load. PLoS Path. 6:e1001123. - PMC - PubMed
    1. Ayres D.L., Darling A., Zwickl D.J., Beerli P., Holder M.T., Lewis P.O., Huelsenbeck J.P., Ronquist F., Swofford D.L., Cummings M.P., Rambaut A., Suchard M.A. 2. BEAGLE: an application programming interface and high-performance computing library for statistical phylogenetics. Syst. Biol. 61:170–173. - PMC - PubMed
    1. Baele G., Lemey P. 2. Bayesian evolutionary model testing in the phylogenomics era: matching model complexity with computational efficiency. Bioinformatics 29:1970–1979. - PubMed
    1. Bahl J., Nelson M.I., Chan K.H., Chen R., Vijaykrishna D., Halpin R.A., Stockwell T.B., Lin X., Wentworth D.E., Ghedin E., Guan Y., Peiris J.S.M, Riley S., Rambaut A., Holmes E.C., Smith G.J.D. 2. Temporally structured metapopulation dynamics and persistence of influenza A H3N2 virus in humans. Proc. Natl. Acad. Sci. USA 108:19359–19364. - PMC - PubMed

Publication types