Review
. 2017 Jan 1;66(1):e30-e46.
doi: 10.1093/sysbio/syw056.

Statistical Inference in the Wright-Fisher Model Using Allele Frequency Data

Affiliations
Review

Statistical Inference in the Wright-Fisher Model Using Allele Frequency Data

Paula Tataru et al. Syst Biol. .

Abstract

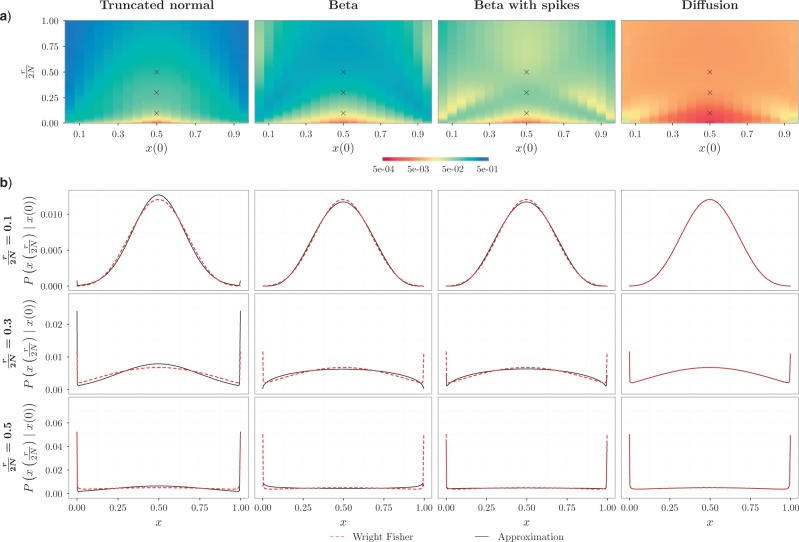
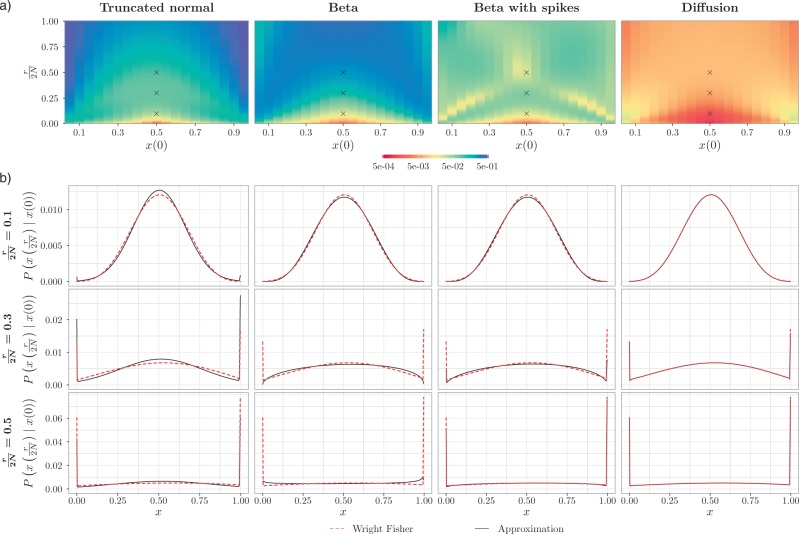
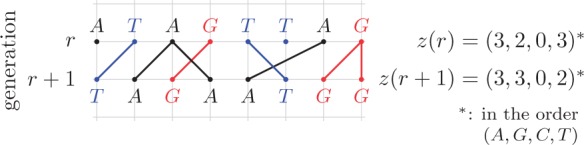
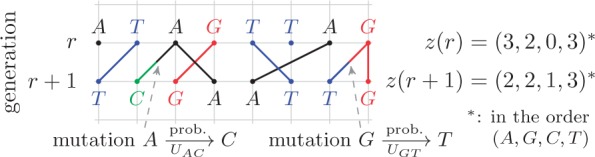
The Wright–Fisher model provides an elegant mathematical framework for understanding allele frequency data. In particular, the model can be used to infer the demographic history of species and identify loci under selection. A crucial quantity for inference under the Wright–Fisher model is the distribution of allele frequencies (DAF). Despite the apparent simplicity of the model, the calculation of the DAF is challenging. We review and discuss strategies for approximating the DAF, and how these are used in methods that perform inference from allele frequency data. Various evolutionary forces can be incorporated in the Wright–Fisher model, and we consider these in turn. We begin our review with the basic bi-allelic Wright–Fisher model where random genetic drift is the only evolutionary force. We then consider mutation, migration, and selection. In particular, we compare diffusion-based and moment-based methods in terms of accuracy, computational efficiency, and analytical tractability. We conclude with a brief overview of the multi-allelic process with a general mutation model.

Keywords: Allele frequency; diffusion; inference; moments; selection; Wright–Fisher.


Figures

Figure 1.
Figure 1.
Data types. The gray boxes represent the unobserved history of the populations, together with the corresponding population allele frequency formula image, whereas the white boxes indicate the observed data: the generation formula image when the data are sampled, the size formula image of the sample, and the allele count formula image, that is, how many alleles of a given type have been observed among the genotyped individuals. Given the population frequency formula image, formula image follows a binomial distribution with size formula image and probability formula image. In order to calculate the likelihood of the data, the DAF of formula image is needed. a) Time series data where, typically, one population is sampled at different (known) generations. b) Single time-point data, where multiple populations are sampled just once, typically in the present. The history of the populations is given as a tree. The leaves and internal nodes represent the sampled and ancestral populations, respectively. The branch lengths reflect the amount of time populations have diverged since the split from the ancestral population.
Figure 2.
Figure 2.
Dynamics in the pure drift bi-allelic Wright–Fisher model. The child inherits the parental allele.
Figure 3.
Figure 3.
a) Simulation under the pure drift model (equation (1)) with formula image and formula image. The vertical bars indicate three sampled time-points. The formula image-axis denotes the time measured in scaled number of generations. b) DAF at the three sampled time-points. The vertical bars indicate the simulated allele frequencies.
Figure 4.
Figure 4.
Fit of various approximations to the pure drift true DAF, calculated using the Markov chain property for formula image and a range of formula image and formula image. Each column shows a different type of approximation, indicated at the top of the figure. a) Hellinger distance on log scale between the approximated and true DAF. The three “formula image”s in each of the heatmaps indicate the combinations of formula image and formula image used in b). b) True (dashed lines) and approximated (solid lines) DAF for formula image and different values of formula image. The truncated normal, beta and beta with spikes are discretized as in Tataru et al. (2015). The diffusion DAF is calculated as in Zhao et al. (2013), with formula image and formula image. We used formula image for computational reasons, but we see similar patterns for larger formula image.
Figure 5.
Figure 5.
Dynamics in the bi-allelic Wright–Fisher model with mutations. If the parental allele is formula image, the child has the same allele with probability formula image, and a mutation occurs with probability formula image. If the parental allele is formula image, the child allele is formula image with probability formula image, and becomes formula image with probability formula image.
Figure 6.
Figure 6.
Fit of various approximations to the true DAF with neutral mutations, calculated using the Markov chain property for formula image, formula image and a range of formula image and formula image. Each column shows a different type of approximation, indicated at the top of the figure. a) Hellinger distance on log scale between the approximated and true DAF. The three "formula image"s in each of the heatmaps indicate the combinations of formula image and formula image used in b). b) True (dashed lines) and approximated (solid lines) DAF for formula image and different values of formula image. Calculations are performed as for Figure 4. For comparison purposes, the a) heatmap and b) formula image-axis scales are the same as in Figure 4.
Figure 7.
Figure 7.
Fit of various approximations to the true DAF with selection, calculated using the Markov chain property for formula image, formula image, formula image and a range of formula image and formula image. Each column shows a different type of approximation, indicated at the top of the figure. a) Hellinger distance on log scale between the approximated and true DAF. The three “formula image”s in each of the heatmaps indicate the combinations of formula image and formula image used in b). b) True (dashed lines) and approximated (solid lines) DAF for formula image and different values of formula image. Calculations are performed as for Figure 4. For comparison purposes, the a) heatmap and b) formula image-axis scales are the same as in Figure 4.
Figure 8.
Figure 8.
Dynamics in the pure drift formula image multi-allelic Wright–Fisher model for formula image. The child inherits the parental allele.
Figure 9.
Figure 9.
Dynamics in the formula image multi-allelic Wright–Fisher model with mutations for formula image. If the parental allele is formula image, the child receives the same allele with probability formula image and another allele formula image with probability formula image, for formula image.
Figure 10.
Figure 10.
Fit of the Dirichlet distribution (dotted lines) to the true mean and covariance of the multi-allelic JC Wright–Fisher model (solid lines) with a) formula image (formula image small), and b) formula image (formula image large). All six plots are calculated for formula image, formula image, formula image and different values of formula image.

References

    1. Balding D.J, Nichols R.A. 1995.. A method for quantifying differentiation between populations at multi-allelic loci and its implications for investigating identity and paternity. Genetica 96:3–12. - PubMed
    1. Balding D.J, Nichols R.A. 1997.. Significant genetic correlations among Caucasians at forensic DNA loci. Heredity 78(6):583–589. - PubMed
    1. Balding D.J, Steele C.D. 2015.. Weight-of-evidence for forensic DNA profiles. Chichester: John Wiley and Sons.
    1. Barton N.H, Otto S.P. 2005.. Evolution of recombination due to random drift. Genetics 169(4):2353–2370. - PMC - PubMed
    1. Beaumont M.A, Zhang W., Balding D.J. 2002.. Approximate Bayesian computation in population genetics. Genetics 162(4):2025–2035. - PMC - PubMed

Publication types