. 2017 May;11(5):470-490.
doi: 10.1002/1878-0261.12040. Epub 2017 Mar 27.

Enhanced dependency of KRAS-mutant colorectal cancer cells on RAD51-dependent homologous recombination repair identified from genetic interactions in Saccharomyces cerevisiae

Affiliations

Enhanced dependency of KRAS-mutant colorectal cancer cells on RAD51-dependent homologous recombination repair identified from genetic interactions in Saccharomyces cerevisiae

Murugan Kalimutho et al. Mol Oncol. 2017 May.

Abstract

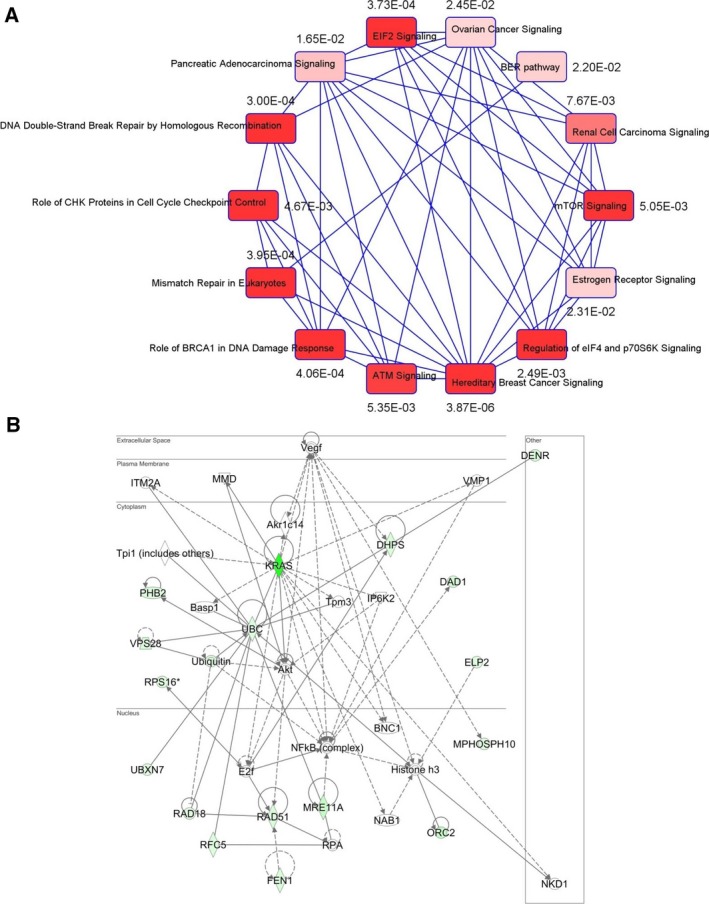
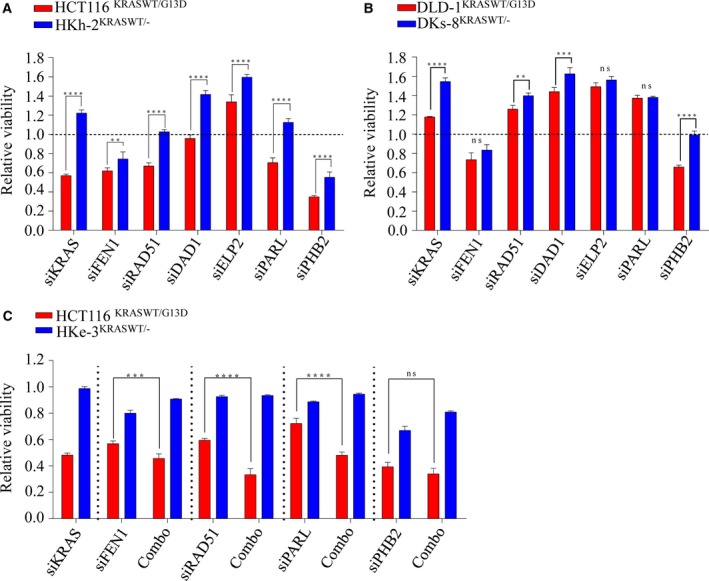
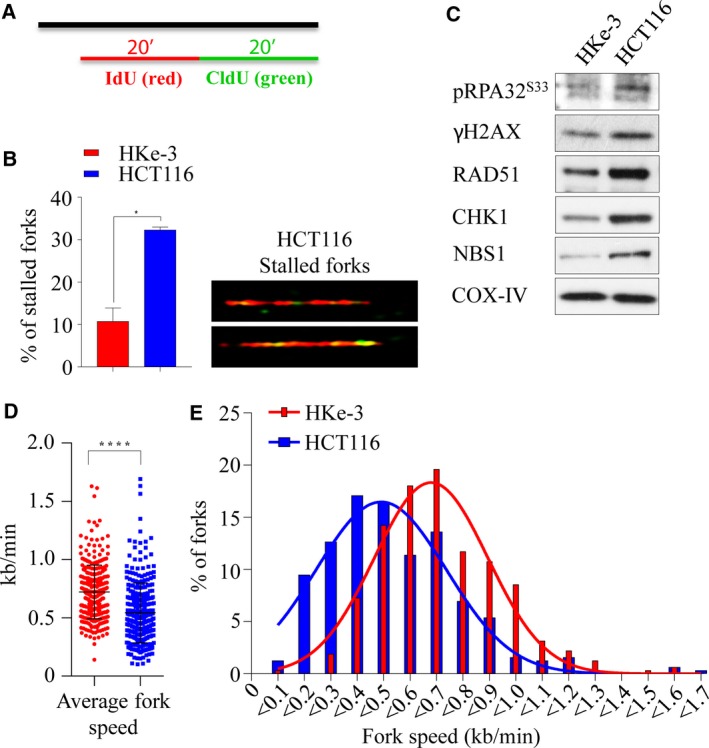
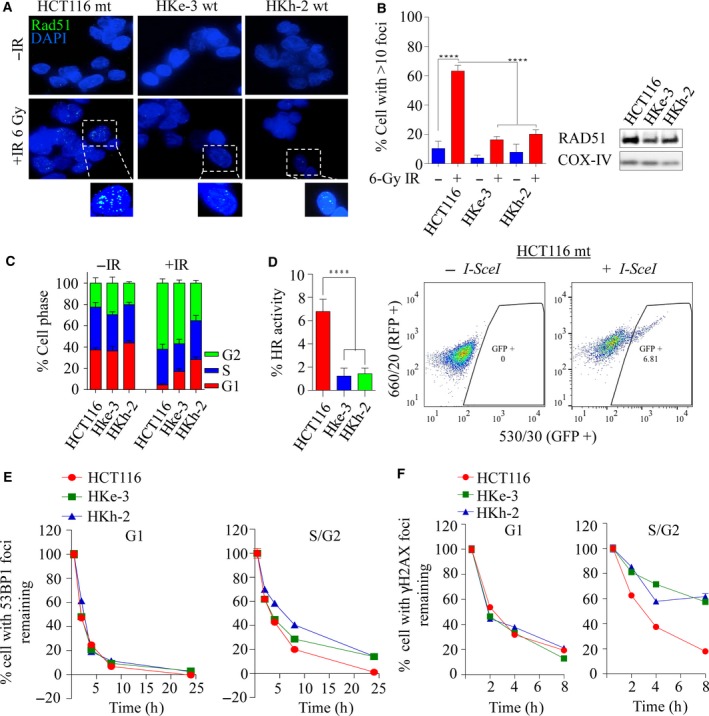
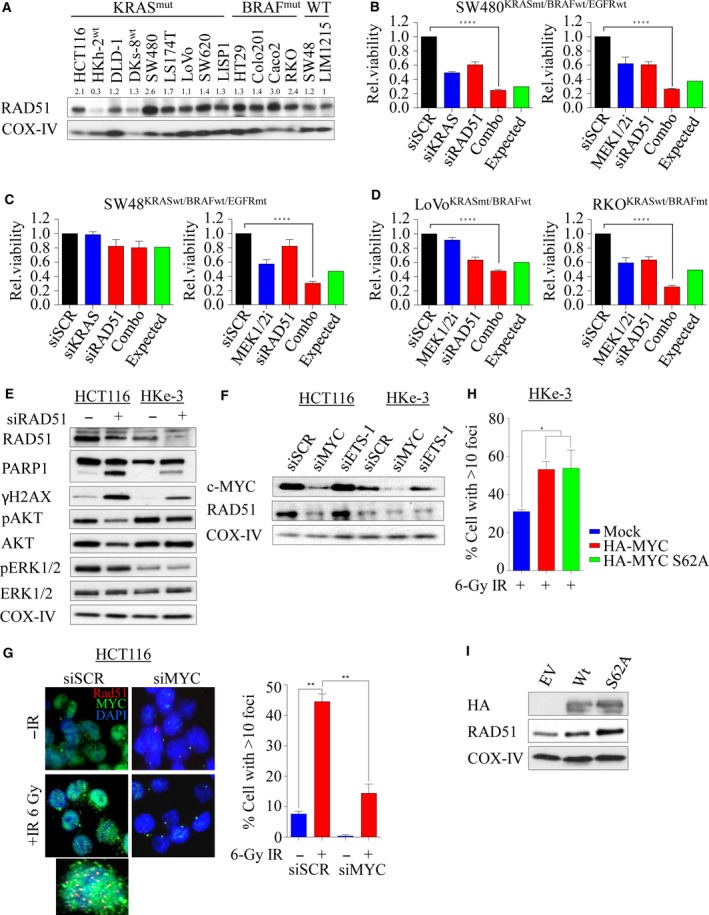
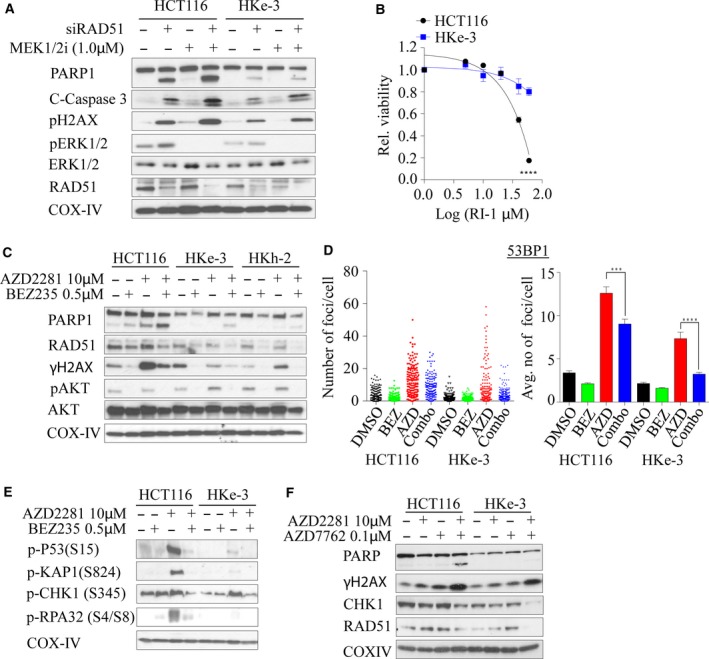
Activating KRAS mutations drive colorectal cancer tumorigenesis and influence response to anti-EGFR-targeted therapy. Despite recent advances in understanding Ras signaling biology and the revolution in therapies for melanoma using BRAF inhibitors, no targeted agents have been effective in KRAS-mutant cancers, mainly due to activation of compensatory pathways. Here, by leveraging the largest synthetic lethal genetic interactome in yeast, we identify that KRAS-mutated colorectal cancer cells have augmented homologous recombination repair (HRR) signaling. We found that KRAS mutation resulted in slowing and stalling of the replication fork and accumulation of DNA damage. Moreover, we found that KRAS-mutant HCT116 cells have an increase in MYC-mediated RAD51 expression with a corresponding increase in RAD51 recruitment to irradiation-induced DNA double-strand breaks (DSBs) compared to genetically complemented isogenic cells. MYC depletion using RNA interference significantly reduced IR-induced RAD51 foci formation and HRR. On the contrary, overexpression of either HA-tagged wild-type (WT) MYC or phospho-mutant S62A increased RAD51 protein levels and hence IR-induced RAD51 foci. Likewise, depletion of RAD51 selectively induced apoptosis in HCT116-mutant cells by increasing DSBs. Pharmacological inhibition targeting HRR signaling combined with PARP inhibition selectivity killed KRAS-mutant cells. Interestingly, these differences were not seen in a second isogenic pair of KRAS WT and mutant cells (DLD-1), likely due to their nondependency on the KRAS mutation for survival. Our data thus highlight a possible mechanism by which KRAS-mutant-dependent cells drive HRR in vitro by upregulating MYC-RAD51 expression. These data may offer a promising therapeutic vulnerability in colorectal cancer cells harboring otherwise nondruggable KRAS mutations, which warrants further investigation in vivo.

Keywords: KRAS; RAD51; DNA damage response; colorectal cancer; homologous recombination repair; therapeutic vulnerability.


Figures

Figure 1
Figure 1
KRAS‐dependent genetic network analysis. (A) Correlation‐based network with P‐value connecting possible Ras‐interacting genes with similar genetic interaction clusters showing pathway enrichment in DNA damage response signaling. (B) Using KRAS as a ‘query gene’, the 39 genes were included to the ingenuity pathway analysis (IPA) to determine possible KRAS‐mediated network. Seventeen of 39 genes were clustered by KRAS gene in the network. The pathway analysis revealed central nodes of AKT or NFκB in regulating HRR genes.
Figure 2
Figure 2
Validation of synthetic lethal interactions with KRAS in isogenic colorectal cancer lines. (A, B) Isogenic lines were reverse‐transfected with 10 nm of indicated siRNAs, and cell viability was determined after 96 h. (C) HCT116 and HKe‐3 lines were transfected with 10 nm of siRNA individually or in combination with siKRAS and cell viability was determined after 96 h. Scr: Scrambled siRNA was used as control and relative cell viability was determined to the scr control‐transfected cells. ****< 0.0001; ***< 0.001; **< 0.01; ns: not significant. Error bars represent the standard error of the mean (SEM) from three independent experiments.
Figure 3
Figure 3
Mutant KRAS‐induced replication stress and DNA damage. (A) Labeling of BrdU analogs for DNA fiber analysis during replication. Both isogenic KRAS‐mutant (HCT116) and wild‐type (HKe‐3) cells pulse‐labeled with IdU (red) and CldU (green) for 20 min and the fibers were imaged and quantified. (B) Percentage of stalled replication forks (left) and representative images of stalled replication fork DNA fibers in HCT116 (right). (C) Immunoblot analysis of phospho‐S33 RPA32, γH2AX, RAD51, CHK1, and NBS1 in isogenic lines. COXIV expression was used as a loading control. Velocity of progressing forks (D) and distributions of replication fork speeds (E) were determined in both isogenic lines. At least 300 fibers from each cell line were analyzed from two independent experiment, and error bars represent the standard error of the mean (SEM). Unpaired t‐test with and without Welch's correction between two groups was used to determine the statistical significance, *P < 0.05; ****< 0.0001.
Figure 4
Figure 4
Mutant KRAS‐mediated RAD51‐dependent homologous recombination repair is elevated in KRAS‐mutant colorectal cancer. (A) Representative images of the isogenic colorectal cancer lines immunostained with anti‐RAD51 (green) and anti‐DAPI (blue) following 6‐Gy ionizing radiation processed after 6 h. (B) Left: quantification of RAD51 foci‐positive cells from experiment in A. The percentage of cells with > 10 RAD51 foci was calculated. Error bars denote SEM (n = 3 with more than 50 cells scored for each independent experiment). Right: immunoblot analysis of RAD51 expression in the isogenic lines. COXIV was used as a loading control. (C) Propidium iodide (PI) cell cycle profiles of isogenic cell lines before and at 6 h following 6 Gy of ionizing radiation, n = 3 ± SEM. (D) Left: HRR efficiency in isogenic lines was determined using an HRR reporter assay based on pDRGFP and I‐SceI (pCBSCE) plasmids. Twenty‐four hours after cotransfection, FACS analysis was carried out to detect GFP‐positive cells, n = 2 ± SEM. Right: representative images of GFP‐positive cells that had successfully undergone HRR in HCT116 cells. Quantification of (E) 53BP1 and (F) γH2AX foci clearance following 1 Gy of ionizing radiation in a time‐dependent manner in KRAS‐mutant and wild‐type isogenic colorectal cancer lines. Y‐axis represents percentage of foci remaining at the indicated time points (with the average number of foci at 0.5 h being 100%). Cells were costained for cyclin A to demarcate G1 (cyclin A −ve) versus S/G2 (cyclin A +ve) populations. The percentage of cells with foci remaining was calculated and plotted against the indicated times post‐IR. Error bars denote SEM (50 nuclei were scored for each time point).
Figure 5
Figure 5
RAD51 loss impacts survival advantage in KRAS‐mutant colorectal cancer. (A) Immunoblot analysis of RAD51 expression in a panel of human colorectal cancer lines including the isogenic lines. COXIV expression was used as a loading control. Protein band intensities were measured using imagej software. RAD51 protein expression across the cell lines was calculated relative to KRAS wild‐type LIM1215 cell line. (B–D) A panel of colorectal cancer lines was either reverse‐transfected with 10 nm of siRNA (left) or treated with 0.5 μm AZD6244, a MEK1/2 inhibitor, and cell viability was determined after 96 h. Relative cell viability was determined by comparing with scrambled control‐transfected/DMSO‐treated cells. (E) Isogenic paired lines were reverse‐transfected with 10 nm of pooled siRNA against RAD51, and after 48 h, immunoblot analysis was performed to determine expression of RAD51, cleaved PARP, total and phosphorylated H2AX, AKT, and ERK1/2. COXIV expression was used as a loading control. (F) Immunoblot analysis of RAD51 expression following c‐MYC and ETS‐1 silencing in the isogenic lines. COXIV expression was used as a loading control. (G) Representative images of RAD51 foci with and without c‐MYC silencing in irradiated (6‐Gy) HCT116 cells, immunostained 6 h later with anti‐RAD51 (red), anti‐c‐MYC (green), and anti‐DAPI (blue). Right: quantification of RAD51 foci cells from experiment in F. The percentage of cells with > 10 RAD51 foci counted. Error bars denote SEM (more than 200 nuclei were scored). (H) Quantification of IR (6‐Gy)‐induced RAD51 foci‐positive cells analyzed 6 h after treatment in HKe‐3 cells transfected with either wild‐type HA‐tagged MYC or phospho‐mutant S62A. Mock‐transfected parental cells were used as a control. The percentage of cells with > 10 RAD51 foci were counted. (I) Immunoblot analysis of RAD51 expression following c‐MYC overexpression in HKe‐3 cells. COXIV expression was used as a loading control. Error bars denote SEM (more than 200 nuclei were scored) ****P < 0.0001; ***< 0.001; **< 0.01.
Figure 6
Figure 6
Dual inhibition of RAD51‐MEK1/2, PI3K/Akt/mTORPARP1, or CHK1‐PARP synergistically induces lethality in KRASmutant colorectal cancer cells. (A) Isogenic KRASmutant colorectal cancer lines were reverse‐transfected with 10 nm of siRAD51 for 24 h, followed by 1.0 μm of AZD6244, and immunoblot analysis was performed for an additional 24 h to determine the expression of RAD51, cleaved PARP, γH2AX, total and phosphorylated ERK1/2. (B) Isogenic colorectal cancer cell lines were exposed with different concentrations of RI‐1, a RAD51 inhibitor, and cell viability was determined after 96 h. The dose–response curve was generated by calculating relative cell viability plotted against drug concentration. (C) Isogenic KRASmutant colorectal cancer lines were treated with 10 μm of AZD2281, a PARP inhibitor alone, or in combination with 0.5 μm BEZ235, a PI3K/Akt/mTOR inhibitor, and immunoblot analysis was performed for 48 h to determine the expression of RAD51, cleaved PARP, γH2AX, and phosphorylated AKT. (D) KRASmutant isogenic colorectal cancer lines were treated with BEZ235, AZD2281, or a combination of both inhibitors for 24 h and immunostained for 53BP1 foci. Individual foci number counts (left panels) and average number of foci per cell (right panel) are shown. Error bars denote SEM (n = 2 where more than 50 cells were scored for each experiment). (E) Isogenic KRASmutant colorectal cancer lines were treated with 10 μm of AZD2281 alone or in combination with 0.5 μm BEZ235, and immunoblot analysis was performed for 48 h to determine phosphorylation of p53 (S15), KAP1 (S824), CHK1 (S345), and RPA32 (S4/S8). (F) Isogenic KRASmutant colorectal cancer lines were treated with 10 μm of PARP1 inhibitor alone or in combination with 0.1 μm AZD7762, a CHK1 inhibitor, and immunoblot analysis was performed for 48 h to determine the expression of RAD51, cleaved PARP, γH2AX, and CHK1. COXIV expression was used as a loading control.

References

    1. Al‐Ejeh F, Simpson PT, Sanus JM, Klein K, Kalimutho M, Shi W, Miranda M, Kutasovic J, Raghavendra A, Madore J et al (2014) Meta‐analysis of the global gene expression profile of triple‐negative breast cancer identifies genes for the prognostication and treatment of aggressive breast cancer. Oncogenesis 3, e100. - PMC - PubMed
    1. Barbie DA, Tamayo P, Boehm JS, Kim SY, Moody SE, Dunn IF, Schinzel AC, Sandy P, Meylan E, Scholl C et al (2009) Systematic RNA interference reveals that oncogenic KRAS‐driven cancers require TBK1. Nature 462, 108–112. - PMC - PubMed
    1. Bartkova J, Rezaei N, Liontos M, Karakaidos P, Kletsas D, Issaeva N, Vassiliou LV, Kolettas E, Niforou K, Zoumpourlis VC et al (2006) Oncogene‐induced senescence is part of the tumorigenesis barrier imposed by DNA damage checkpoints. Nature 444, 633–637. - PubMed
    1. Baumann P and West SC (1998) Role of the human RAD51 protein in homologous recombination and double‐stranded‐break repair. Trends Biochem Sci 23, 247–251. - PubMed
    1. Bos JL, Rehmann H and Wittinghofer A (2007) GEFs and GAPs: critical elements in the control of small G proteins. Cell 129, 865–877. - PubMed

MeSH terms